Copyright
©The Author(s) 2019.
World J Clin Oncol. Jun 24, 2019; 10(6): 222-233
Published online Jun 24, 2019. doi: 10.5306/wjco.v10.i6.222
Published online Jun 24, 2019. doi: 10.5306/wjco.v10.i6.222
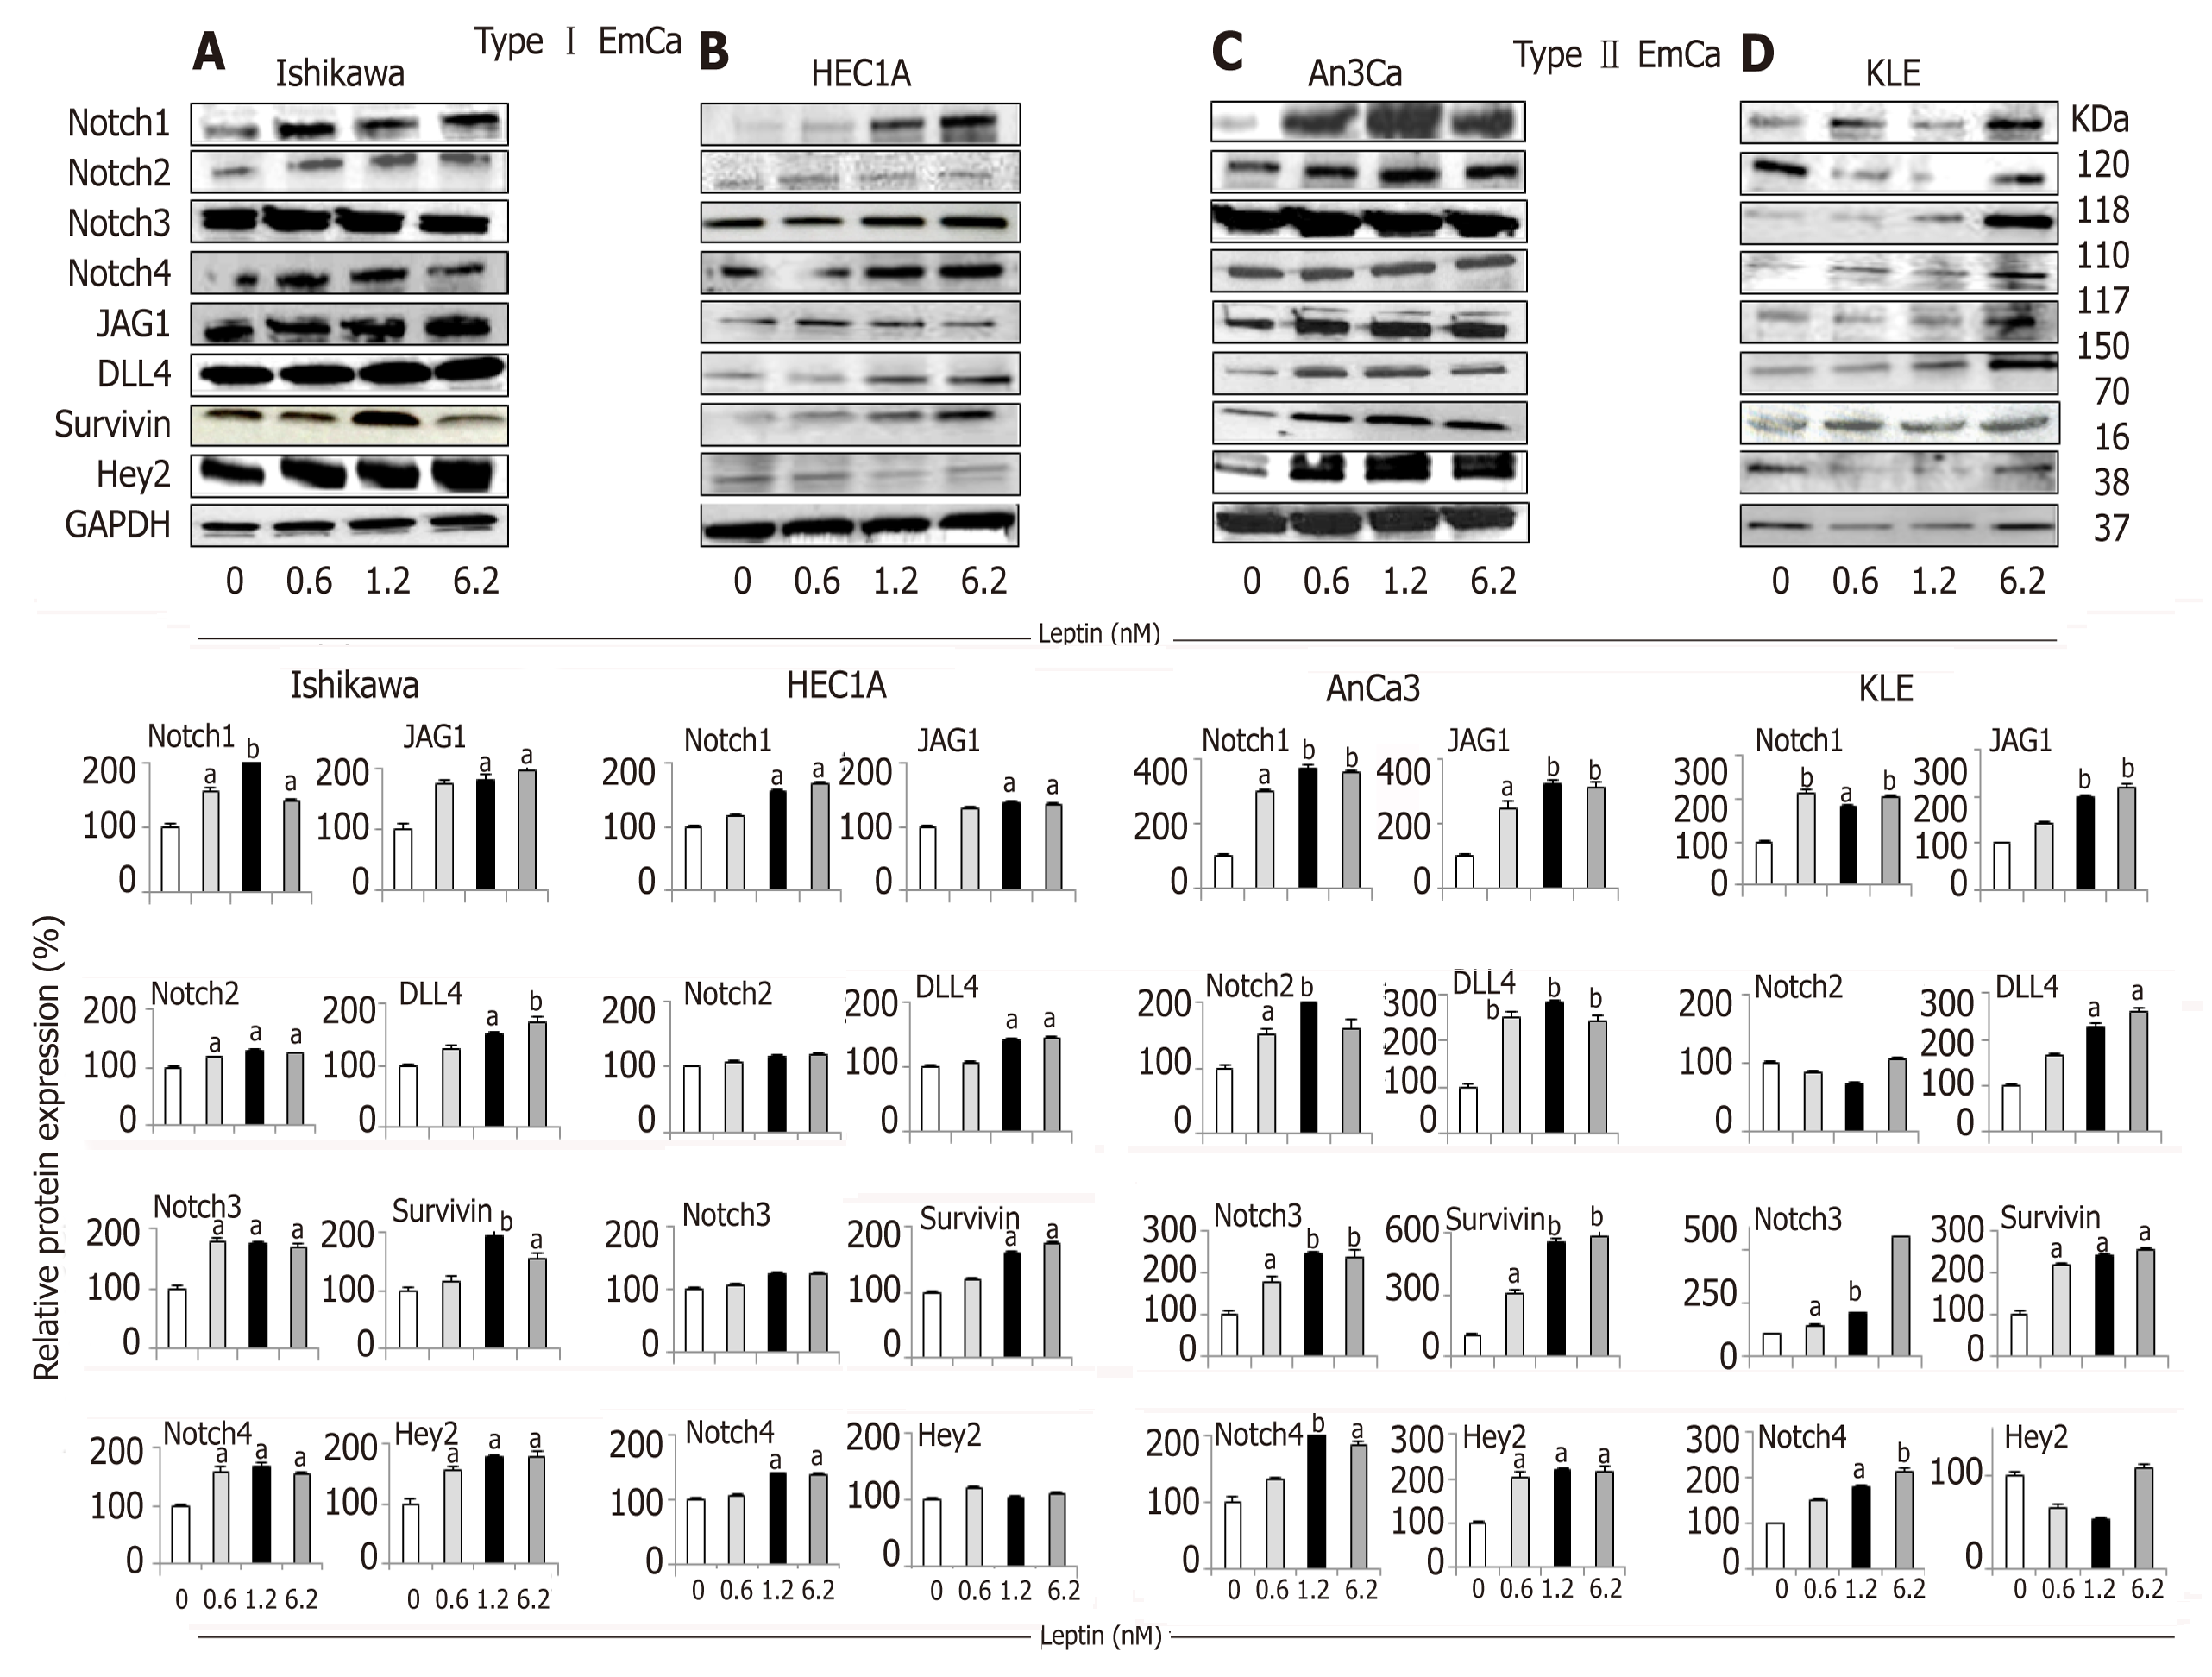
Figure 1 Leptin-induced Notch protein expression in endometrial cancer cells.
A-D: Representative results from Western Blot (WB) analysis of leptin dose-response effects on levels of Notch proteins in A and B [type I endometrial cancer (EmCa) cells] and B and C (type II EmCa cells). Leptin increases Notch protein levels (receptors: Notch1, Notch2, Notch3 and Notch4; ligands: JAG1 and DLL4 and targets: Survivin, Hey2) in type I EmCa (A, Ishikawa and B, HEC1A) and type II EmCa cells (C, An3Ca and D, KLE); Cells were cultured for 24h. Quantitative WB data (relative protein expression %) were calculated from densitometric analysis of bands with the NIH image program. The values were normalized to GAPDH as protein loading control. Data (mean ± SE) are representative results derived from a minimum of three independent experiments. aP < 0.05 and bP < 0.01 vs basal (no leptin).
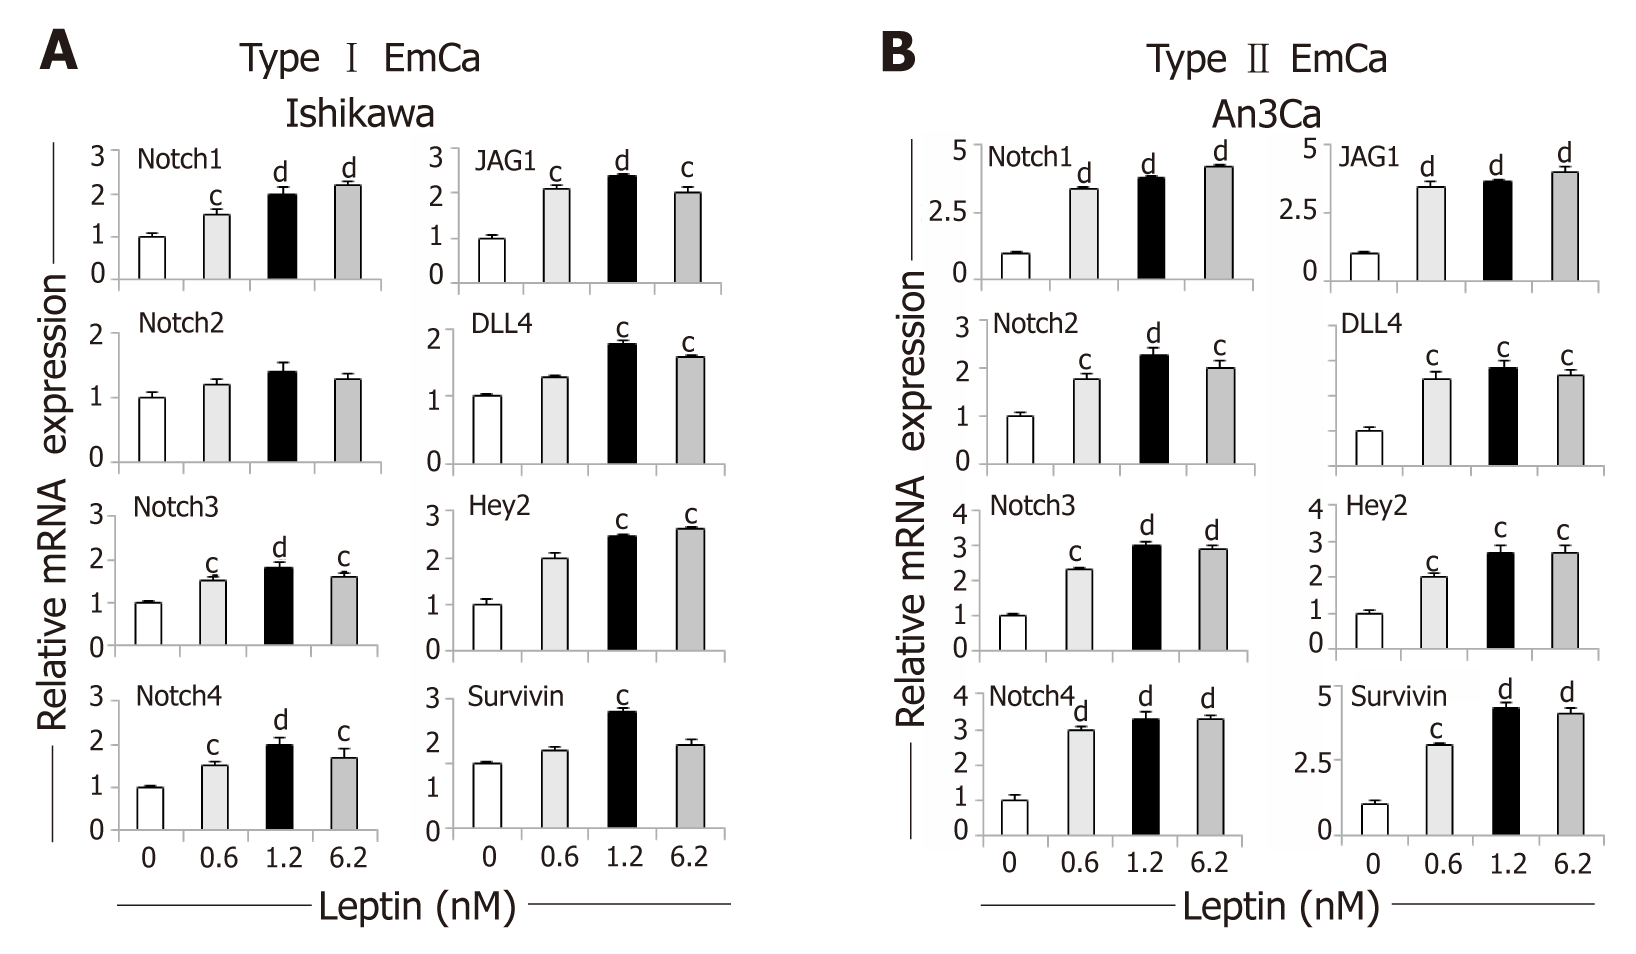
Figure 2 Dose-response effects of leptin on the levels of Notch mRNA in endometrial cancer cells.
A, B: Notch mRNA levels (receptors: Notch1, Notch2, Notch3 and Notch4; ligands: JAG1 and DLL4 and targets: Survivin, Hey2) induced by leptin (0, 0.6, 1.2 and 6.2nM) in type I endometrial cancer (EmCa) (A, Ishikawa) and type II EmCa cells (B, An3Ca). Cells were cultured for 24h. Notch mRNA levels were quantified by real-time RT-PCR. Cells were cultured for 24h. RNA expression was calculated by normalizing values to GAPDH mRNA. Data (mean ± SE) representative results derived from a minimum of 3 independent experiments. cP < 0.05 and dP < 0.01 vs basal (no leptin).
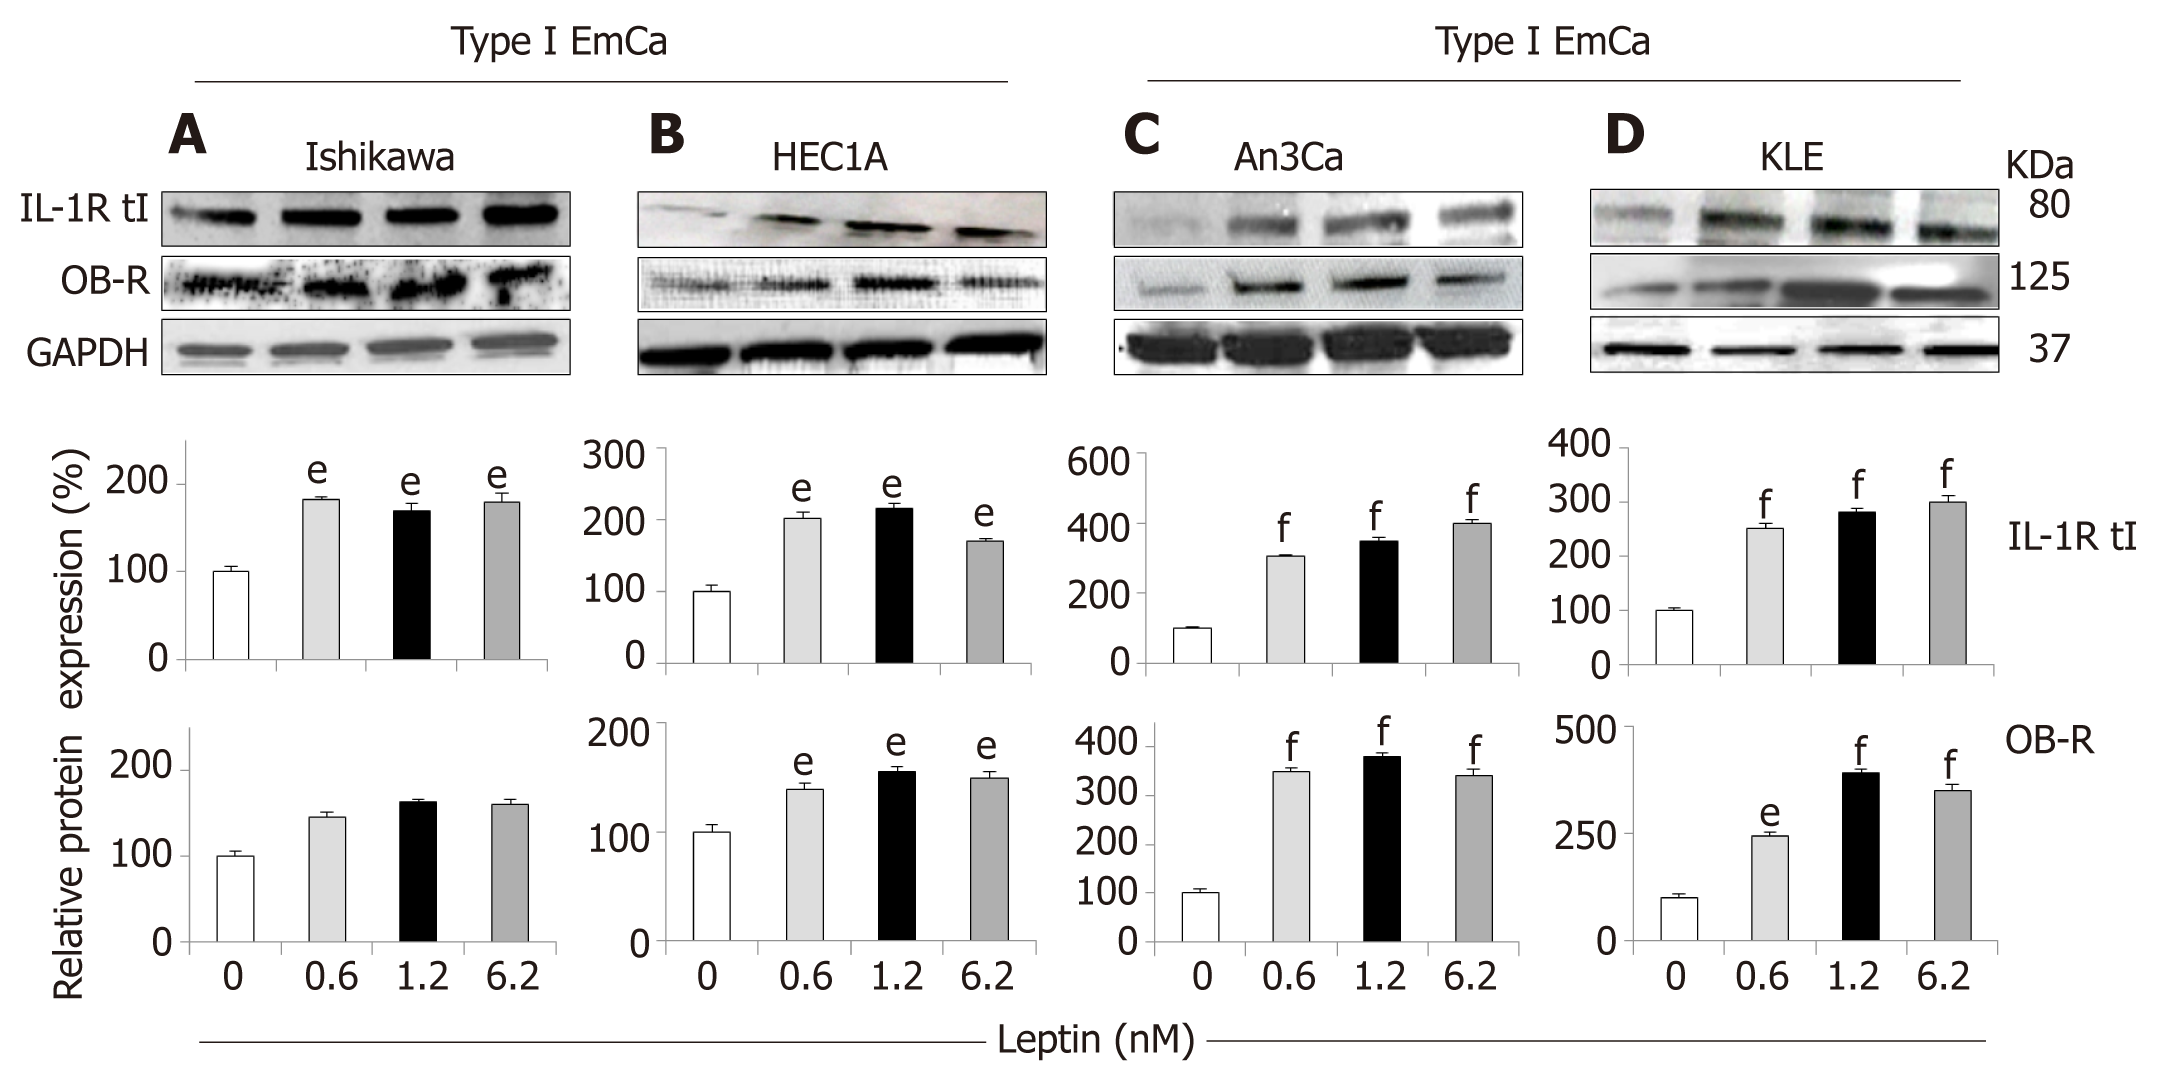
Figure 3 Leptin-induced IL-1R tI and OB-R protein expression in endometrial cancer cells.
A-D: Representative results from Western Blot (WB) analysis of leptin dose-response effects on levels of IL-1R tI and OB-R proteins in A and B [type I endometrial cancer (EmCa) cells] and B and C (type II EmCa cells). Leptin increases IL-1R tI and OB-R protein levels in type I EmCa (A, Ishikawa and B, HEC1A) and type II EmCa cells (C, An3Ca and D, KLE). Cells were cultured for 24h with leptin (0, 0.6, 1.2 and 6.2nM). Quantitative WB data (relative protein expression %) were calculated from densitometric analysis of bands with the NIH image program. The values were normalized to GAPDH as protein loading control. Data (mean ± SE) are representative of the results derived from a minimum of three independent experiments. eP < 0.05 and fP < 0.01 vs basal (no leptin).
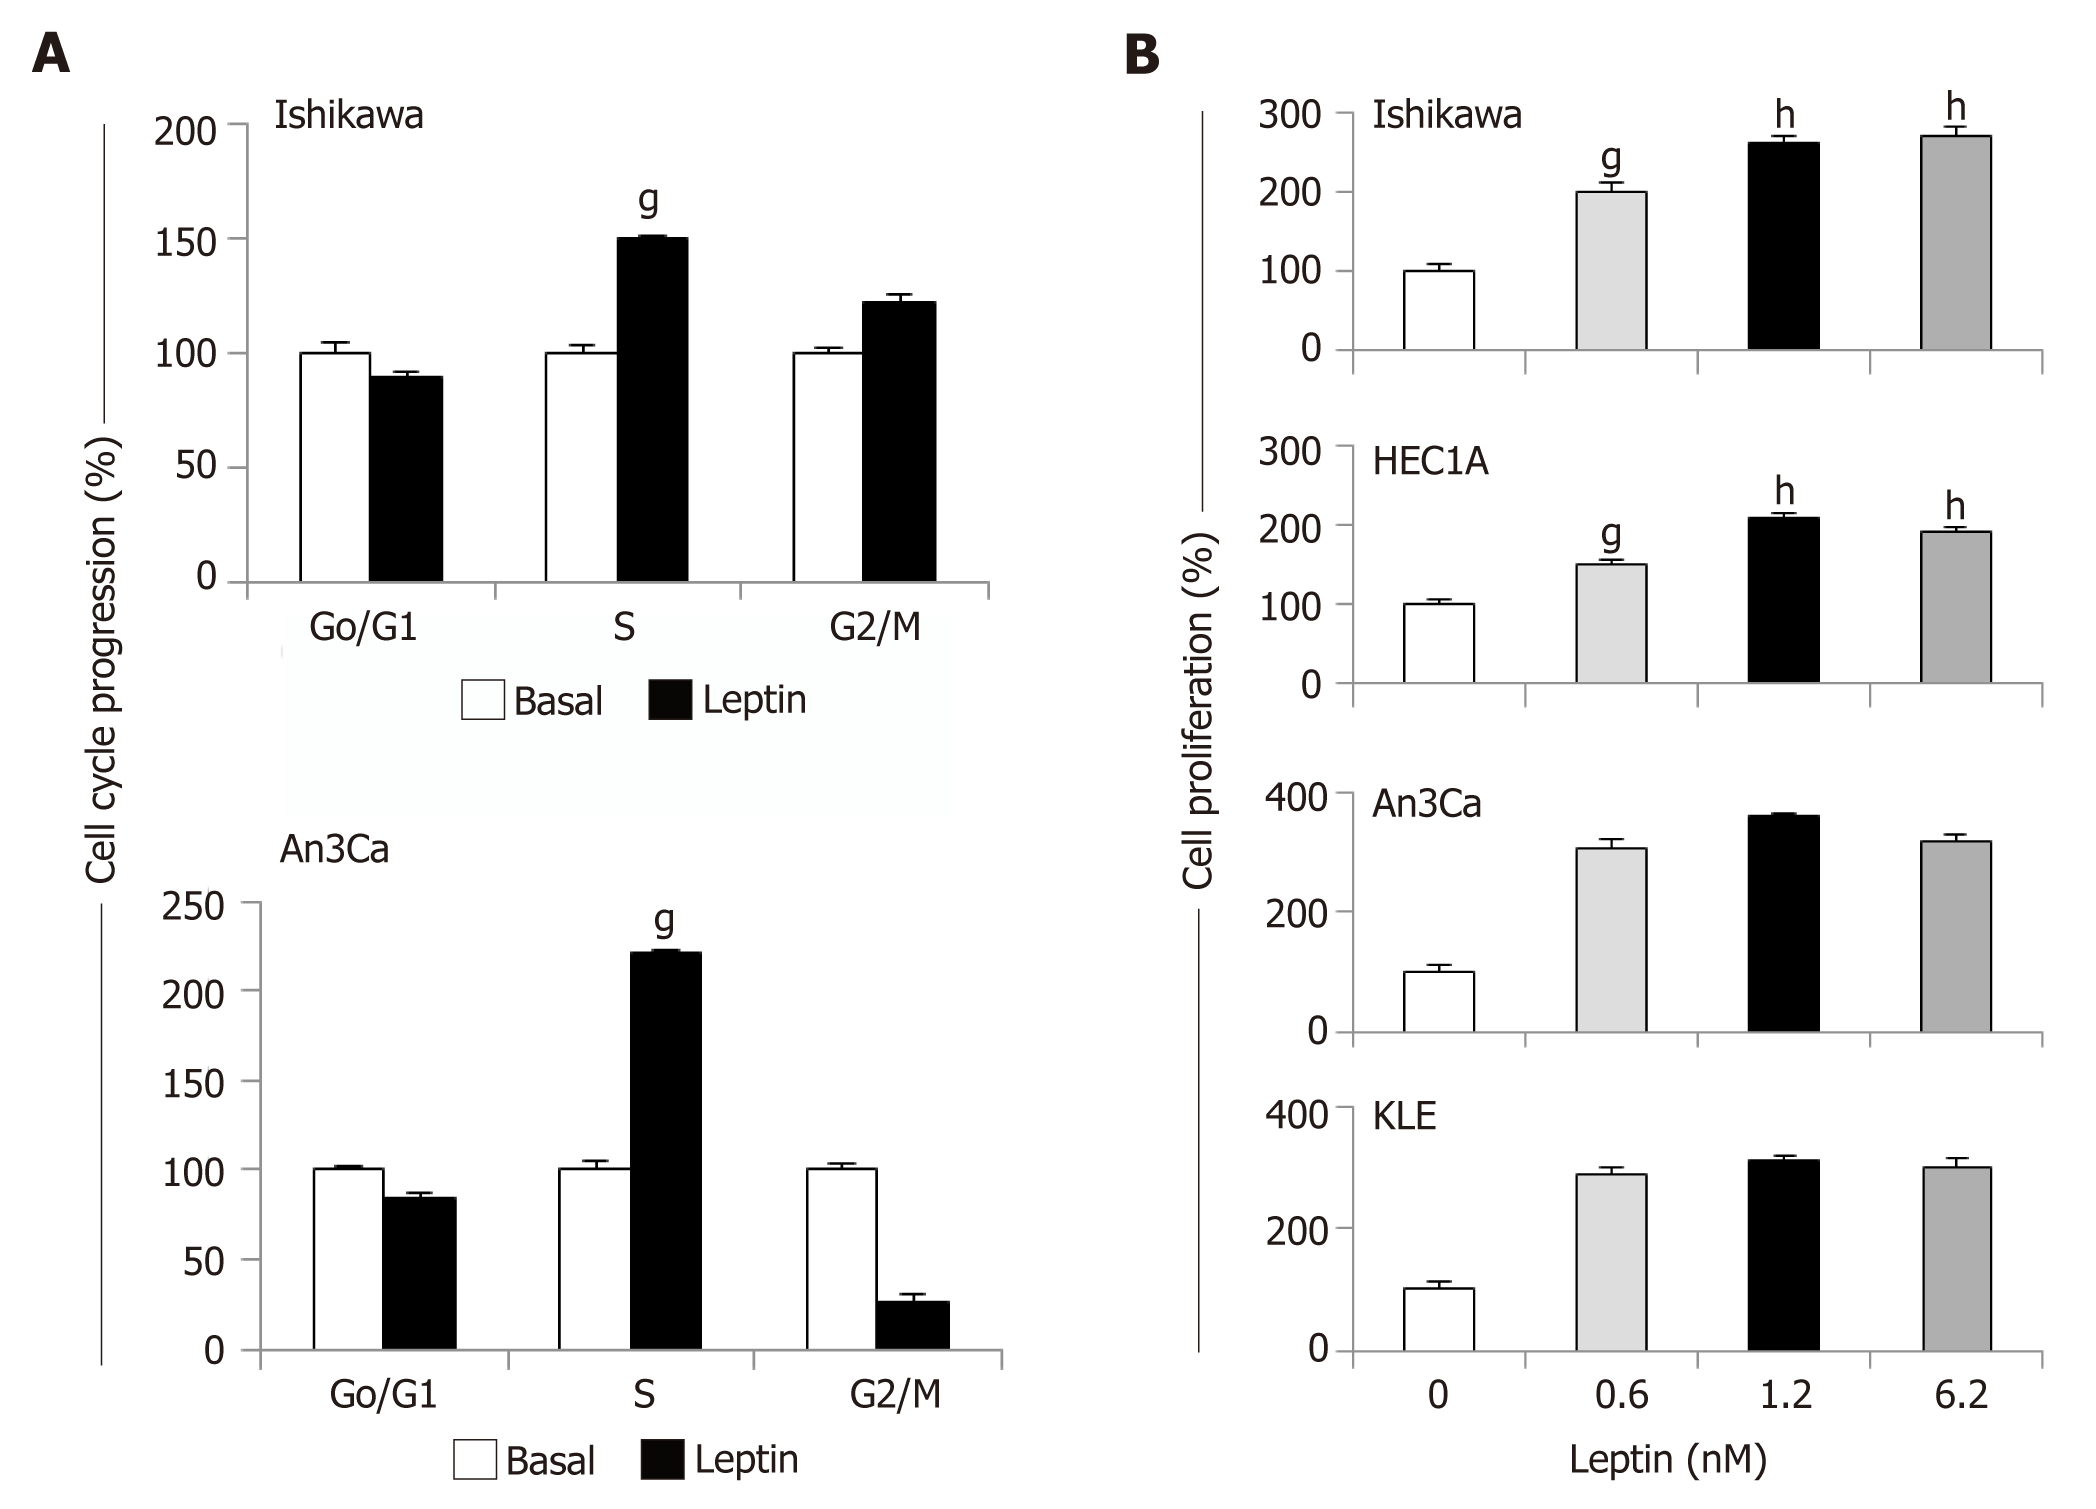
Figure 4 Leptin induces cell cycle progression and proliferation of endometrial cancer cells.
A: Leptin induces S-phase progression of endometrial cancer (EmCa) cells. Cells were cultured with leptin (0 and 1.2nM) for 24 h. Cell cycle progression was determined by image cytometry using a Cellometer Vision CBA system (Nexcelom Biosciences, Lawrence, MA); B: Results of MTT assay from EmCa cells (type I: Ishikawa and HEC1A, and type II: An3Ca and KLE) cultured with leptin (0, 0.6, 1.2 and 6.2 nM) for 24 h. Absorbance was determined at 540 nm, and data was evaluated with Spectramax software. Data (mean ± SE) are representative of the results derived from a minimum of three independent experiments. gP < 0.05 and hP < 0.01 vs basal (no leptin).
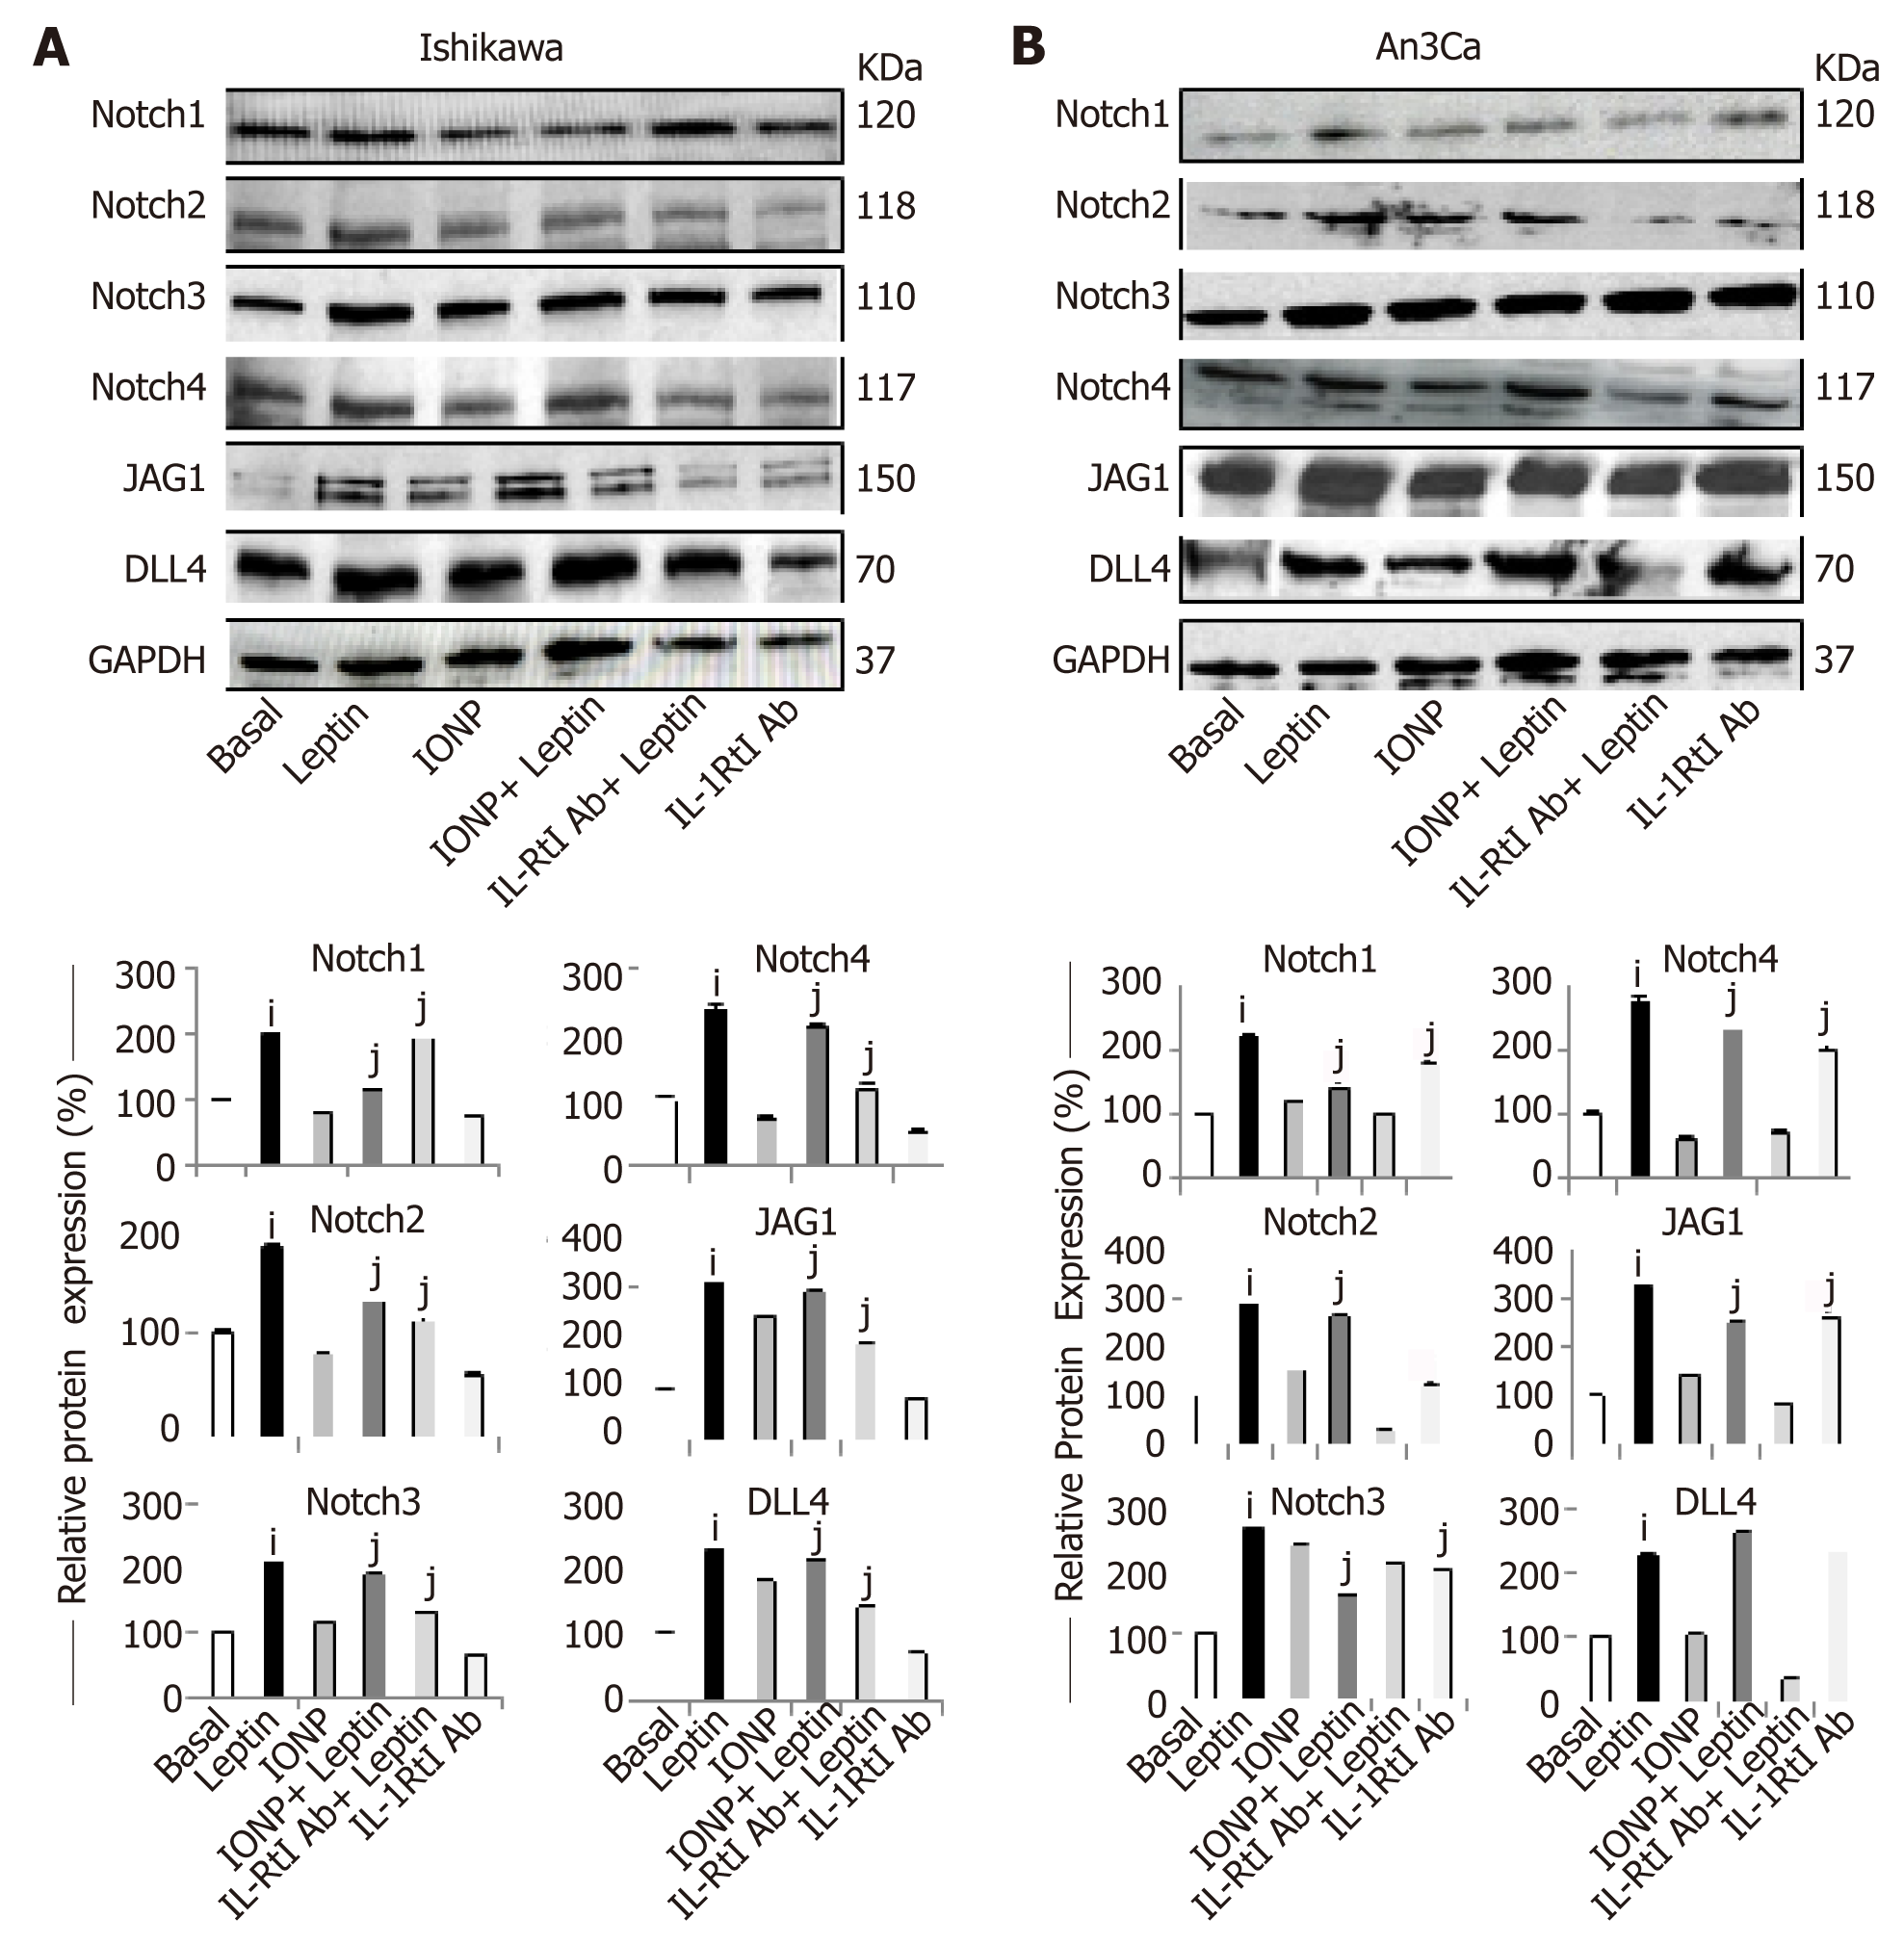
Figure 5 Inhibition of IL-1 R tI abrogates leptin induction of Notch in endometrial cancer cells.
A, B: Representative results from Western Blot (WB) analysis of the effects of IL-1R tI antibodies on leptin-induced levels of Notch proteins (receptors: Notch1, Notch2, Notch3 and Notch4, and ligands: JAG1 and DLL4) in Ishikawa [A, type I endometrial cancer (EmCa)] and An3Ca cells (B, type II EmCa). Cells were cultured for 24h with leptin (0 and 1.2nM), leptin signaling inhibitor IONP-LPrA2 (IONP), and IL-1R tI antibodies (IL-1R tI Ab). Quantitative WB data (relative protein expression %) were calculated from densitometric analysis of bands with the NIH image program. The values were normalized to GAPDH as protein loading control. Data (mean ± SE) are representative of the results derived from a minimum of three independent experiments. iP < 0.05 and jP < 0.01 vs basal (no leptin).
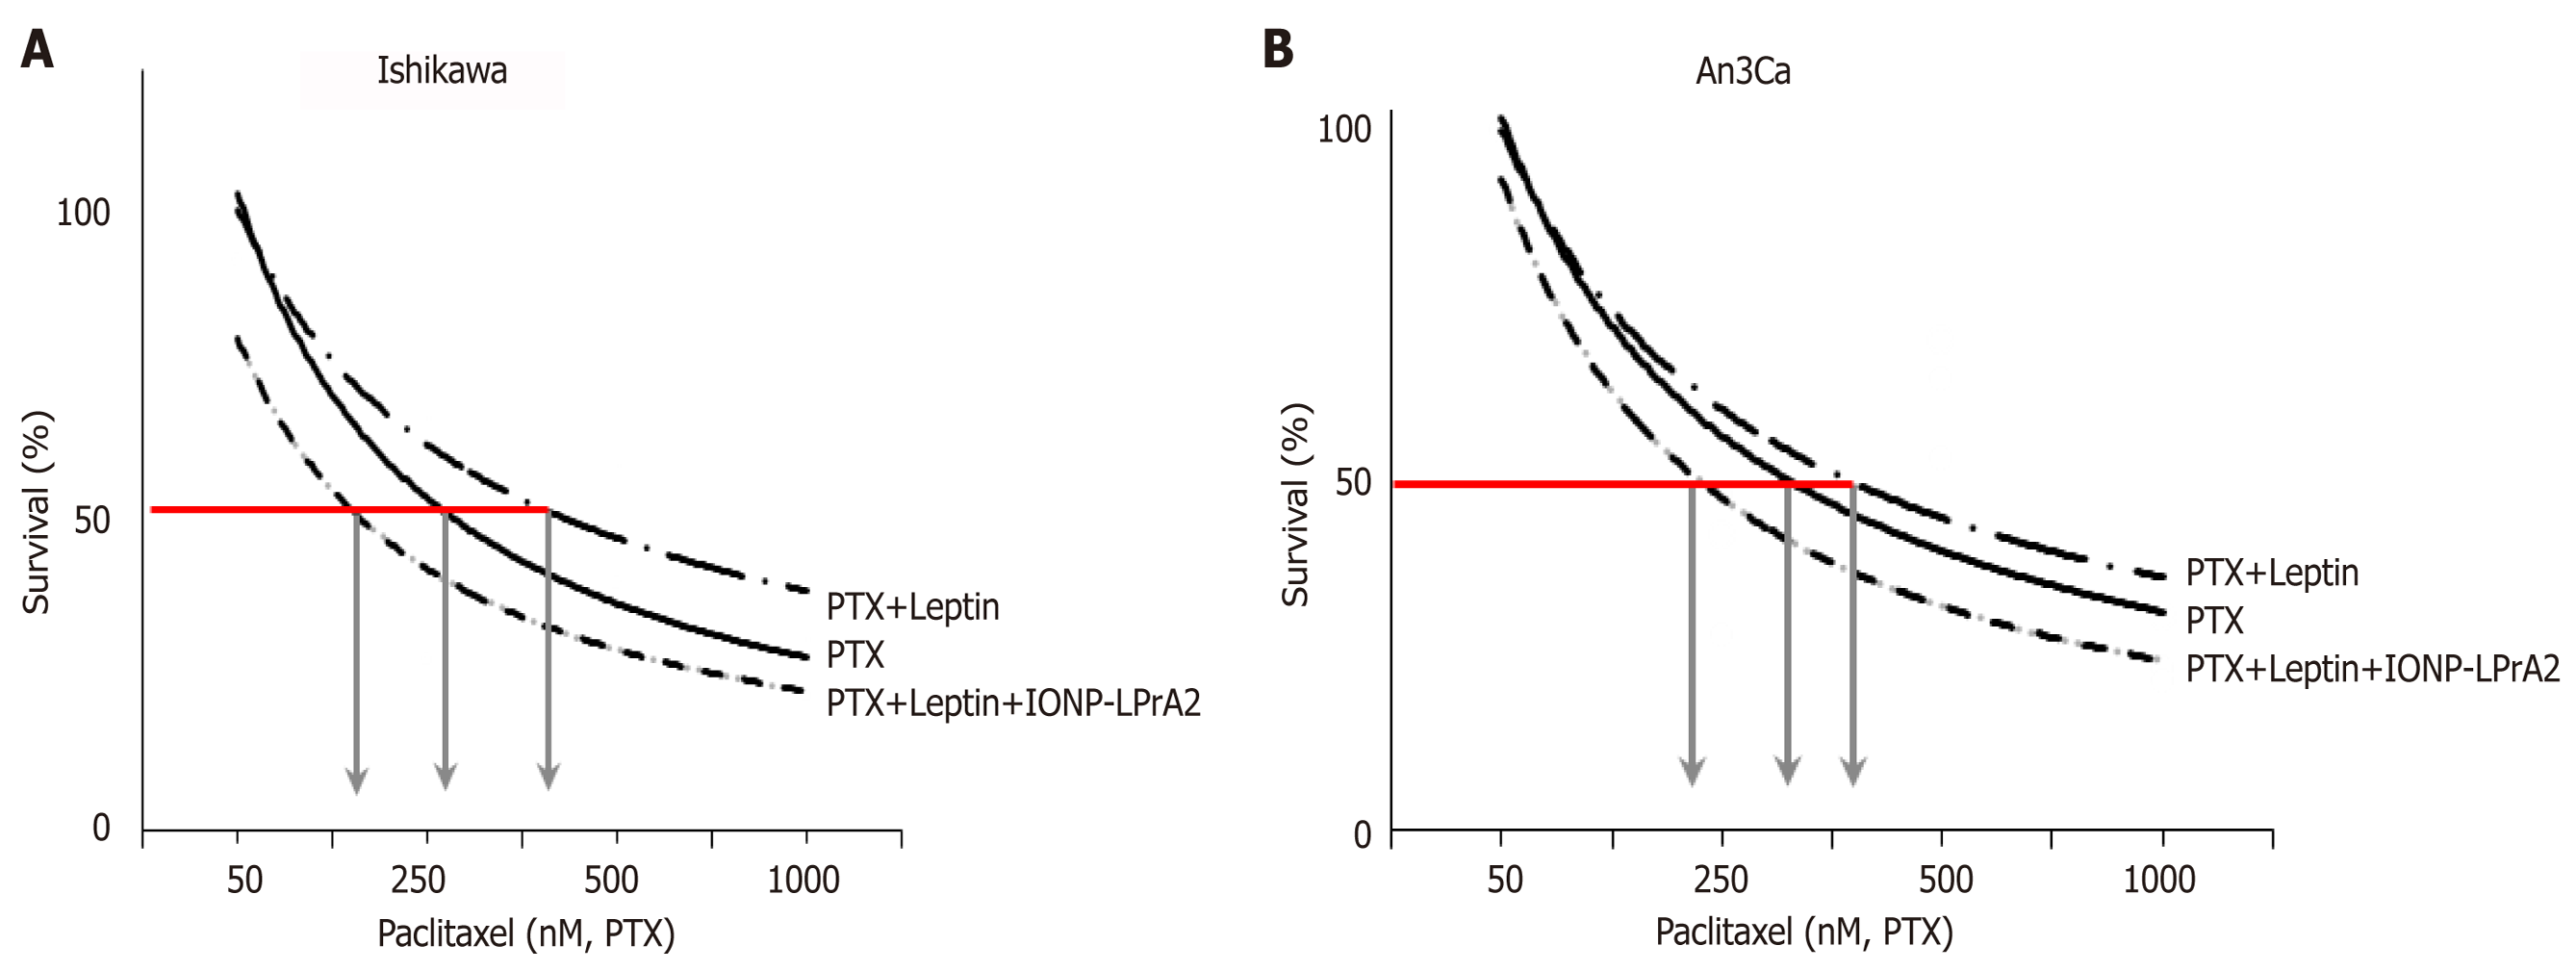
Figure 6 Leptin increases survival of endometrial cancer cells treated with paclitaxel.
A, B: Dose-response effects of paclitaxel (PTX) on survival of Ishikawa (A) and An3Ca cells (B) cultured with leptin (0 and 1.2nM) and leptin signaling inhibitor (IONP-LPrA2; 0.0036pM) for 3 d. The relative number of live cells (Survival% compared to basal) was calculated using Annexin V/FITC/PI assay by image cytometry using a Cellometer Vision CBA system (Nexcelom Biosciences, Lawrence, MA) and CCK8 assay (Cell counting kit-8 (Dojindo Molecular Technologies, Inc., Japan). The red line indicates the PTX EC50 calculated for each cell line. Arrows indicate PTX concentrations required to reduce 50% cell viability. Note that EC50 for PTX increases when leptin was added but was reduced when IONP-LPrA2 was added. Data (mean ± SE) are representative of the results derived from a minimum of three independent experiments.
- Citation: Daley-Brown D, Harbuzariu A, Kurian AA, Oprea-Ilies G, Gonzalez-Perez RR. Leptin-induced Notch and IL-1 signaling crosstalk in endometrial adenocarcinoma is associated with invasiveness and chemoresistance. World J Clin Oncol 2019; 10(6): 222-233
- URL: https://www.wjgnet.com/2218-4333/full/v10/i6/222.htm
- DOI: https://dx.doi.org/10.5306/wjco.v10.i6.222


