Copyright
©The Author(s) 2019.
World J Clin Oncol. Apr 24, 2019; 10(4): 166-182
Published online Apr 24, 2019. doi: 10.5306/wjco.v10.i4.166
Published online Apr 24, 2019. doi: 10.5306/wjco.v10.i4.166
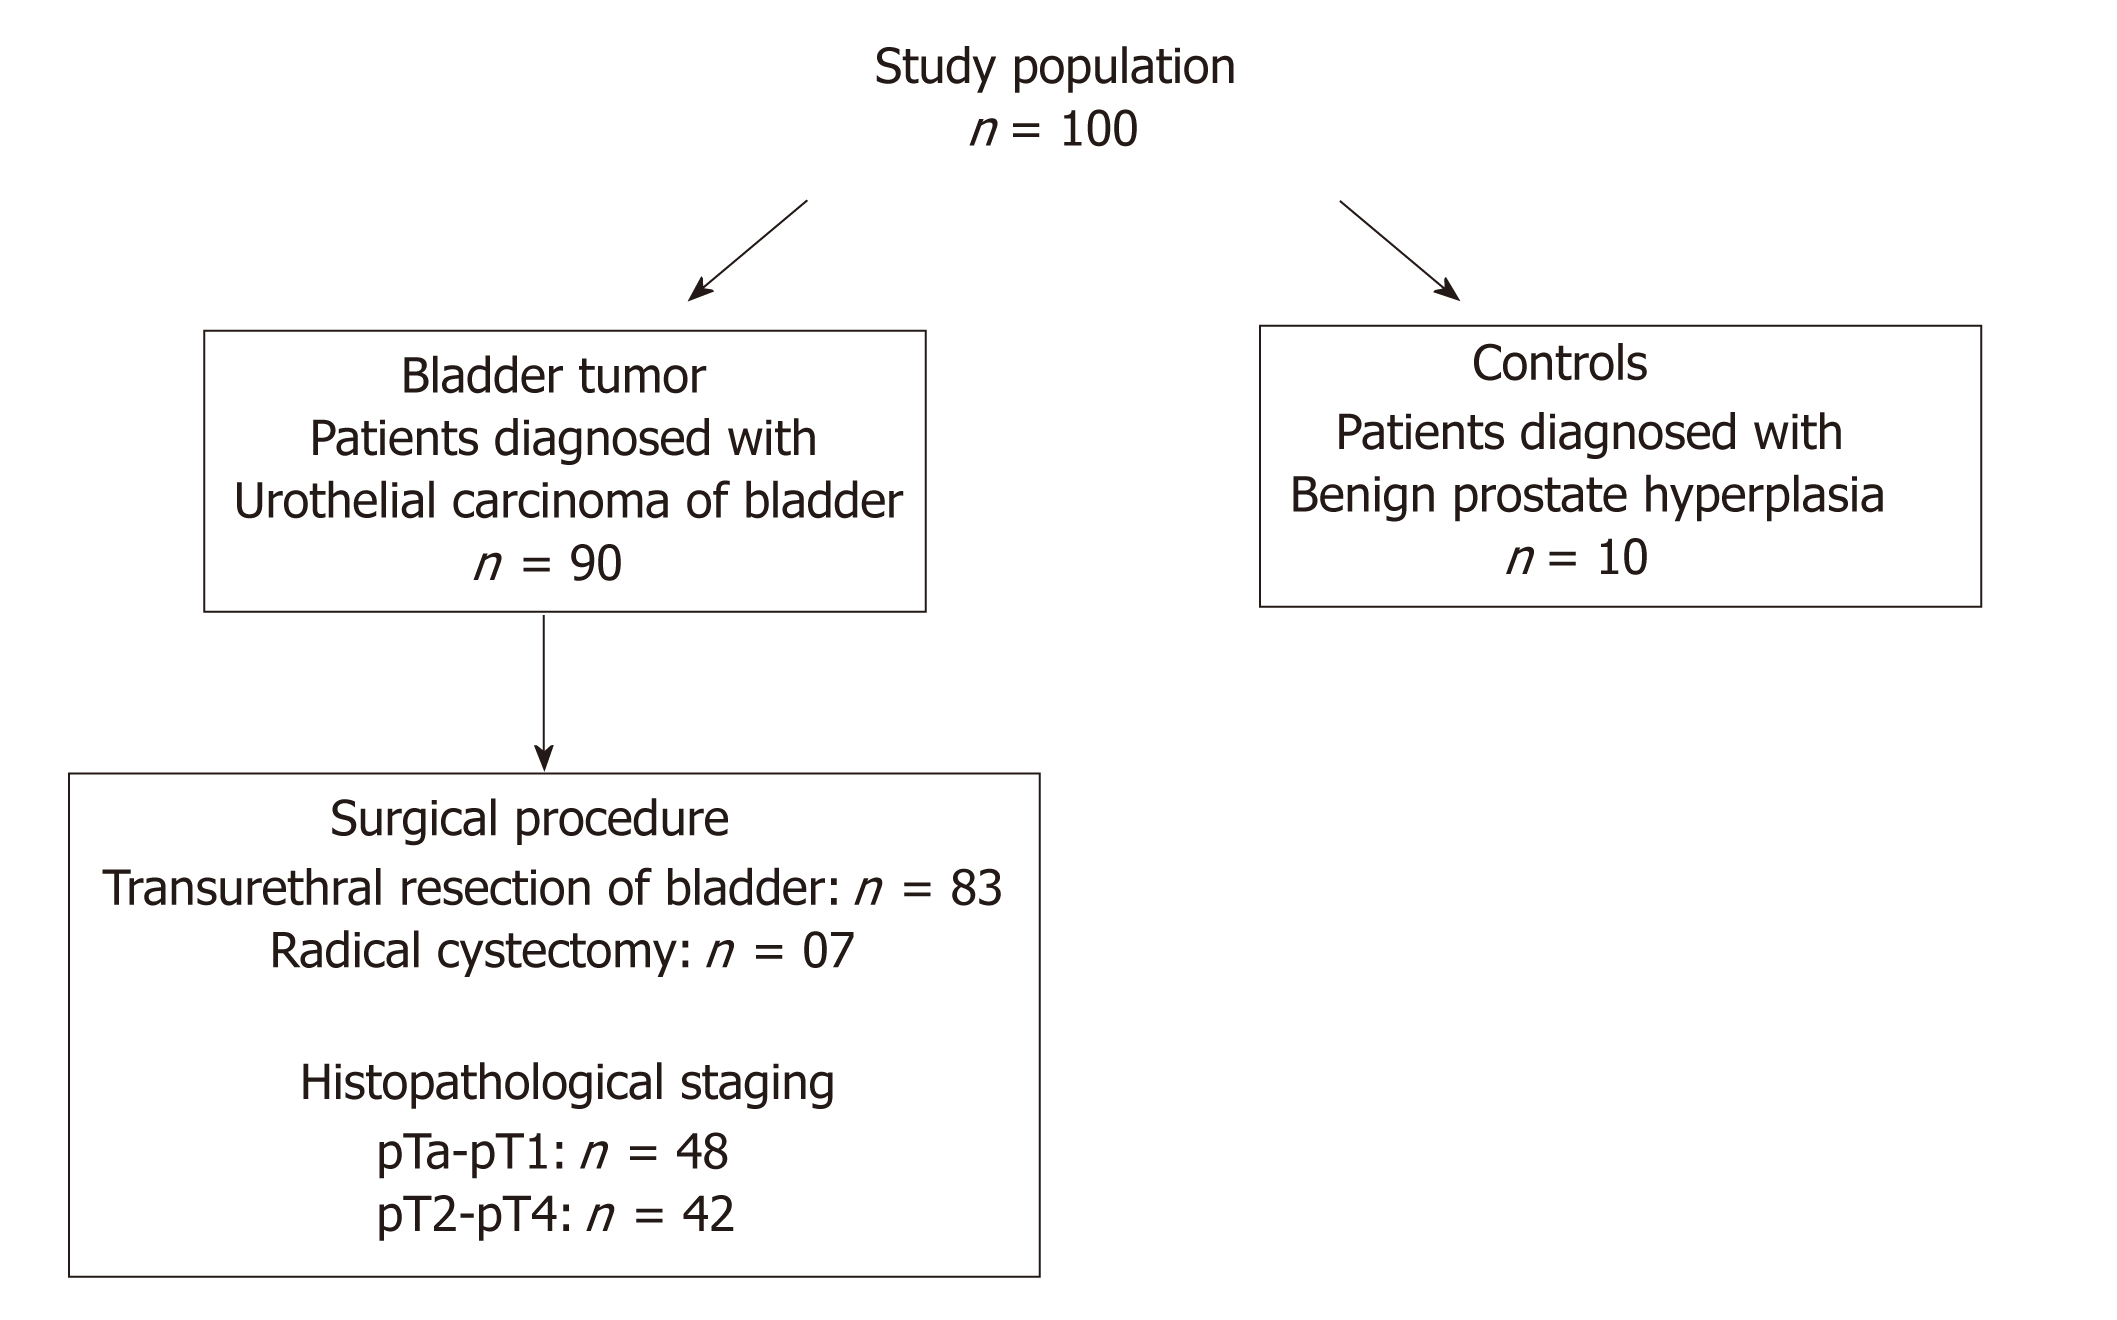
Figure 1 Flow chart of the number and selection of patients/controls in the study population.
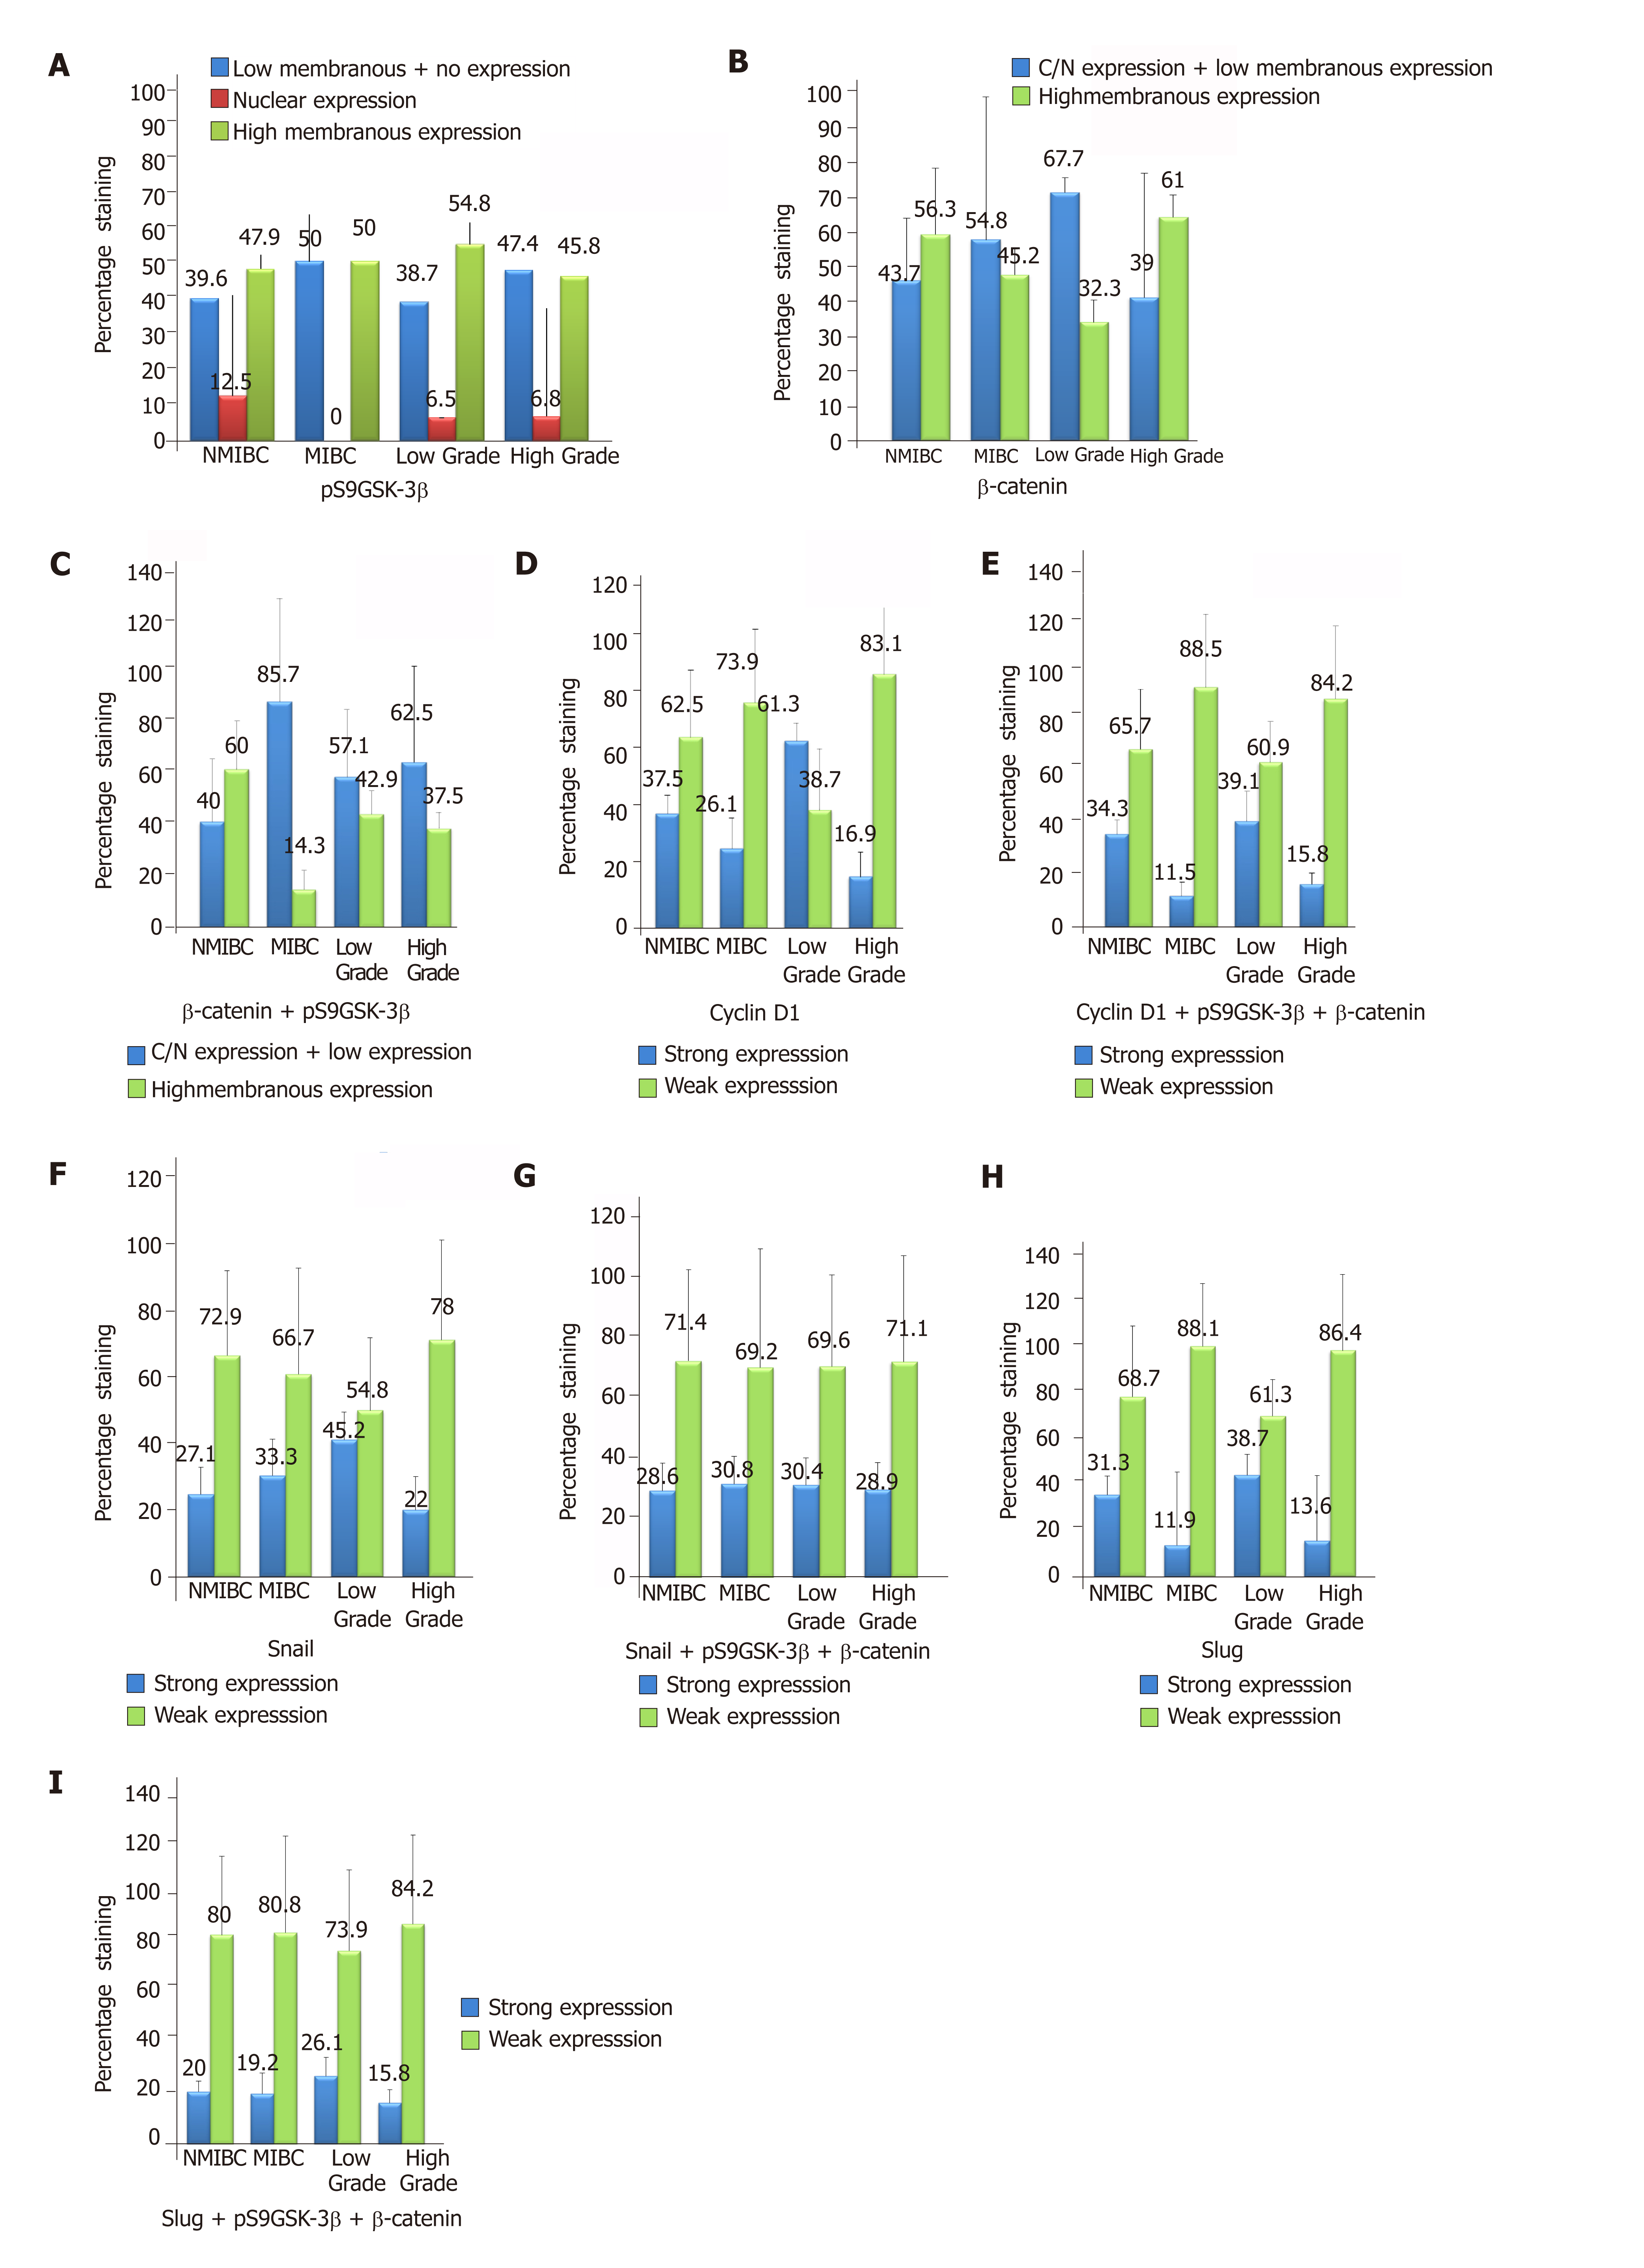
Figure 2 Graphical representation of percent immunohistochemical expression of marker proteins in 90 tissues of low stage (non-muscle invasive bladder cancer)/high stage (muscle invasive bladder cancer) and low grade/high grade tumors.
A: pS9GSK-3β [Normal expression: strong membranous expression in urothelium; Aberrant expression: low membranous, strong nuclear and cytoplasmic, no expression in urothelium]; B: β-Catenin [Normal expression: strong membranous expression in urothelium; Aberrant expression: low membranous, strong nuclear and cytoplasmic, no expression in urothelium]; C: β-Catenin + pS9GSK-3β; D: Cyclin D1 [Normal expression: strong nuclear expression in mesenchymal area; Aberrant expression: strong nuclear expression in mesenchymal area]; E: Cyclin D1 + pS9GSK-3β + β-Catenin; F: Snail [Normal expression: strong nuclear expression in mesenchymal area; Aberrant expression: strong nuclear expression in mesenchymal area]; G: Snail + pS9GSK-3β + β-Catenin; H: Slug [Normal expression: strong nuclear expression in mesenchymal area; Aberrant expression: strong nuclear expression in mesenchymal area]; I: Slug + pS9GSK-3β + β-Catenin. Numbers mentioned at the top of bars represent percentage staining of target proteins. IHC expression: Immunohistochemical expression; MIBC: Muscle invasive bladder cancer; NMIBC: Non-muscle invasive bladder cancer.
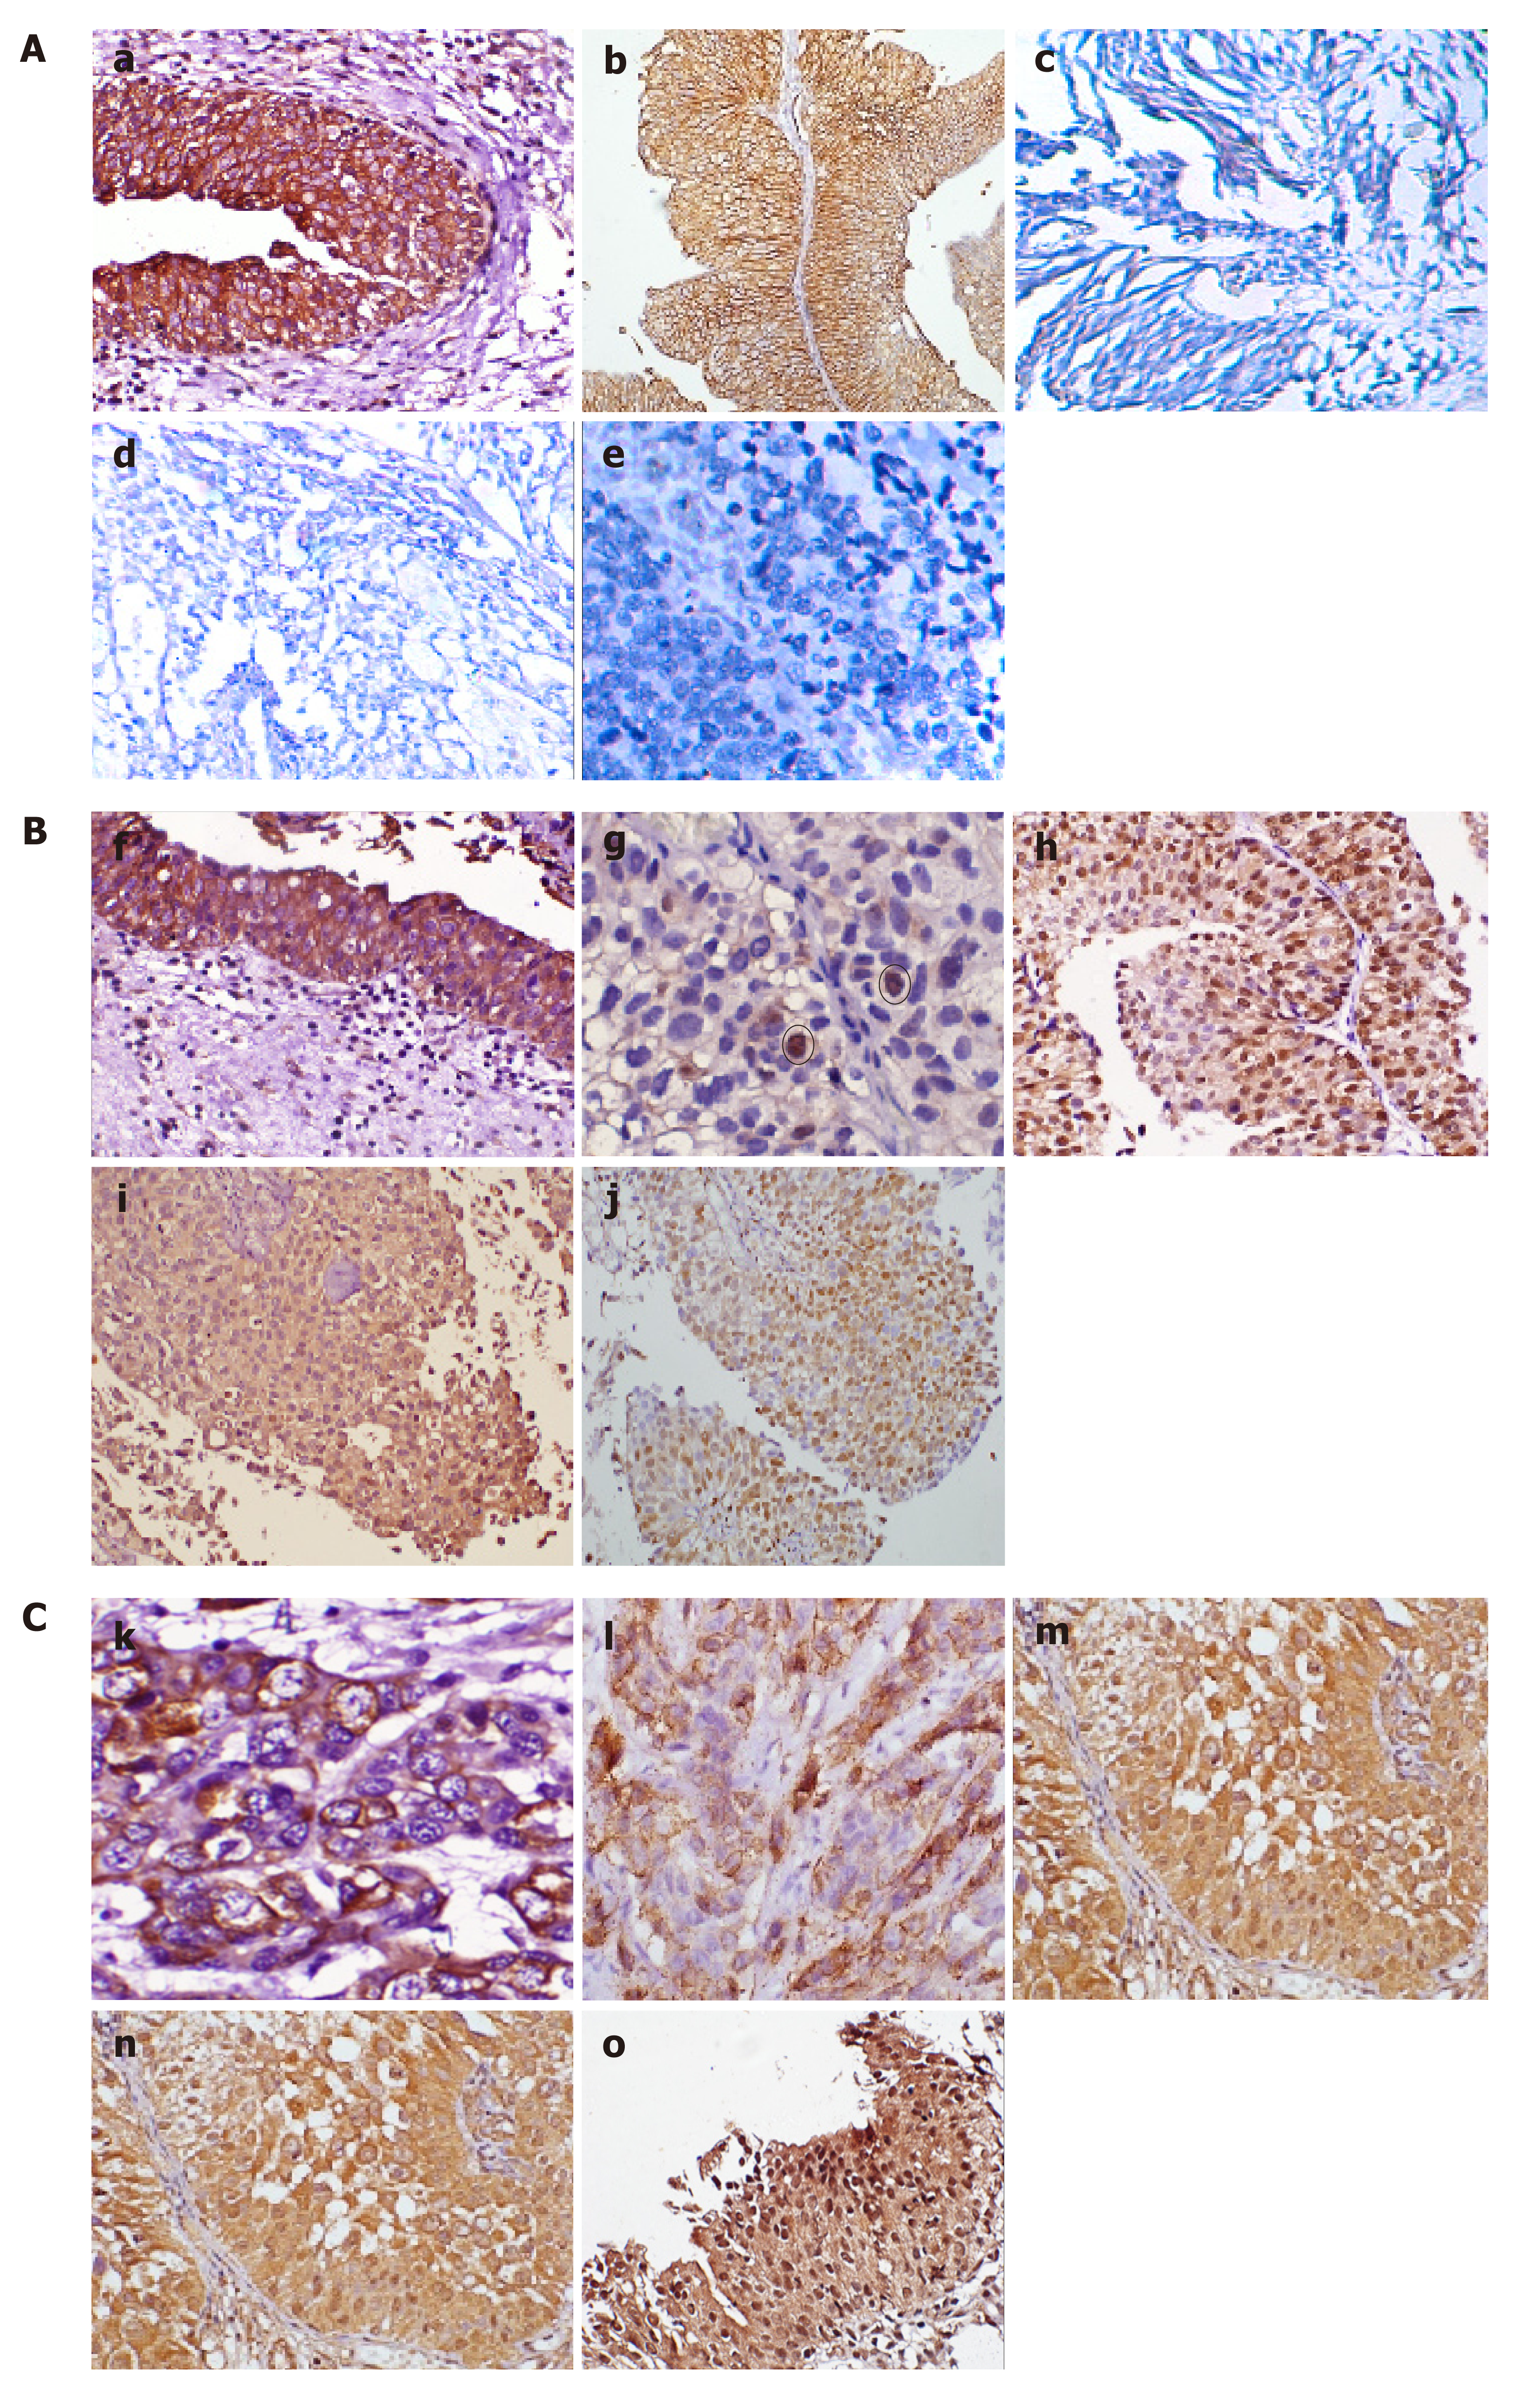
Figure 3 Representative images of immunohistochemical staining of marker protein in urinary bladder tumors at the magnification of 400×.
A: Controls: a: Positive control for pS9GSK-3β showing strong membranous expression in normal urothelium; b: Positive control for β-catenin showing high membranous expression in normal urothelium; c: Negative control for Cyclin D1; d: Negative control for Snail; e: Negative control for Slug; B: Immunohistochemical (IHC) staining in non-muscle invasive bladder cancer cases; f: Nuclear/cytoplasmic expression of pS9GSK-3β; g: Nuclear expression of β-catenin (few tumor cells are circled); h: Cyclin D1 nuclear immunoexpression in 60%-70%; i: Snail nuclear immunopositivity in 80-90% cells; j: Slug nuclear expression in 60%-70% cells; C: IHC staining in muscle invasive bladder cancer cases; k: Loss of membranous pS9GSK-3β expression; l: Loss of β-catenin membranous expression; m: 100% nuclear staining for Cyclin D1 in urothelium; n: 100% nuclear immunoexpression of Snail in urothelium; o: 100% nuclear immunopositivity of Slug (Snail and Slug showed both nuclear and non-specific cytoplasmic staining, however, only nuclear expression was taken into account during analysis).
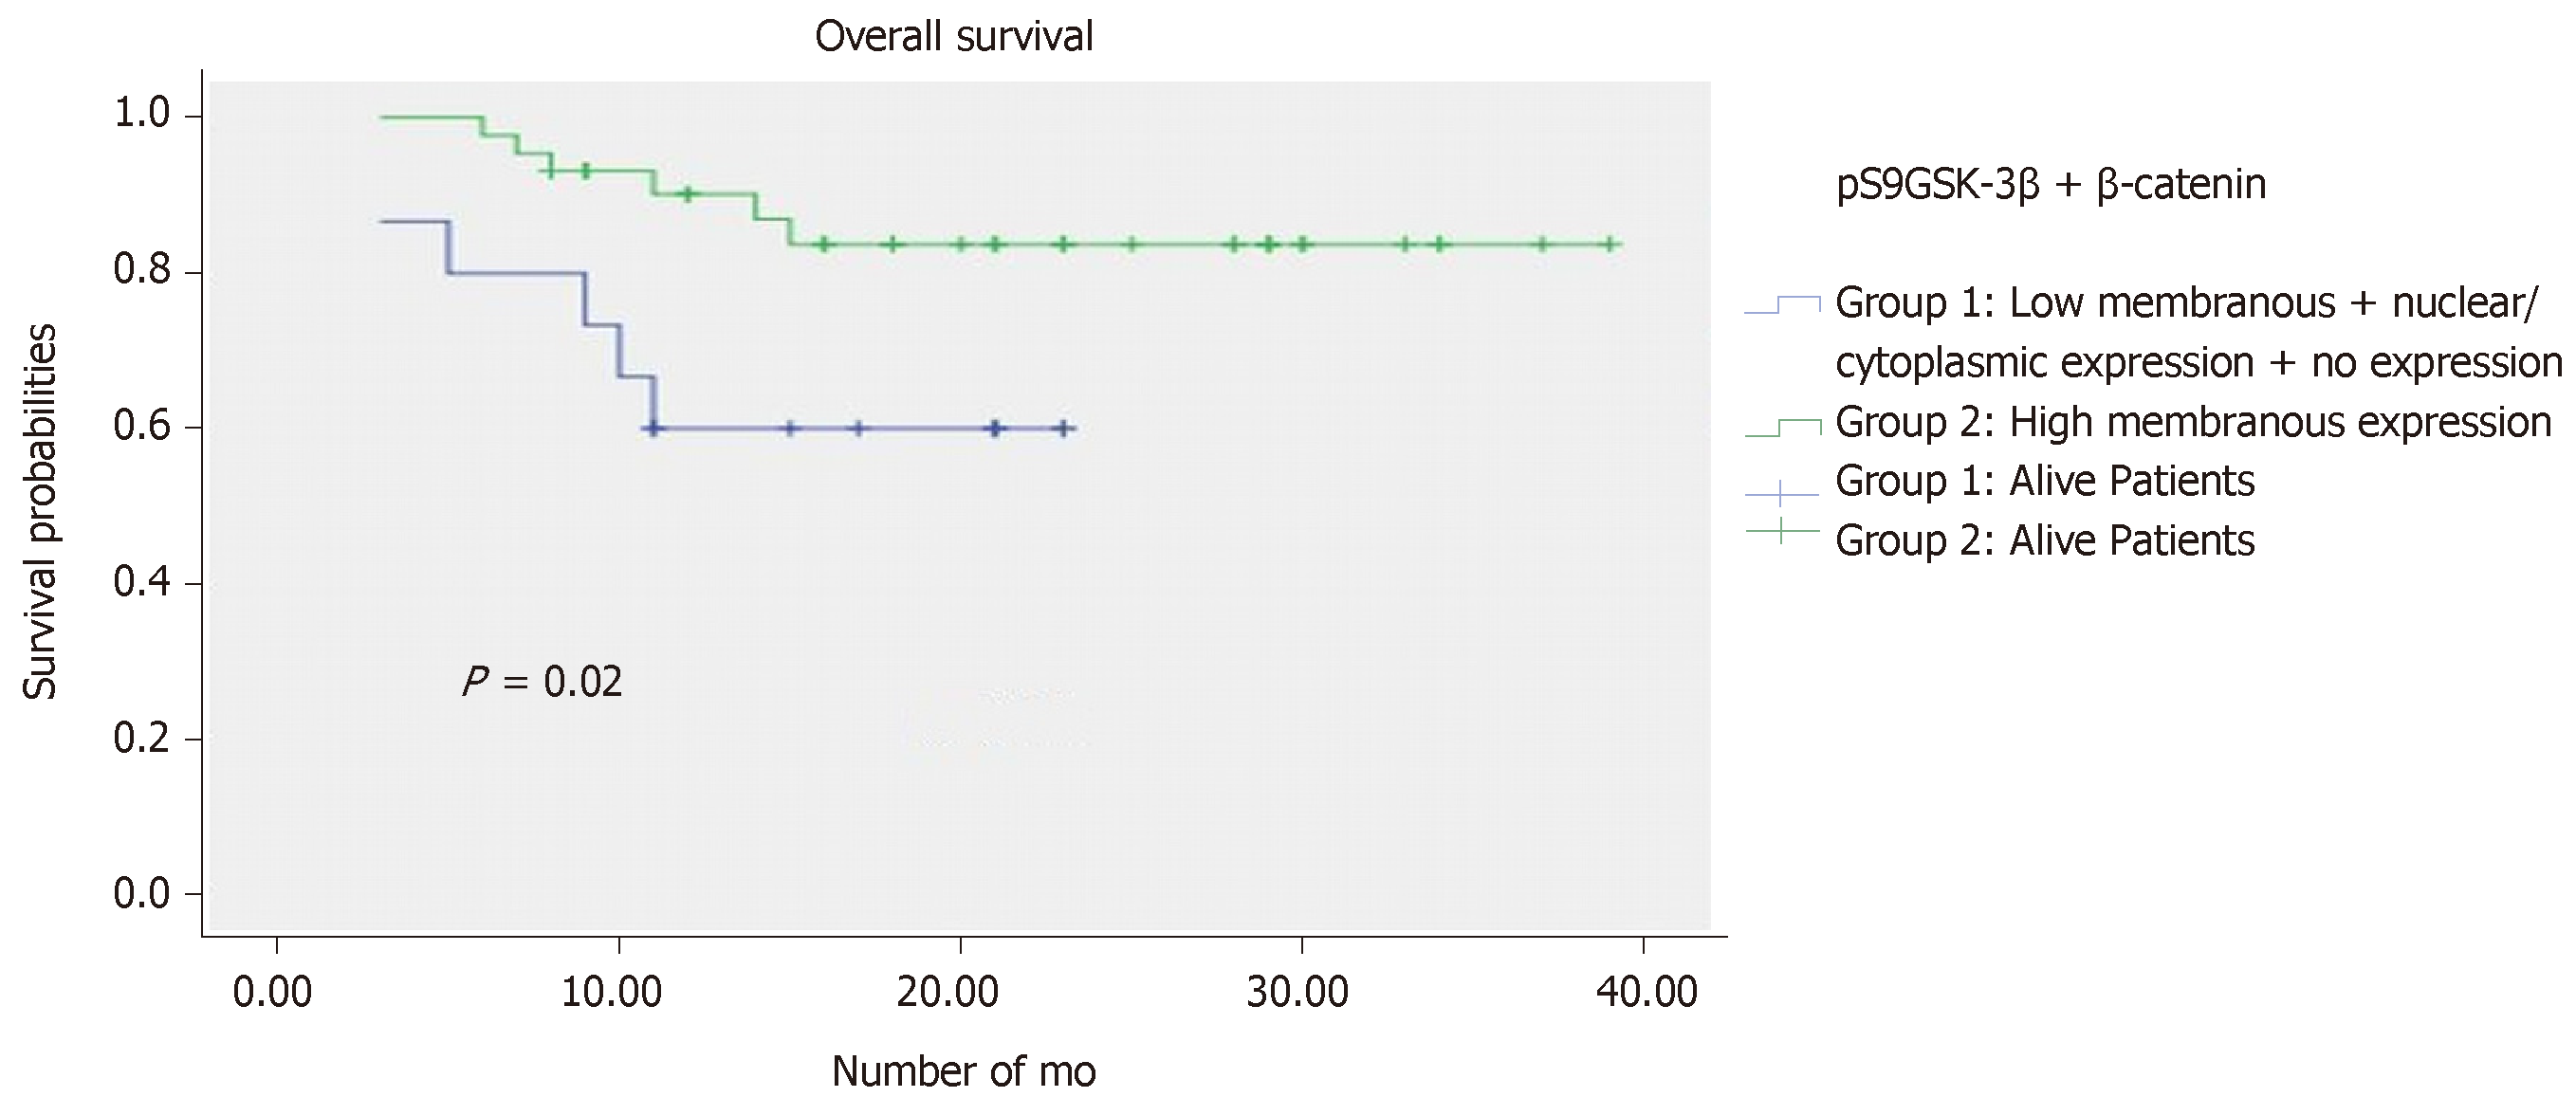
Figure 4 Kaplan-Meier overall survival curve analysis in patients with urothelial carcinoma of bladder.
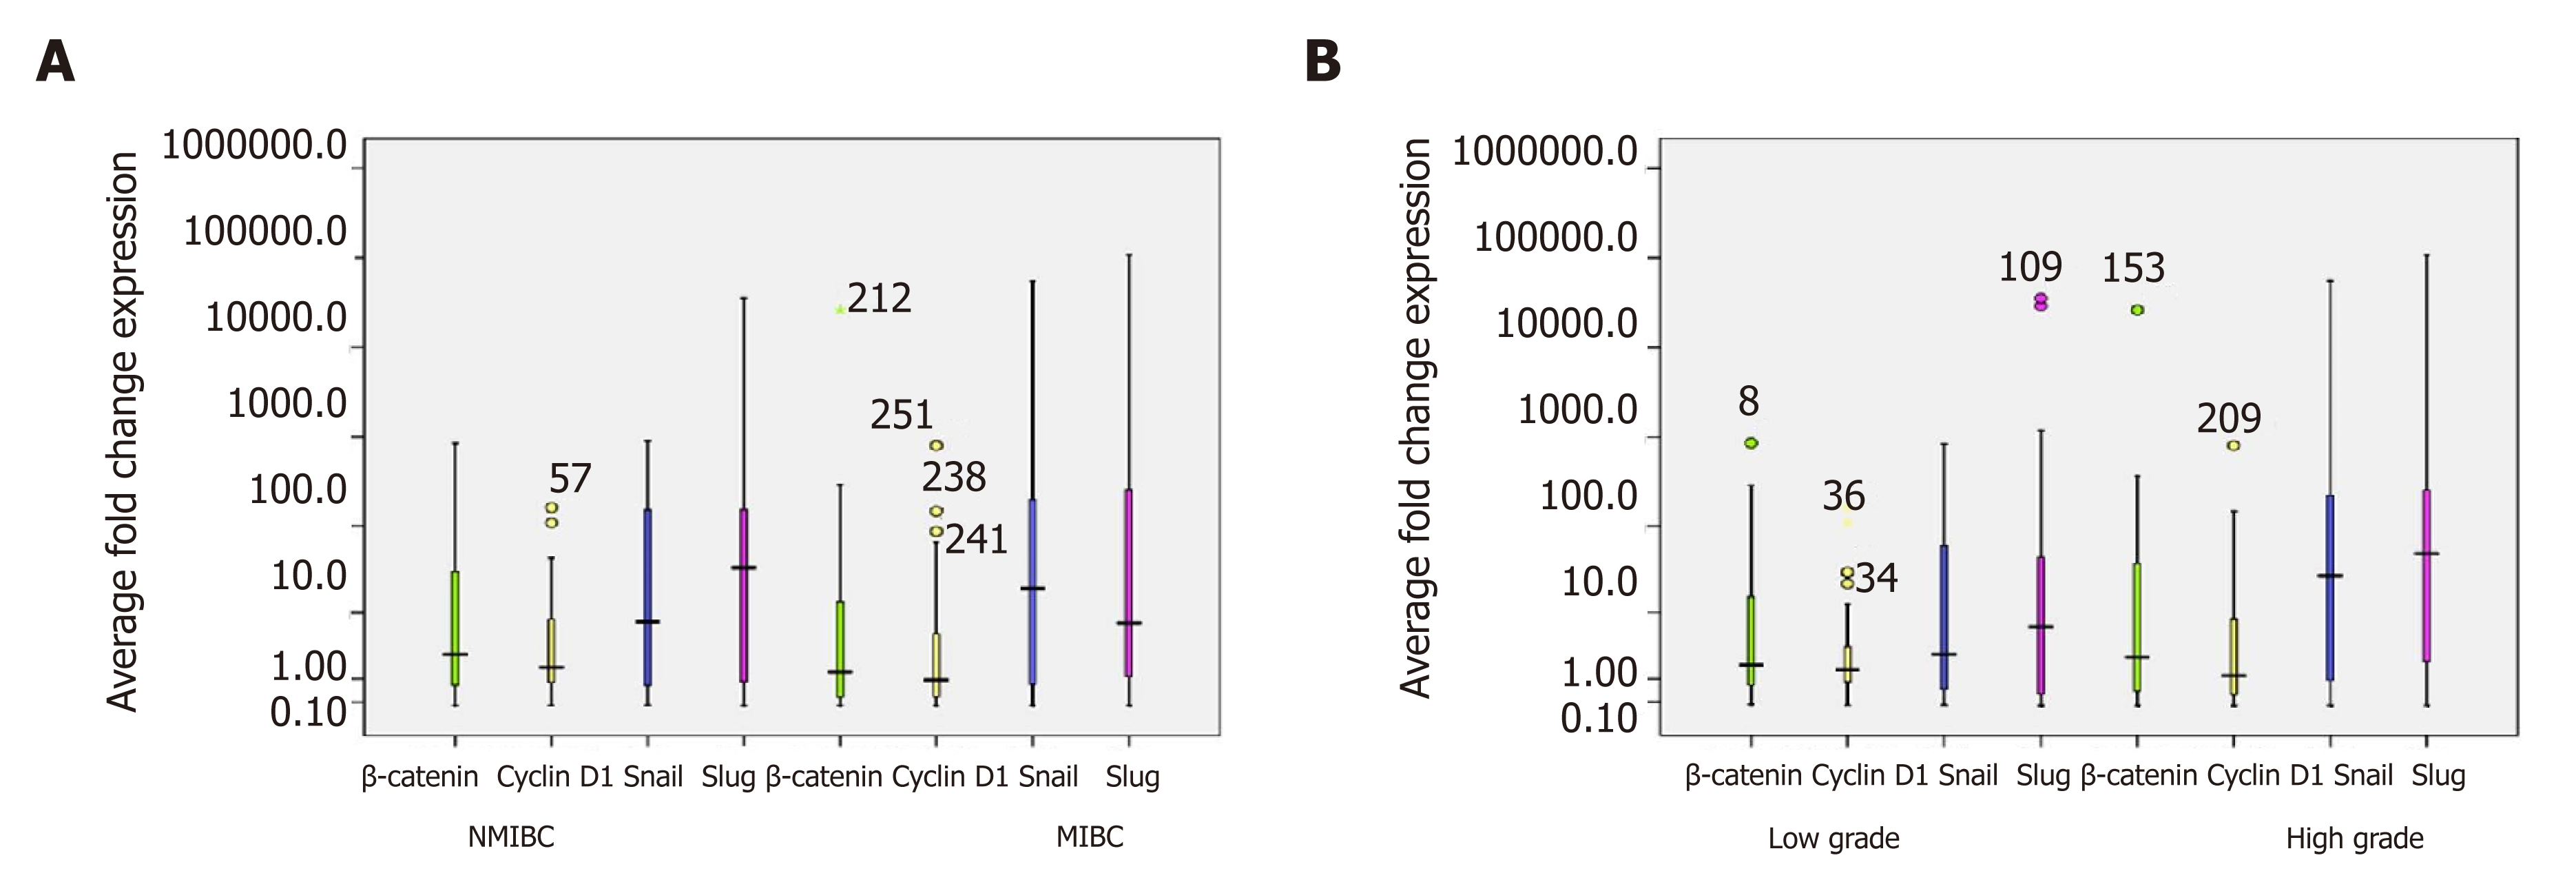
Figure 5 Box plot representation of quantitative expression profile of β-catenin and its target genes (Cyclin D1, Snail and Slug) in a cohort of 90 urinary bladder tumors at transcriptome level in non-muscle invasive bladder cancer and muscle invasive bladder cancer, and low grade and high grade tumors.
Boxes represent the 25th to 75th percentile, horizontal lines indicate median values, and stars represent the maximum value. A: Non-muscle invasive bladder cancer and muscle invasive bladder cancer; B: Low grade and high grade tumors. The Y axis was logarithmically scaled in all cases. MIBC: Muscle invasive bladder cancer; NMIBC: Non-muscle invasive bladder cancer.
- Citation: Maurya N, Singh R, Goel A, Singhai A, Singh UP, Agrawal V, Garg M. Clinicohistopathological implications of phosphoserine 9 glycogen synthase kinase-3β/ β-catenin in urinary bladder cancer patients. World J Clin Oncol 2019; 10(4): 166-182
- URL: https://www.wjgnet.com/2218-4333/full/v10/i4/166.htm
- DOI: https://dx.doi.org/10.5306/wjco.v10.i4.166


