Copyright
©2011 Baishideng Publishing Group Co.
World J Gastrointest Pathophysiol. Dec 15, 2011; 2(6): 146-154
Published online Dec 15, 2011. doi: 10.4291/wjgp.v2.i6.146
Published online Dec 15, 2011. doi: 10.4291/wjgp.v2.i6.146
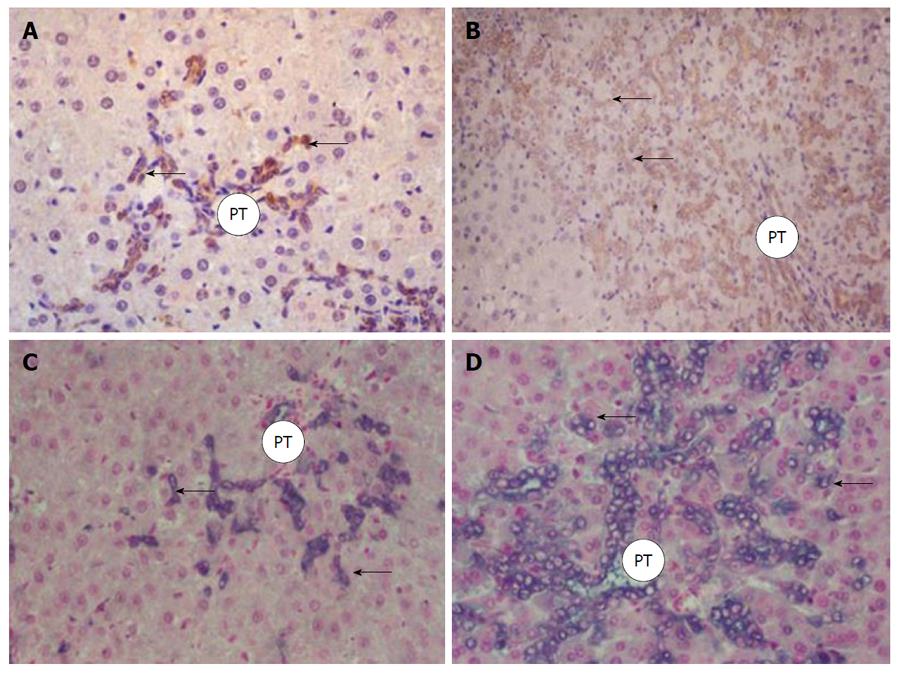
Figure 1 Microphotographs showing expression of CK19 from oval cells (arrows) in livers of group III (A) and group IV (B) and α-fetoprotein mRNA expression from oval cells (arrows) in group III (C) and group IV (D).
In group IV there is higher oval cell presence as demonstrated by both markers [CK19: streptavidin biotin peroxidase (A) × 250, (B) × 100, α-fetoprotein mRNA: in situ hybridization × 250]. PT: Portal tract.
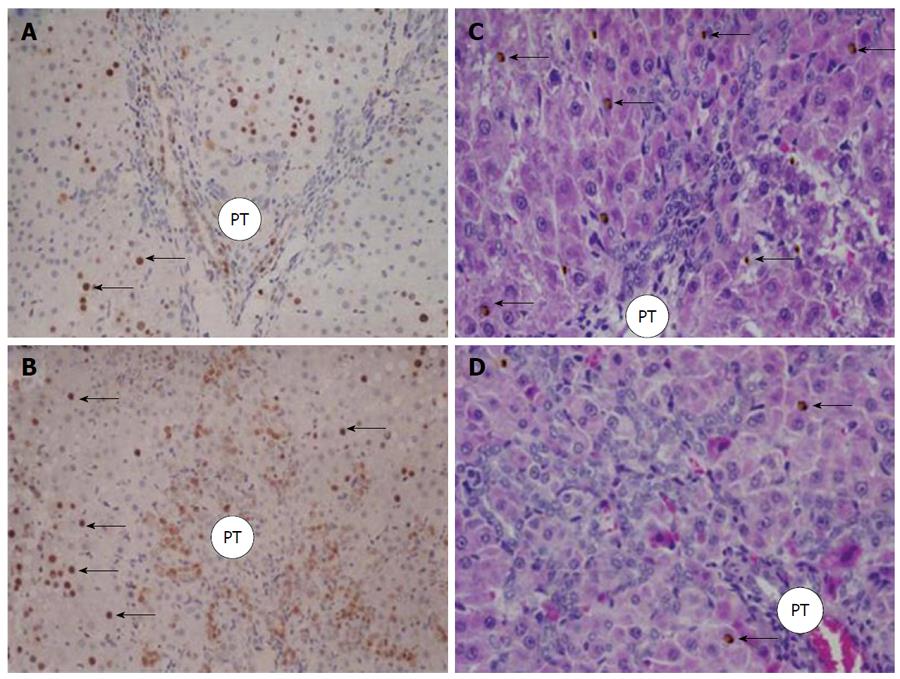
Figure 2 Microphotographs showing Ki67 (+) hepatocytes (arrows) from livers of group III (A) and group IV (B) and TUNEL (+) hepatocytes (arrows) in group III (C) and group IV (D).
In group IV there are more Ki67 (+) hepatocytes (streptavidin biotin peroxidase × 100) and less TUNEL (+) hepatocytes (streptavidin biotin peroxidase and hematoxylin eosin × 250). PT: Portal tract.
- Citation: Assimakopoulos SF, Tsamandas AC, Alexandris IH, Georgiou C, Vagianos CE, Scopa CD. Stimulation of oval cell and hepatocyte proliferation by exogenous bombesin and neurotensin in partially hepatectomized rats. World J Gastrointest Pathophysiol 2011; 2(6): 146-154
- URL: https://www.wjgnet.com/2150-5330/full/v2/i6/146.htm
- DOI: https://dx.doi.org/10.4291/wjgp.v2.i6.146


