Copyright
©The Author(s) 2024.
World J Cardiol. Feb 26, 2024; 16(2): 80-91
Published online Feb 26, 2024. doi: 10.4330/wjc.v16.i2.80
Published online Feb 26, 2024. doi: 10.4330/wjc.v16.i2.80
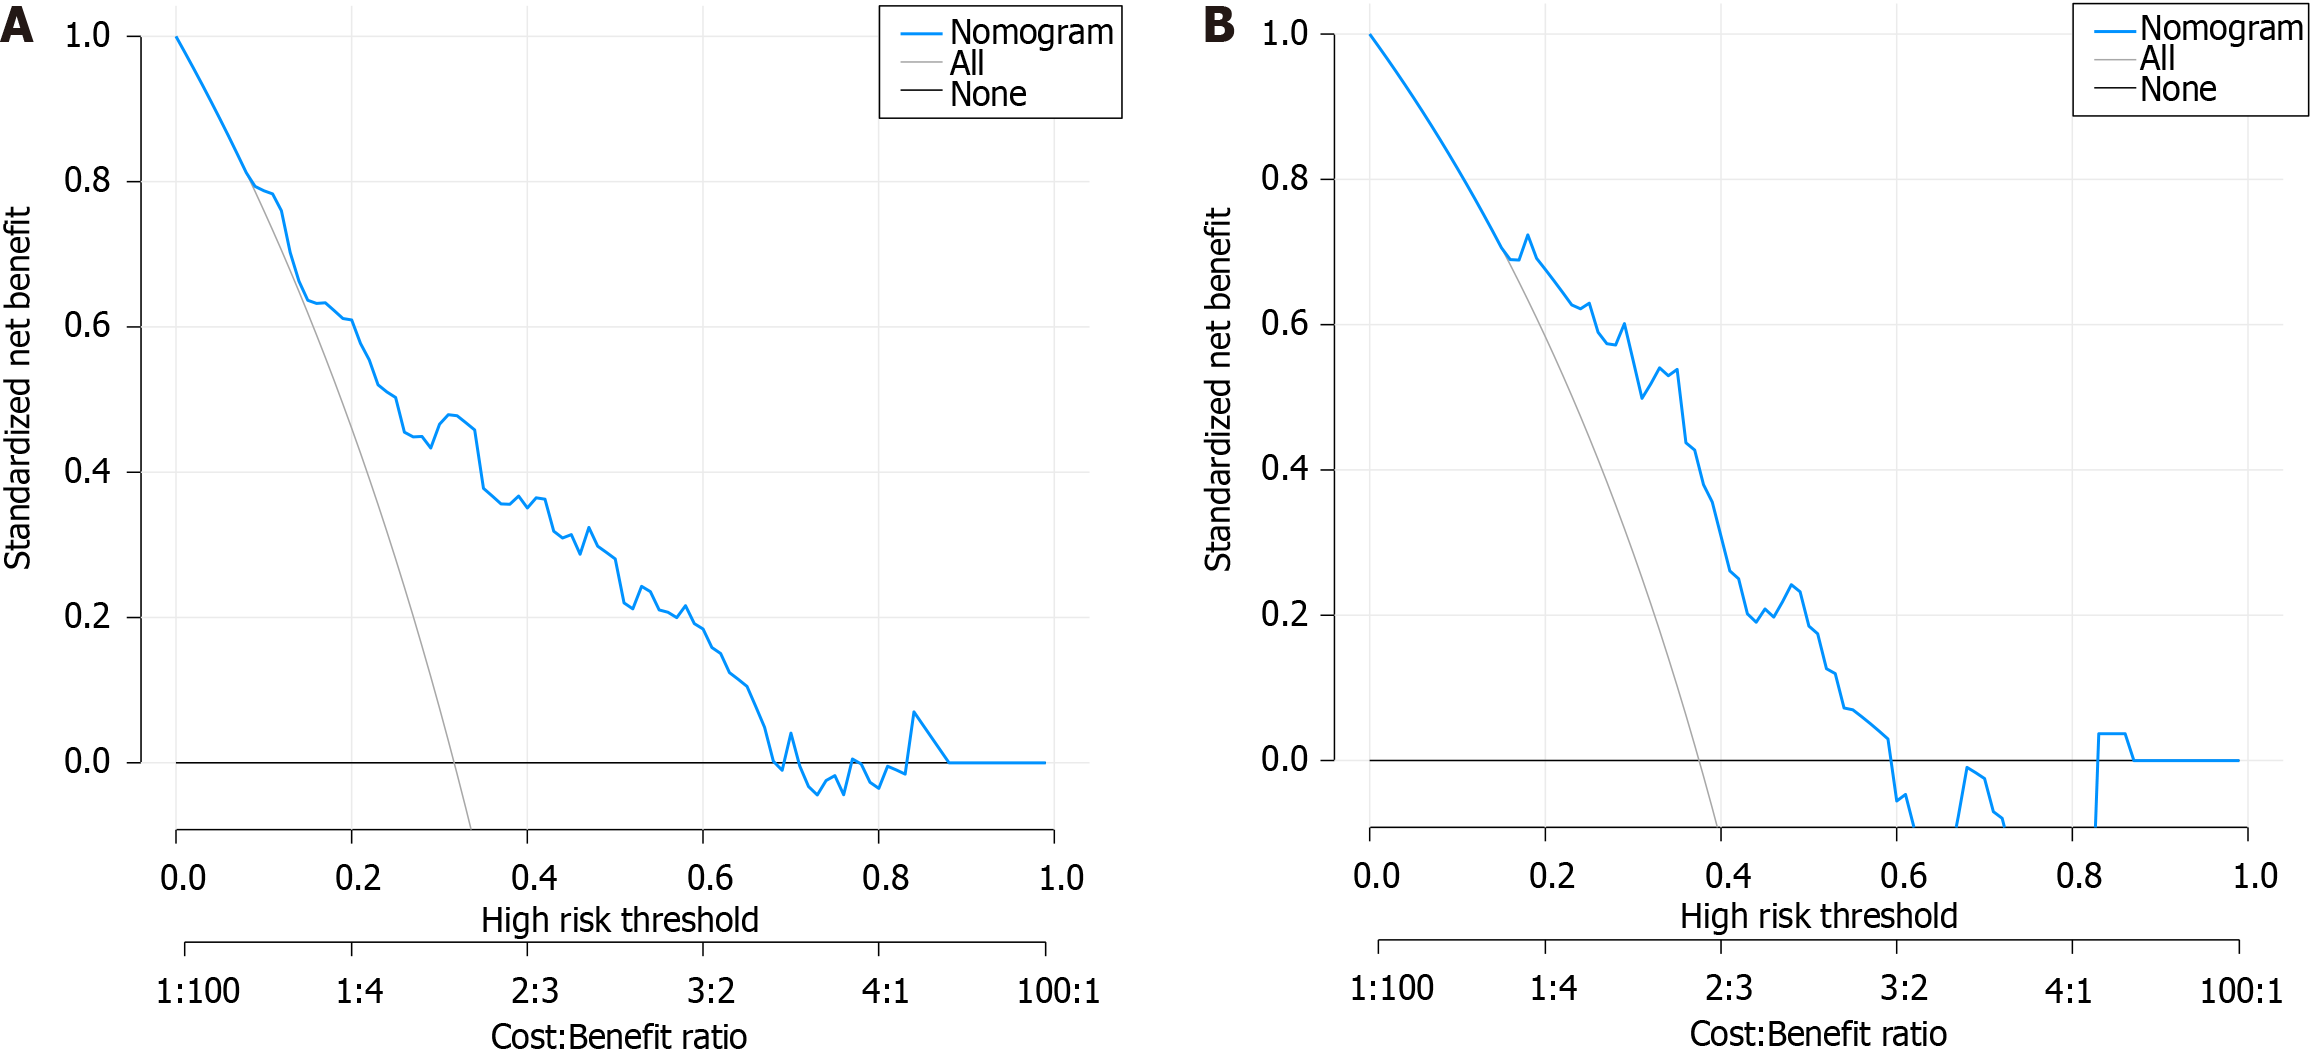
Figure 4 Decision curve analysis curve of the nomogram model.
A and B: The figure presents the decision curve analysis (DCA) curve of the developed nomogram model in both the development group (A) and the validation group (B). The DCA curve measures the net benefit of the model by plotting the threshold probability on the x-axis against the net benefit on the y-axis. The net benefit is calculated by weighting the true-positive and false-positive classifications based on the clinical consequence of each classification. The DCA curve assesses the clinical usefulness of the nomogram model by comparing it to the strategies of treating all or no patients with the condition of interest. A higher net benefit value indicates a better clinical utility of the model.
- Citation: Cao JY, Zhang LX, Zhou XJ. Development and validation of a nomogram model for predicting the risk of pre-hospital delay in patients with acute myocardial infarction. World J Cardiol 2024; 16(2): 80-91
- URL: https://www.wjgnet.com/1949-8462/full/v16/i2/80.htm
- DOI: https://dx.doi.org/10.4330/wjc.v16.i2.80


