Copyright
©The Author(s) 2017.
World J Cardiol. Feb 26, 2017; 9(2): 109-133
Published online Feb 26, 2017. doi: 10.4330/wjc.v9.i2.109
Published online Feb 26, 2017. doi: 10.4330/wjc.v9.i2.109
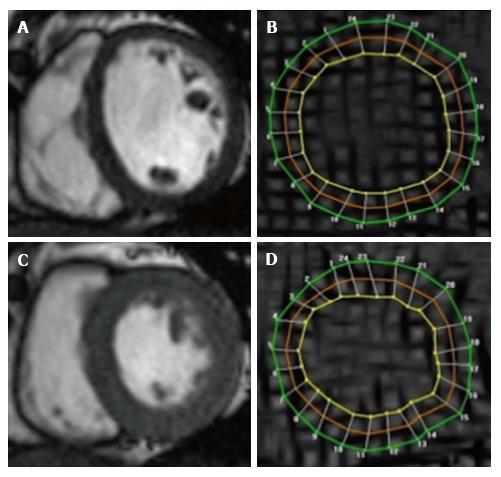
Figure 2 Cardiovascular magnetic resonance assessment of strain using tissue tagging.
Cine SSFP images in end-diastole (A) and end-systole (C), with corresponding Spatial Modulation of Motion (SPAMM) tagged images (B and D). Grid lines (tags) are visible and contours drawn at 3 myocardial levels [green (epicardial), red (mid myocardial), yellow (endocardial)] allow tracking of myocardial motion and strain (circumferential), here using Harmonic Phase Analysis.
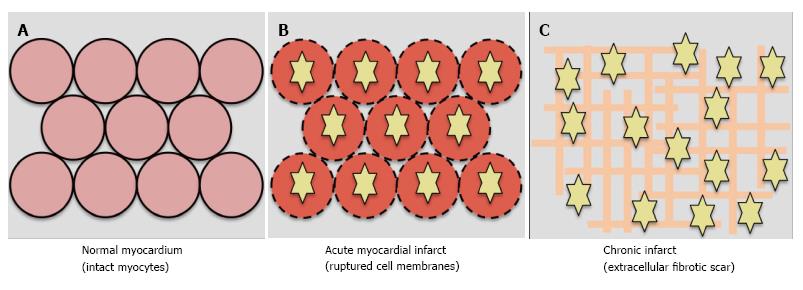
Figure 3 Mechanism of late gadolinium enhancement.
Gadolinium is extracellular. A: In normal myocardium, gadolinium washes out approximately 10 min post administration and there is no late gadolinium enhancement (LGE); B: In acute infarct, gadolinium (yellow stars) enters ruptured cell membranes and causes LGE; C: In chronic infarct, LGE results from increased extracellular space due to fibrotic scar deposition.
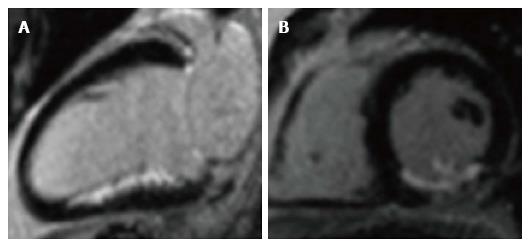
Figure 4 Late gadolinium enhancement of acute infarct.
Infarct appears white (enhanced) in the inferior wall, with unaffected myocardium black (nulled). A: 2-chamber long-axis view; B: Short-axis view, mid ventricular level. The posteromedial papillary muscle is also infarcted in the short-axis view.
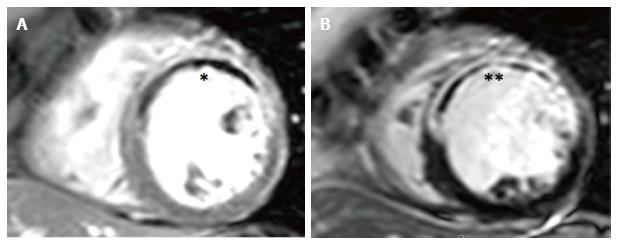
Figure 5 Early and late microvascular obstruction on cardiovascular magnetic resonance.
A: Early gadolinium imaging at 1-min post contrast with hypoperfusion in anteroseptal, anterior and anterolateral segments, consistent with early MVO (E-MVO, *); B: Corresponding late gadolinium image showing transmural infarction with a hypointense late MVO core (L-MVO, **) co-localising with E-MVO. MVO: Microvascular obstruction.
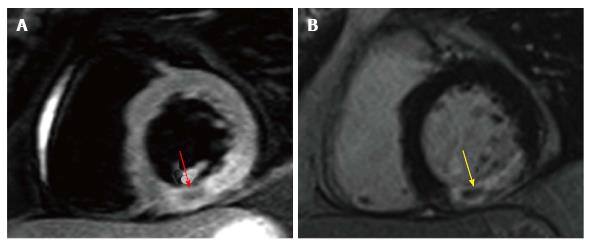
Figure 6 Intramyocardial haemorrhage on cardiovascular magnetic resonance.
A: T2-weighted spin-echo image with hypointensity corresponding with IMH within the hyperintense oedematous region in the inferior wall (red arrow); B: Corresponding LGE image showing co-localisation of IMH and L-MVO (yellow arrow). IMH: Intramyocardial haemorrhage; LGE: Late gadolinium enhancement; MVO: Microvascular obstruction.
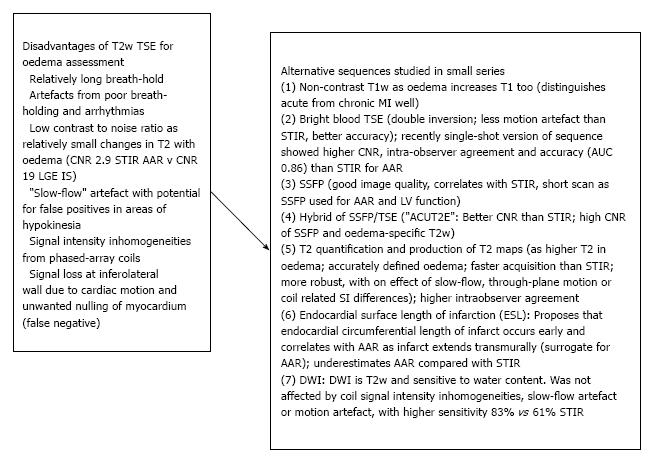
Figure 7 Alternative sequences to dark-blood T2-weighted turbo spin-echo for visualising oedema.
Left: Inherent disadvantages of T2w-TSE[134,144-147]; Right: Sequences compared with T2w-TSE: (1)[145], (2)[141,142,144,148], (3)[149,150], (4)[144], (5)[151,152], (6)[153,154], (7)[155]. T2w-TSE: T2-weighted turbo spin-echo; DWI: Diffusion-weighted imaging; AAR: Area at risk.
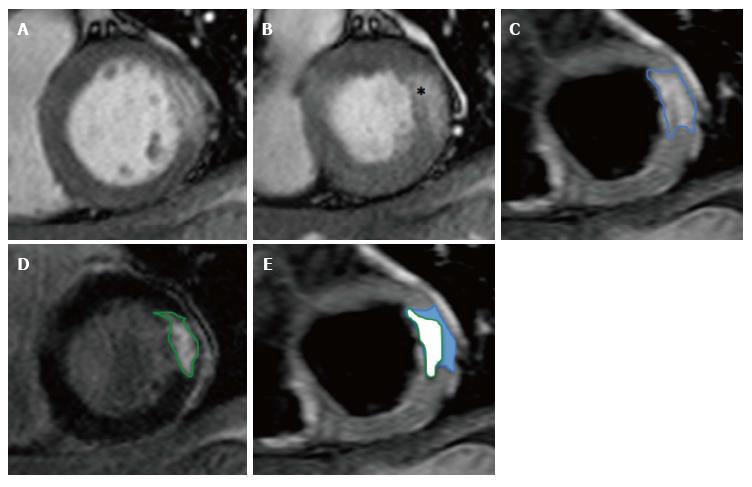
Figure 8 Calculation of salvaged myocardium.
A: SSFP end-diastolic cine image; B: SSFP end-systolic cine image showing hypokinetic basal anterolateral segment (*); C: T2w-STIR image showing oedema (AAR) in anterolateral wall consistent with circumflex artery occlusion; D: Corresponding LGE image with near-transmural infarction; E: Calculation of salvaged myocardium in blue. SSFP: Steady-state free precession; T2w-STIR: T2-weighted short-tau inversion-recovery sequence; LGE: Late gadolinium enhancement.
- Citation: Khan JN, McCann GP. Cardiovascular magnetic resonance imaging assessment of outcomes in acute myocardial infarction. World J Cardiol 2017; 9(2): 109-133
- URL: https://www.wjgnet.com/1949-8462/full/v9/i2/109.htm
- DOI: https://dx.doi.org/10.4330/wjc.v9.i2.109


