Copyright
©2010 Baishideng Publishing Group Co.
World J Cardiol. Sep 26, 2010; 2(9): 299-304
Published online Sep 26, 2010. doi: 10.4330/wjc.v2.i9.299
Published online Sep 26, 2010. doi: 10.4330/wjc.v2.i9.299
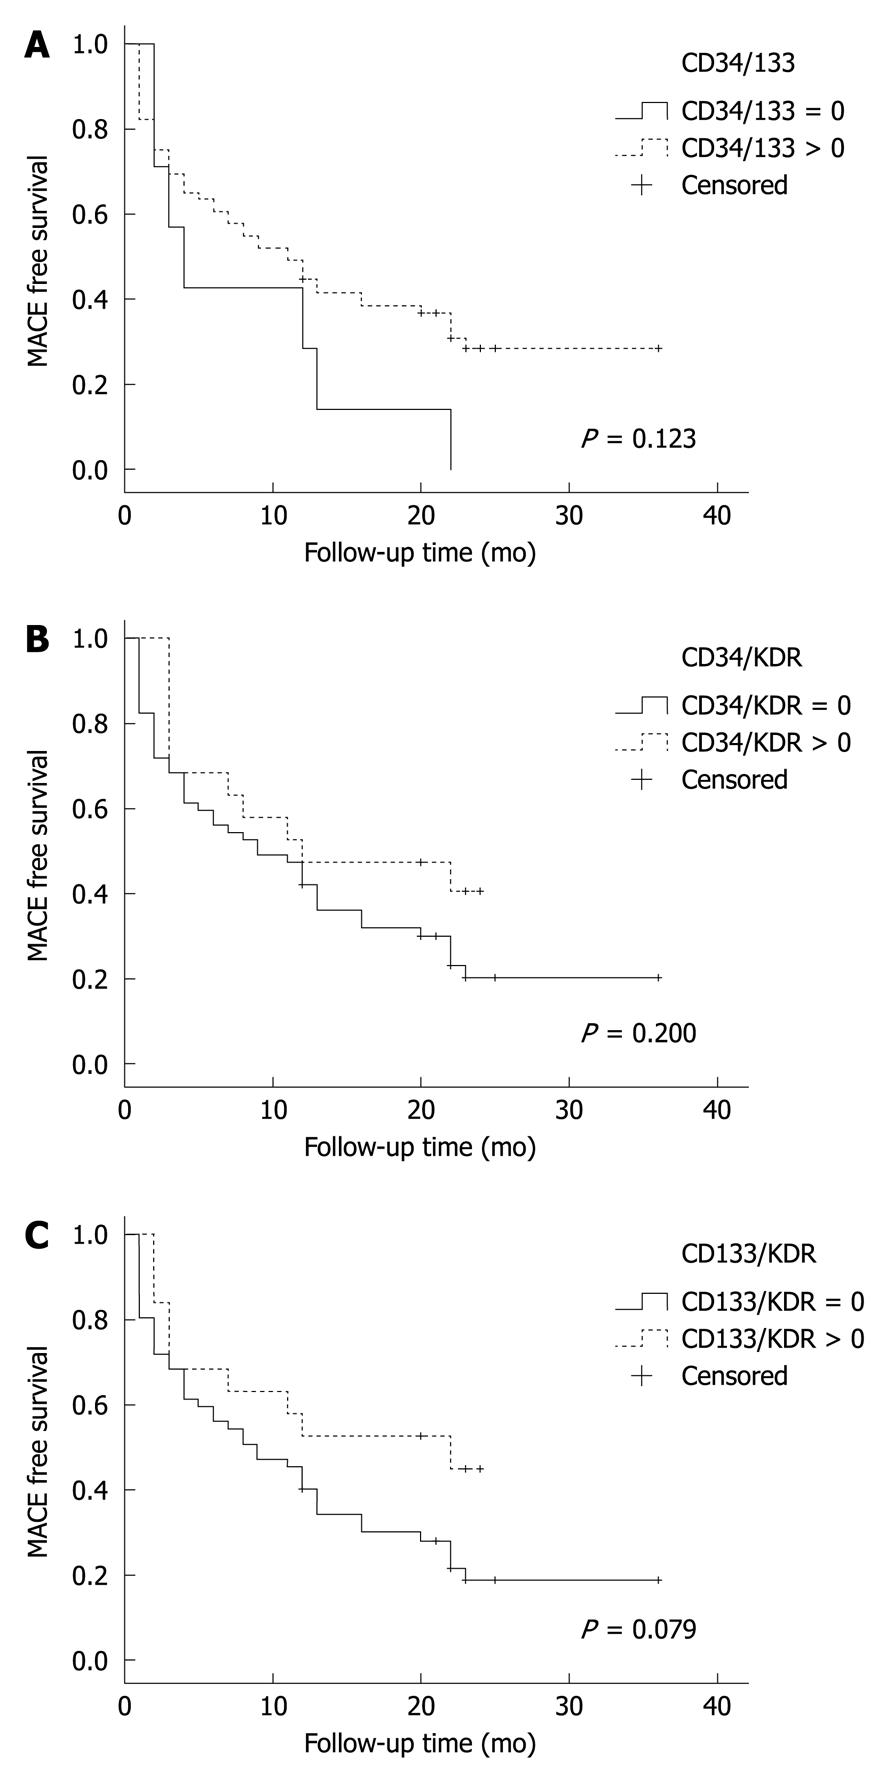
Figure 1 Kaplan-Meier survival chart for the outcome of total major adverse cardiac event stratified by positive (dashed line) and negative (solid line) fluorescence-activated cell sorting analysis.
A: CD34+CD133+ cells; B: CD34+KDR+; C: CD133+KDR+. MACE: Major adverse cardiac event.
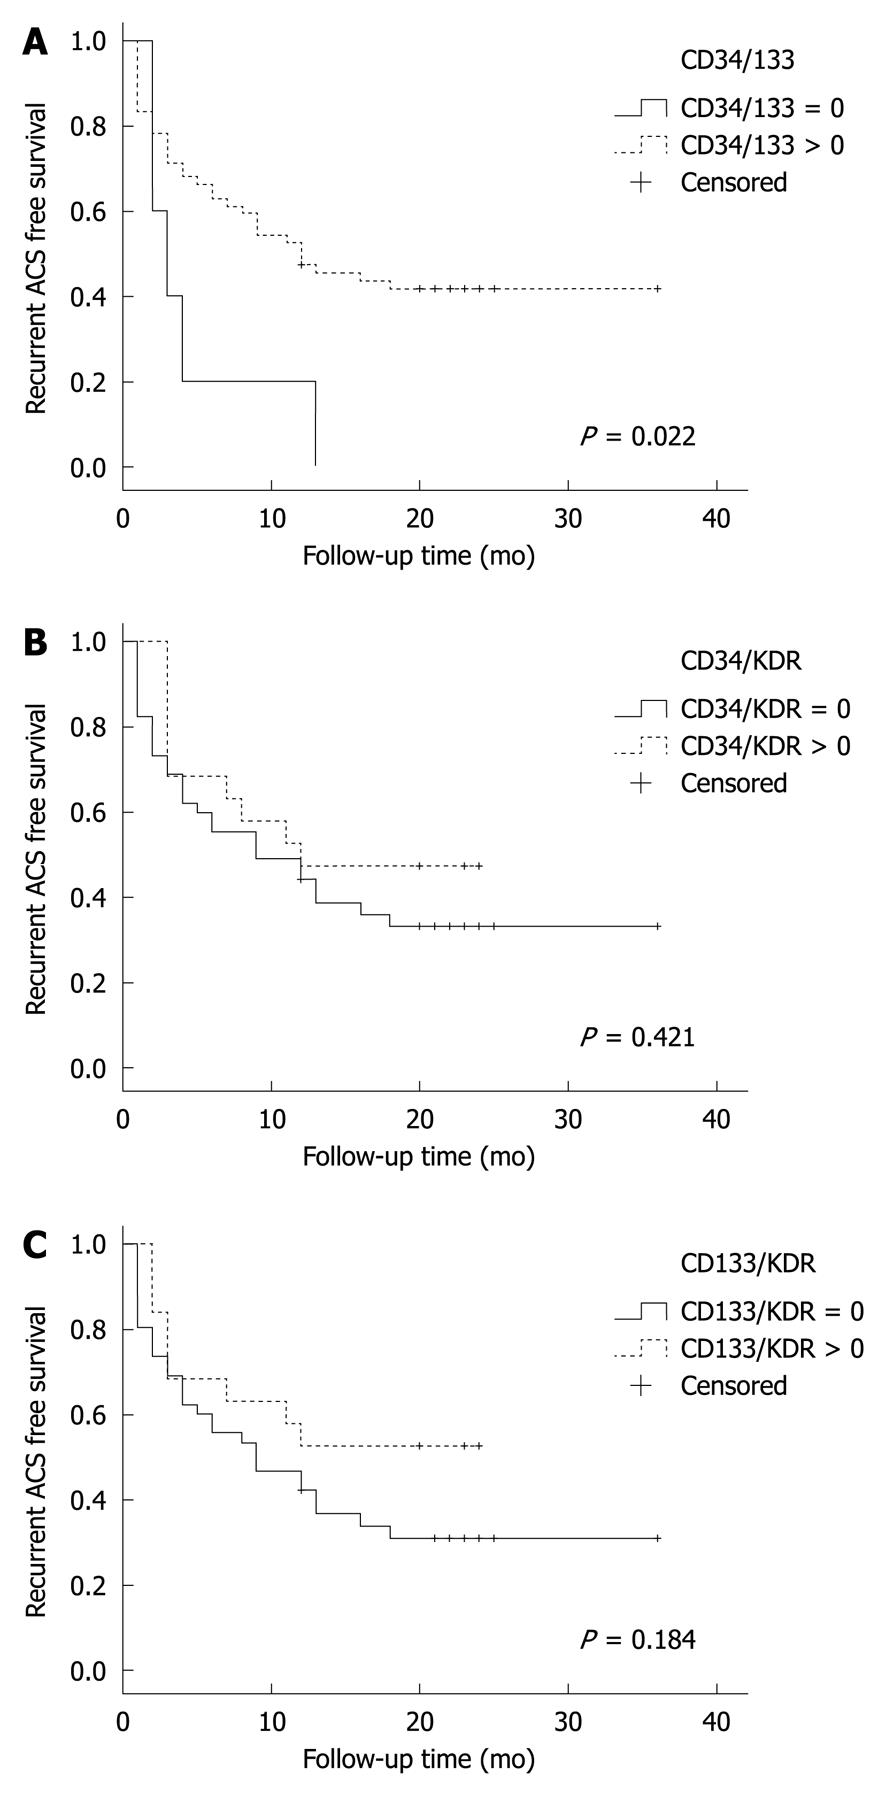
Figure 2 Kaplan-Meier event free survival for the secondary endpoint of acute coronary syndrome (recurrent myocardial infarction or unstable angina) stratified by patients with positive fluorescence-activated cell sorting analysis (dashed line) vs patients with negative fluorescence-activated cell sorting analysis (solid line).
A: CD34+CD133+ cells; B: CD34+KDR+; C: CD133+KDR+. ACS: Acute coronary syndrome.
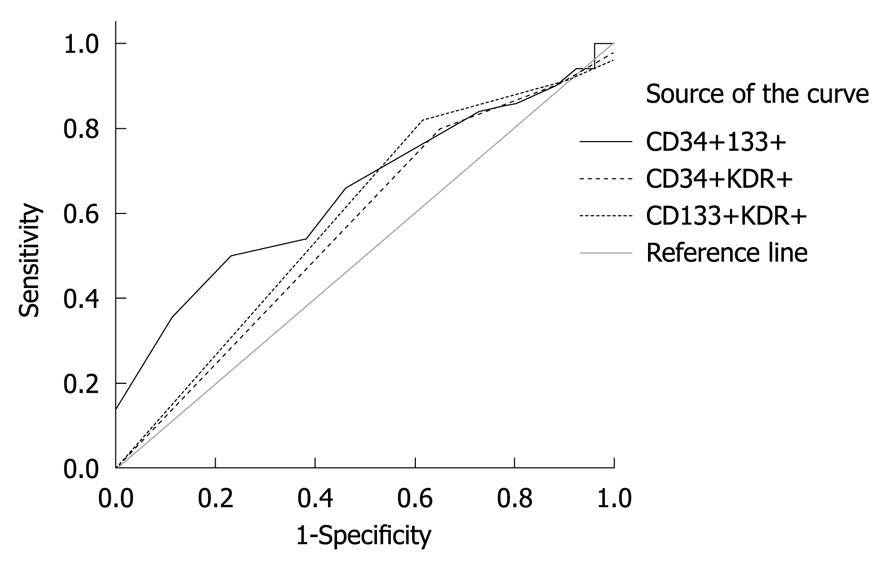
Figure 3 Receiver operating characteristics curve analysis for the endpoint of acute coronary syndrome (recurrent myocardial infarction or unstable angina) as a function of the various endothelial progenitor cell populations.
Only CD34+133+ correlated significantly with this outcome (P = 0.034); the P-value for CD34+KDR+ was 0.35 and for CD133+KDR+ was 0.19).
- Citation: Schwartzenberg S, Afek A, Charach G, Rubinstein A, Ben-Shoshan Y, Kissil S, Maisel-Auslender S, Keren G, George J. Comparative analysis of the predictive power of different endothelial progenitor cell phenotypes on cardiovascular outcome. World J Cardiol 2010; 2(9): 299-304
- URL: https://www.wjgnet.com/1949-8462/full/v2/i9/299.htm
- DOI: https://dx.doi.org/10.4330/wjc.v2.i9.299


