
















Copyright: ©Author(s) 2026.
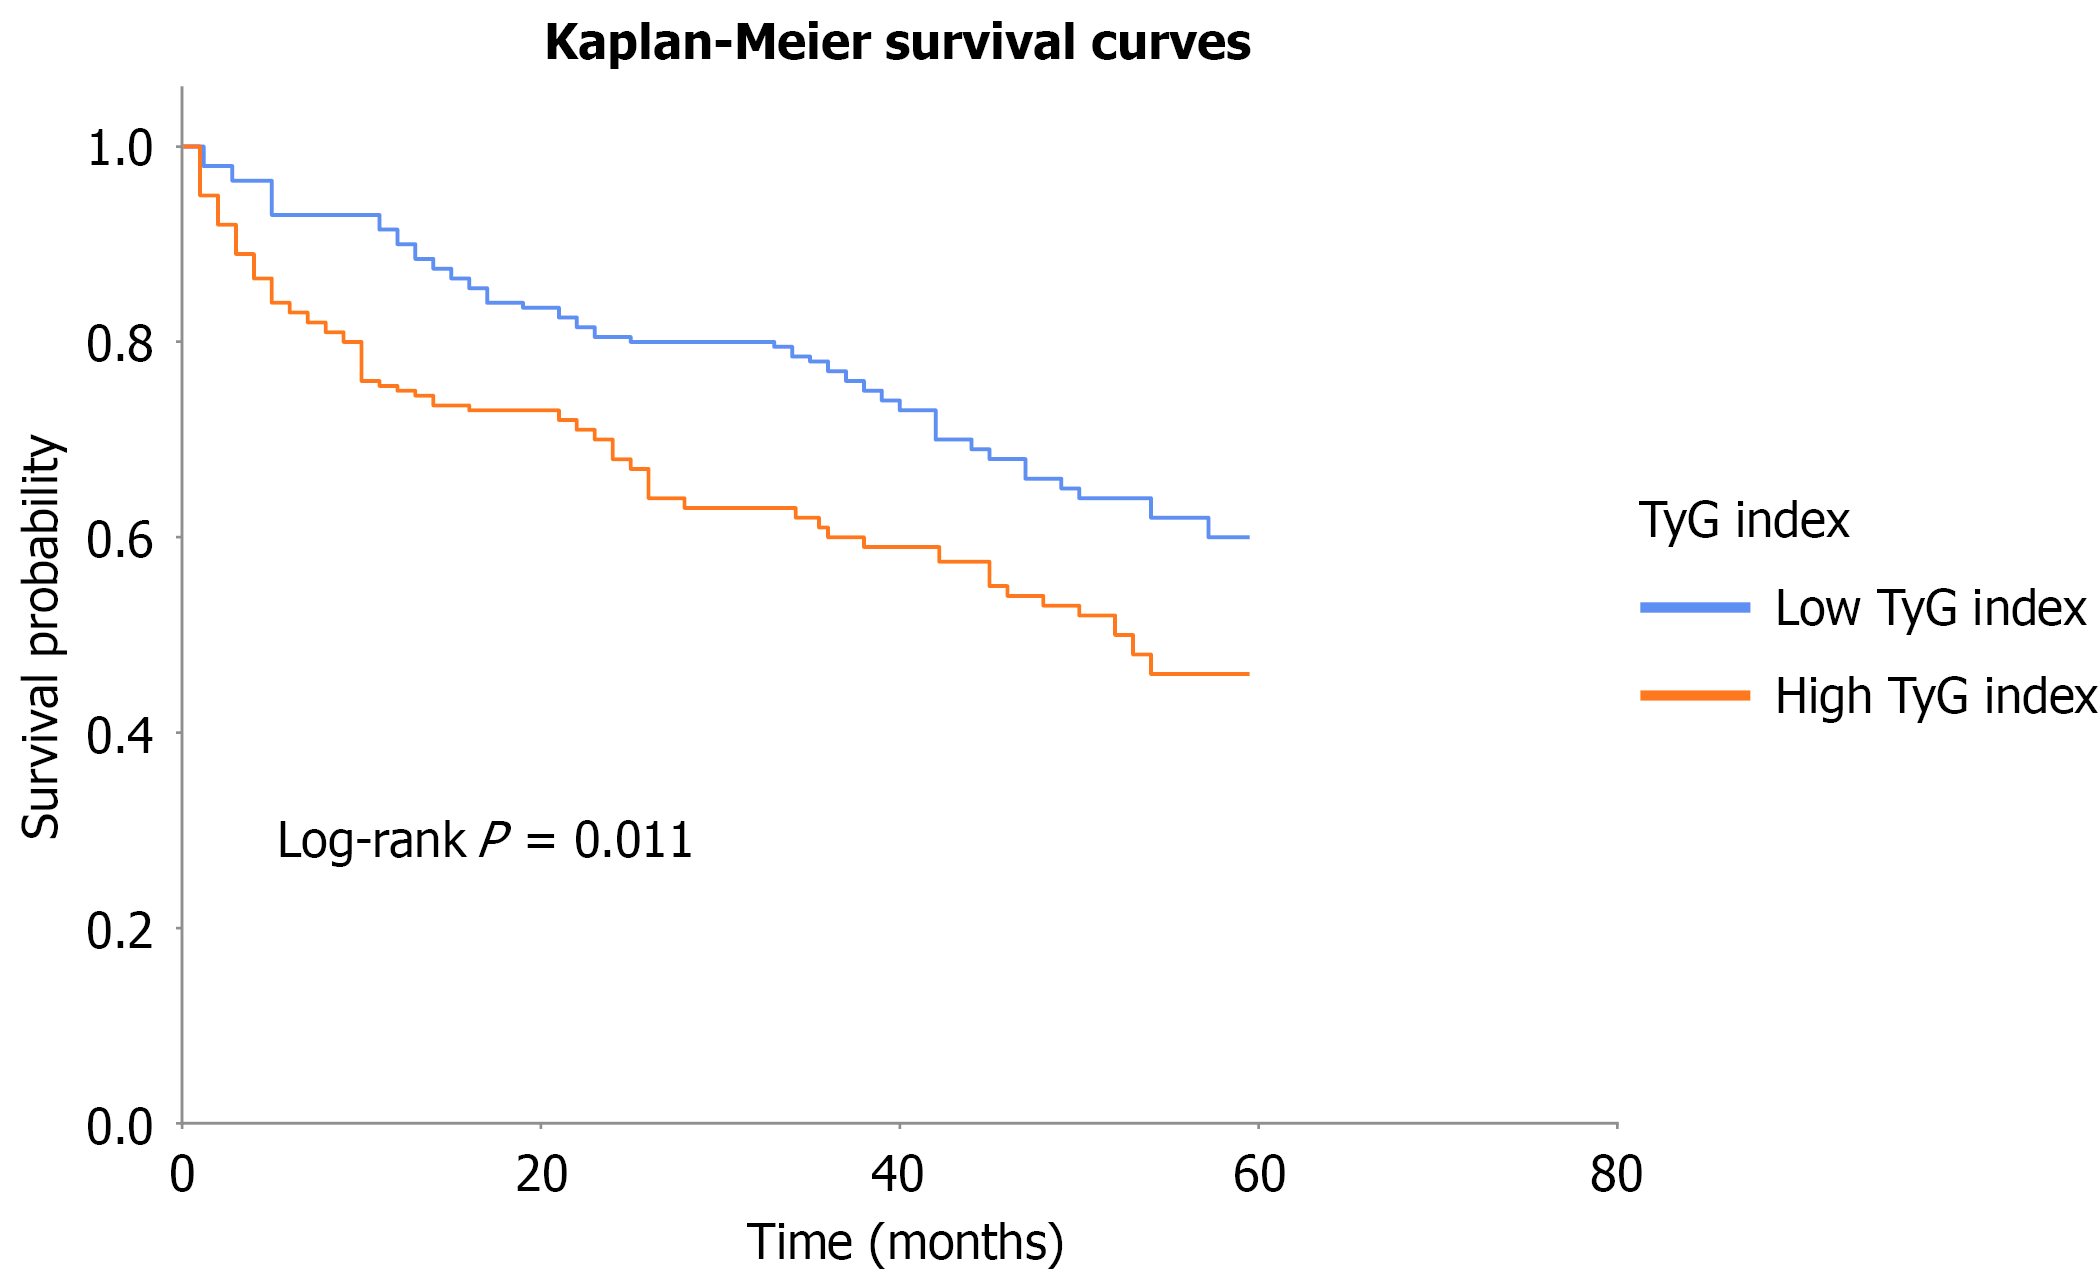
Figure 1 Kaplan-Meier survival curves for patients with low vs high triglyceride-glucose index.
The high-triglyceride-glucose group showed significantly worse survival (Log-rank P = 0.011). TyG: Triglyceride-glucose.
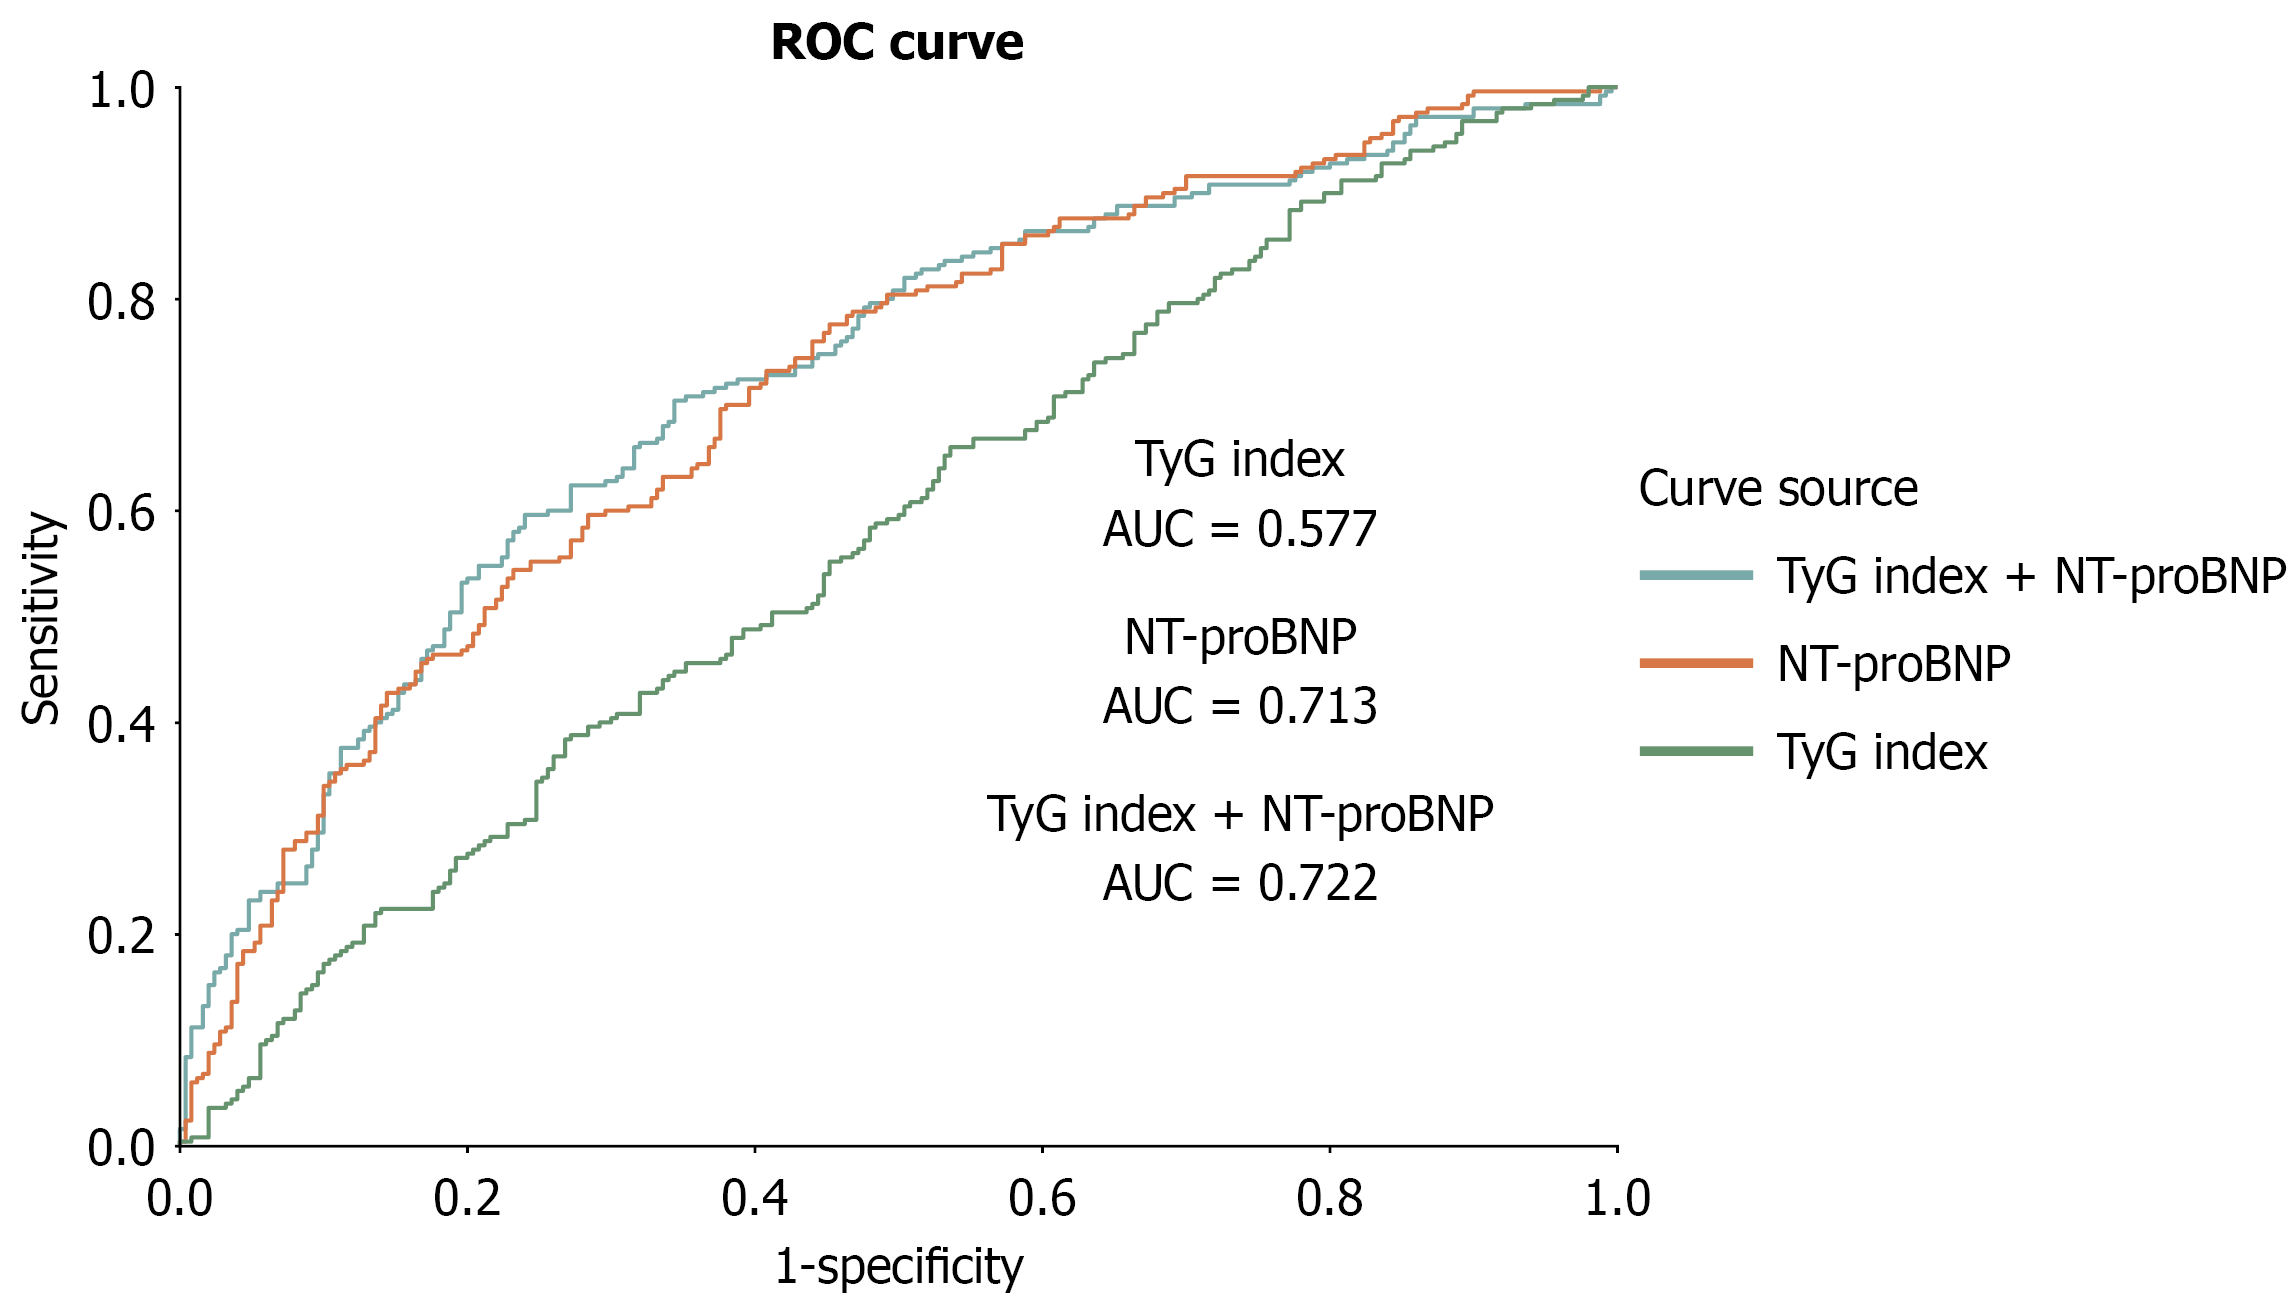
Figure 2 Receiver operating characteristic curves for the triglyceride-glucose index, N-terminal pro-brain natriuretic peptide, and their combination in predicting 5-year all-cause mortality.
The combination of triglyceride-glucose index and N-terminal pro-brain natriuretic peptide (NT-proBNP) achieved the highest area under the curve (0.722), but the improvement compared with NT-proBNP alone was not statistically significant by the DeLong test (P = 0.318). TyG: Triglyceride-glucose; NT-proBNP: N-terminal pro-brain natriuretic peptide; AUC: Area under the curve; ROC: Receiver operating characteristic.
- Citation: Li XF, Wang X, Zhang Y, Liu J, Liu JM, Chen ML, Zhao L, Shi LY. Triglyceride-glucose index and all-cause mortality in patients with chronic severe heart failure. World J Cardiol 2026; 18(9): 123414
- URL: https://www.wjgnet.com/1949-8462/full/v18/i9/123414.htm
- DOI: https://dx.doi.org/10.4330/wjc.123414