Copyright
©The Author(s) 2021.
World J Cardiol. Apr 26, 2021; 13(4): 95-102
Published online Apr 26, 2021. doi: 10.4330/wjc.v13.i4.95
Published online Apr 26, 2021. doi: 10.4330/wjc.v13.i4.95
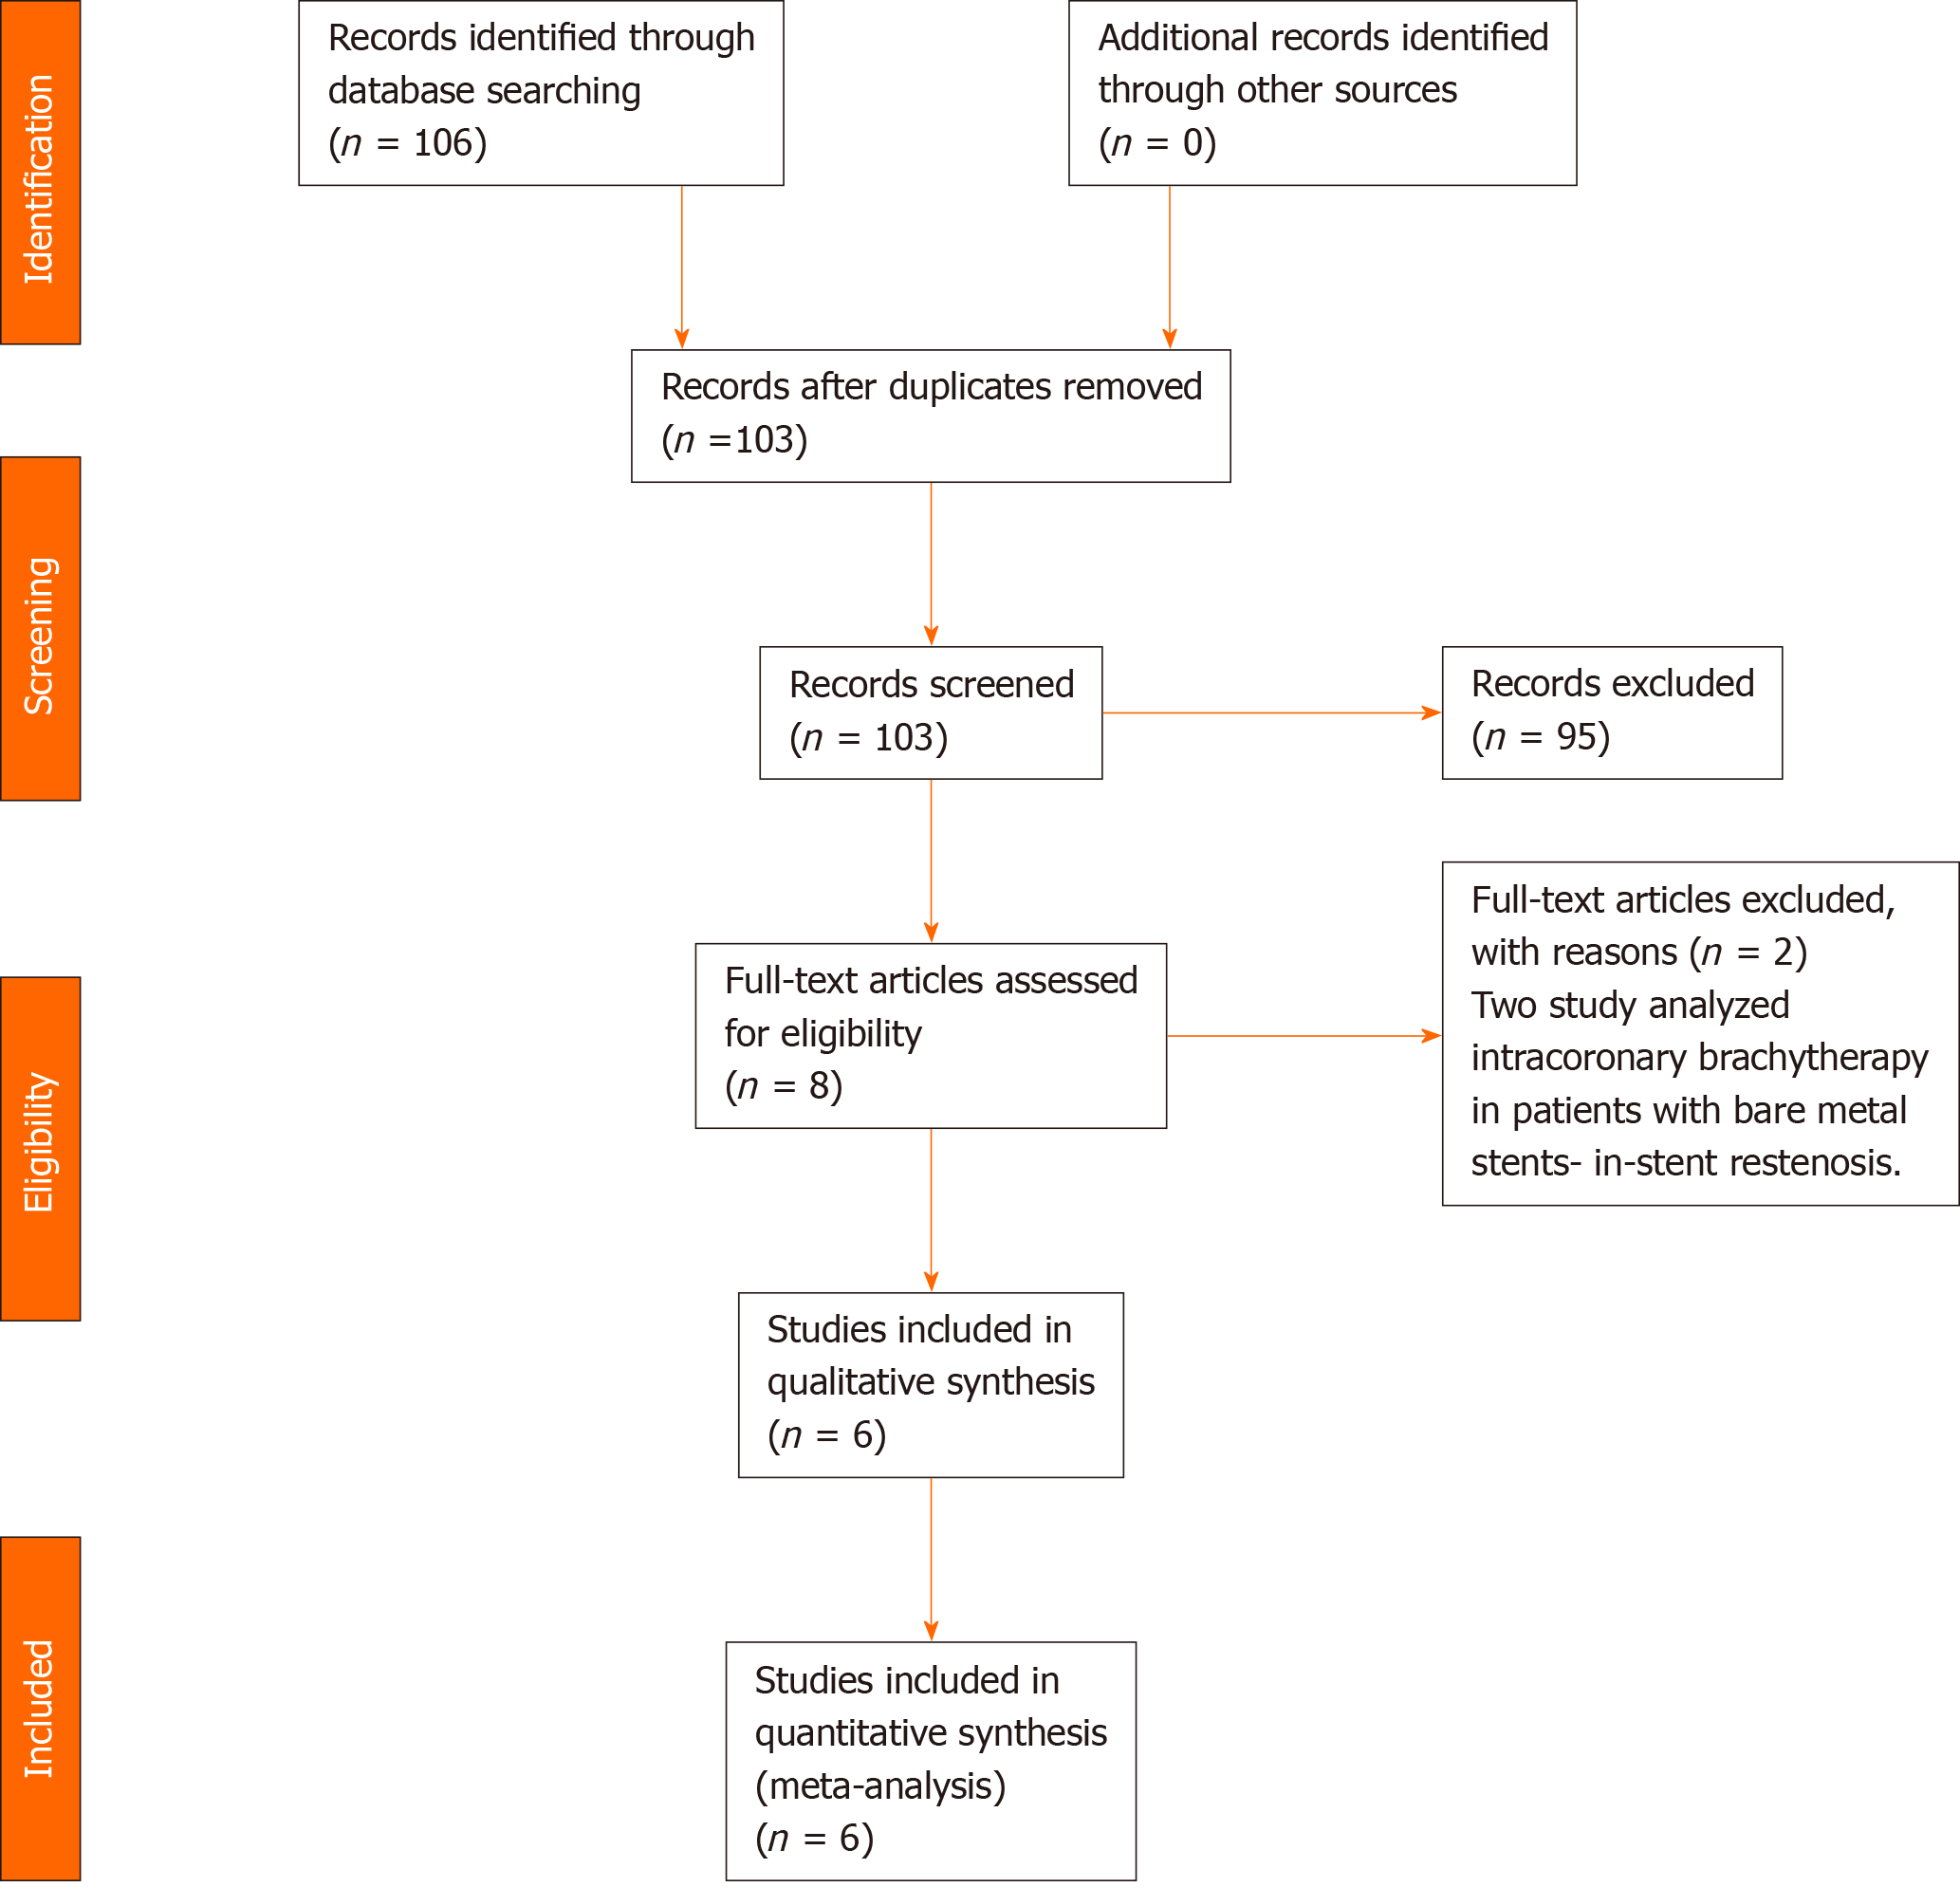
Figure 1 PRISMA flow chart for the selection of studies included in the meta-analysis.
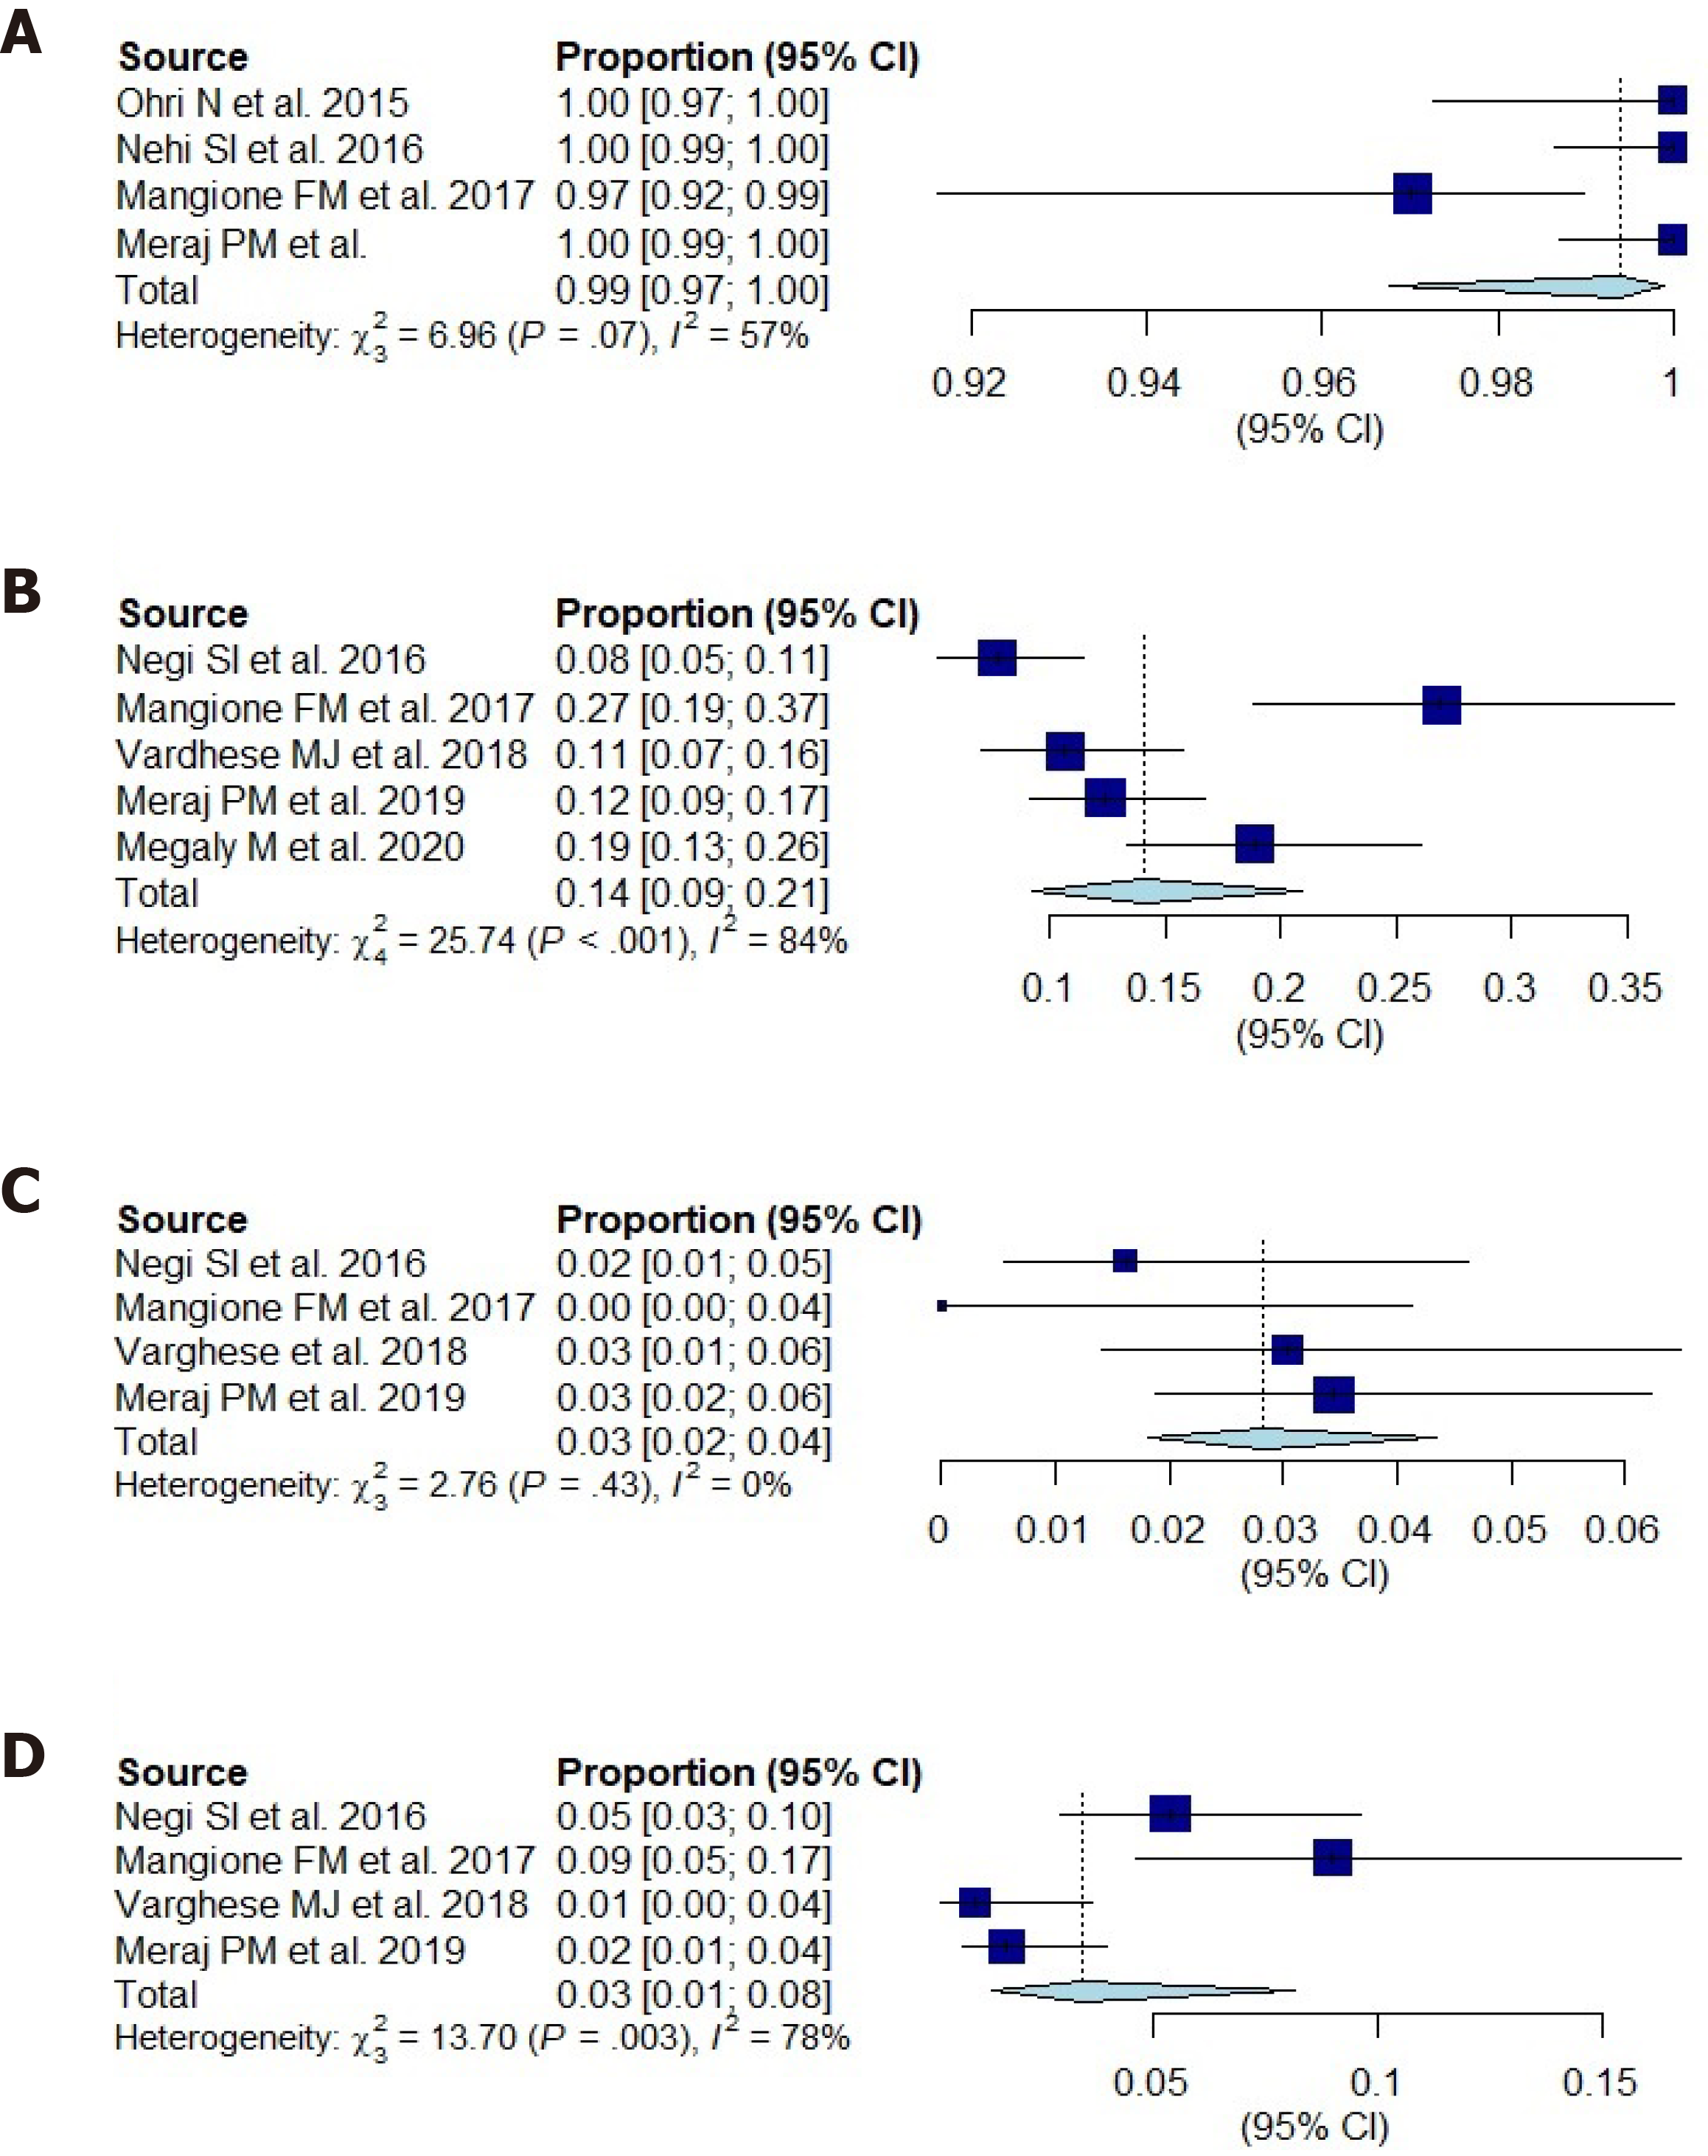
Figure 2 Forest plot for the clinical outcomes at 1 year.
A: Demonstrated procedural success at 1 year; B: Demonstrates target lesion revascularization at 1 year; C: Demonstrates myocardial infarction at 1 year; D: Demonstrates all-cause mortality at 1 year.
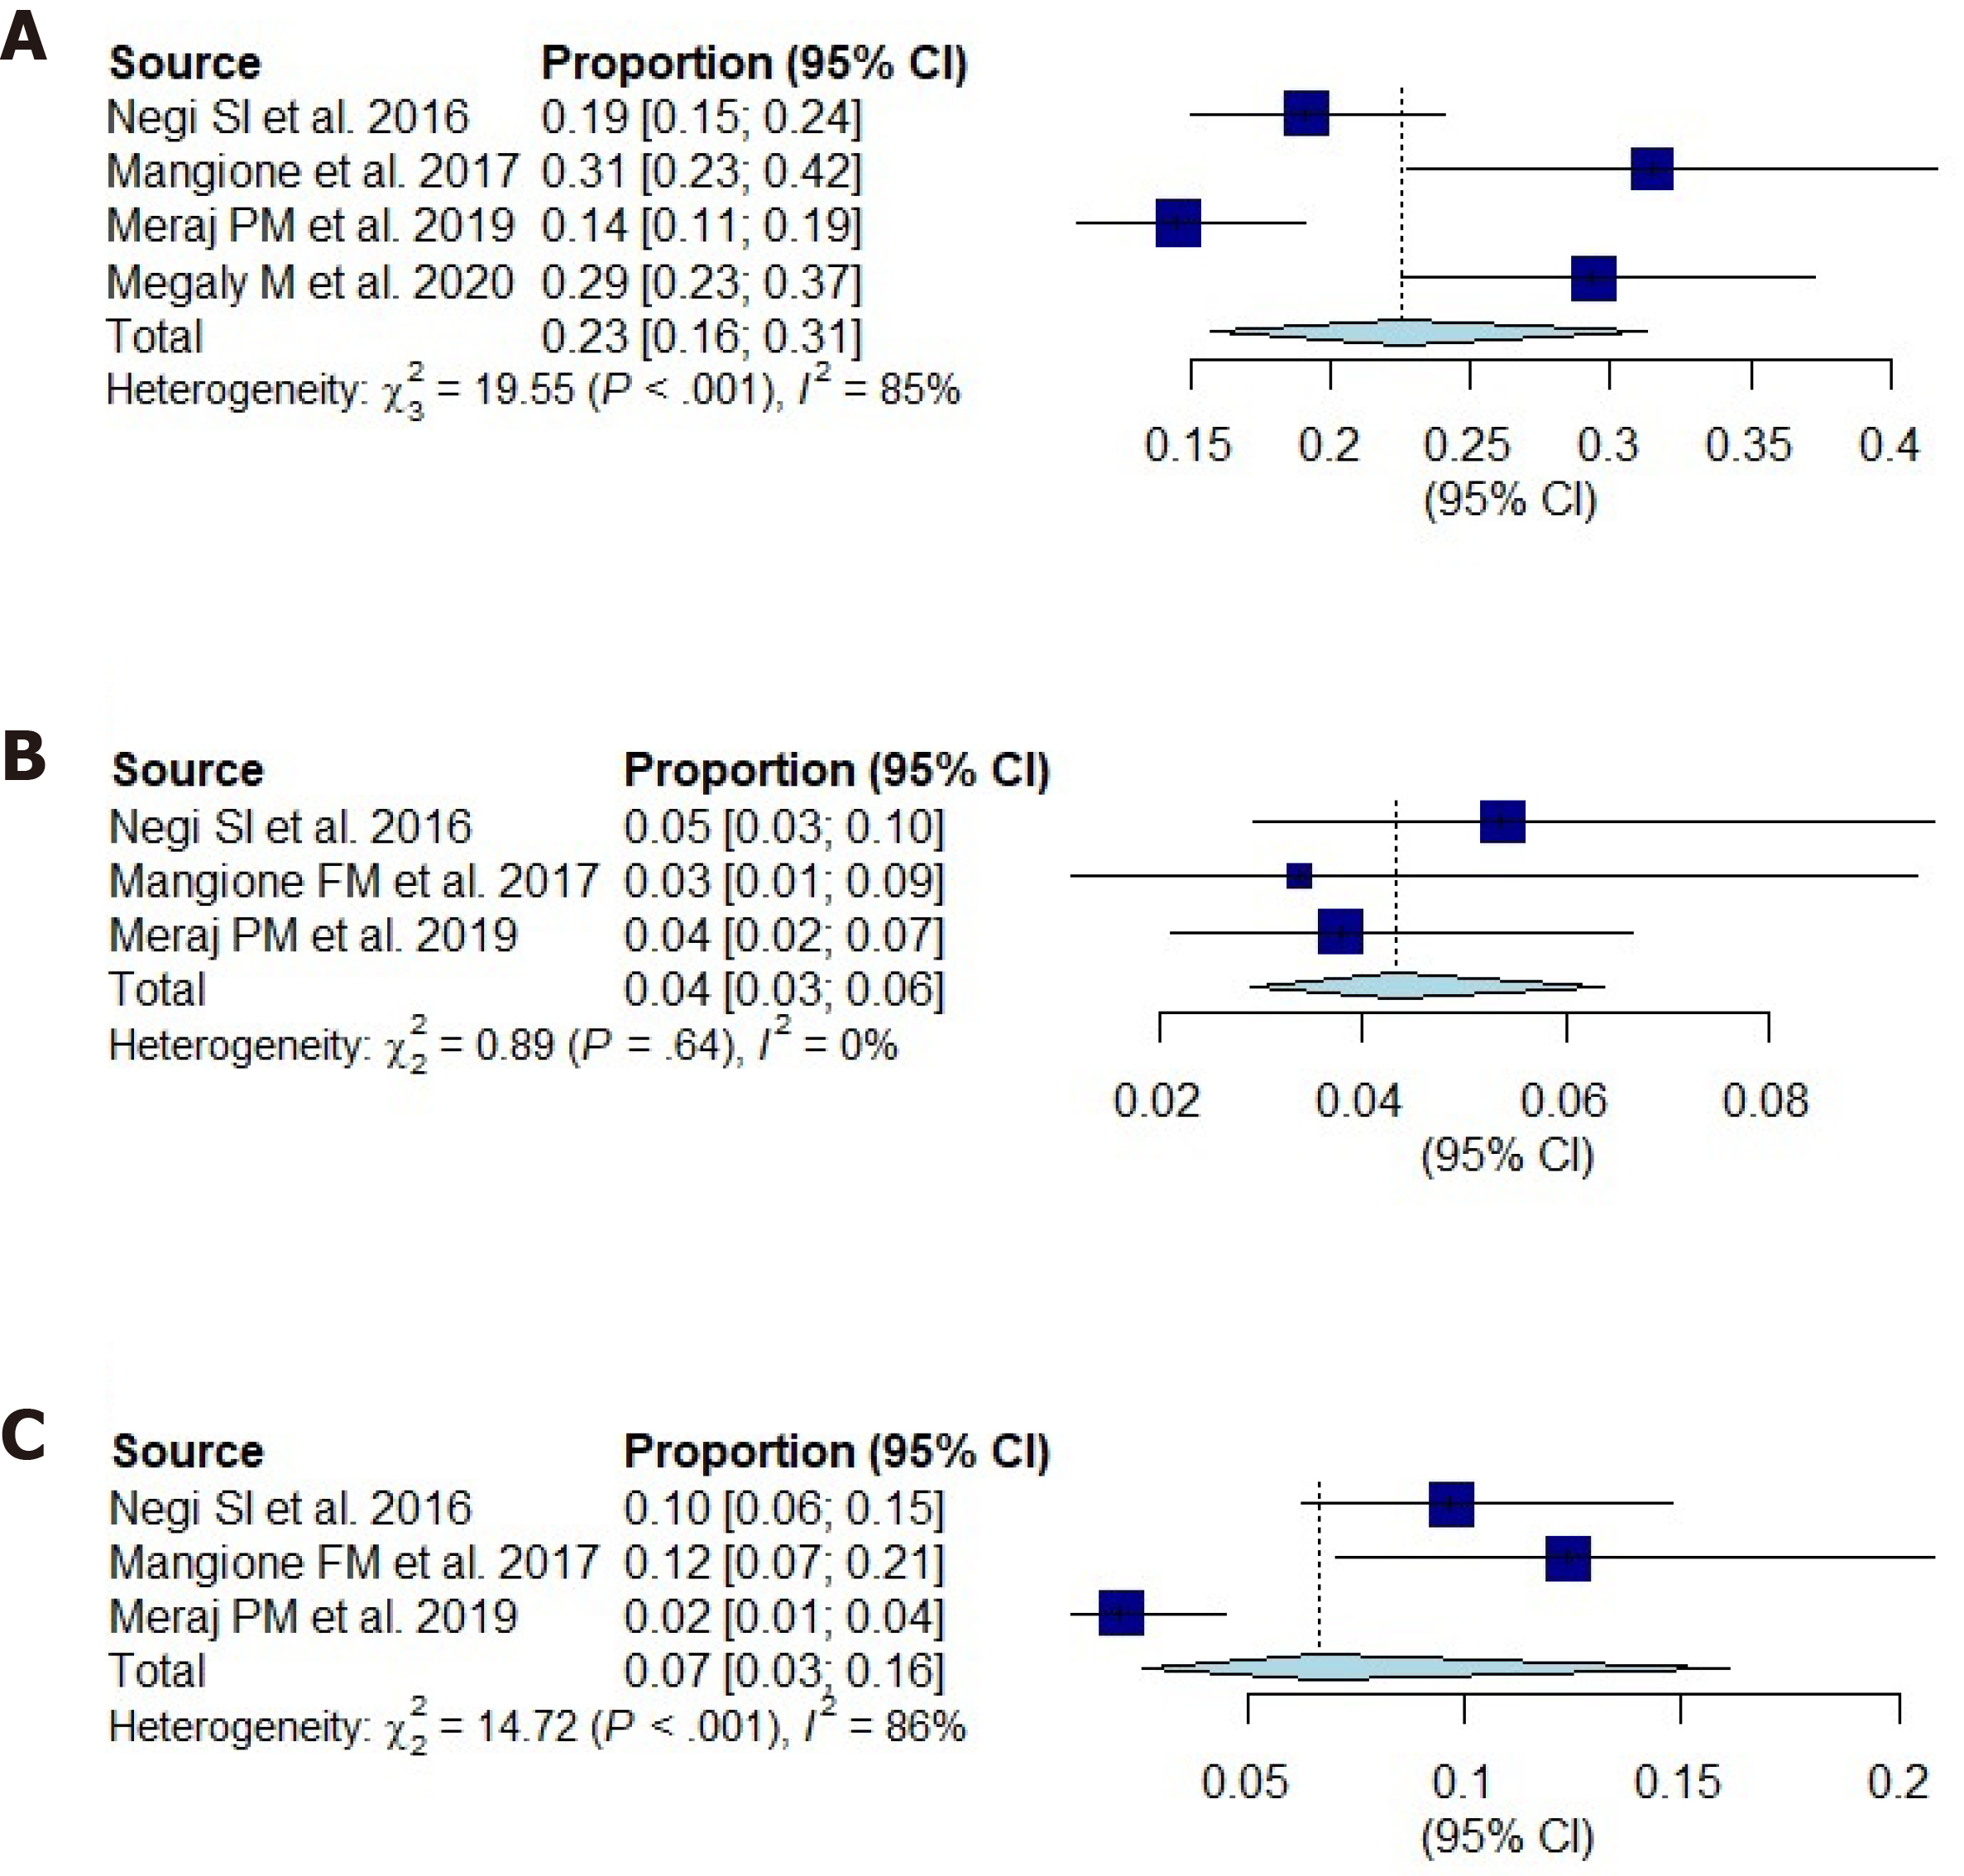
Figure 3 Forest plot for the clinical outcomes at 2 year.
A: Demonstrates target lesion revascularization at 2 years; B: Demonstrates myocardial infarction at 2 years; C: Demonstrates all-cause mortality at 2 years.
- Citation: Ilyas I, Kumar A, Adalja D, Shariff M, Desai R, Sattar Y, Vallabhajosyula S, Gullapalli N, Doshi R. Intracoronary brachytherapy for the treatment of recurrent drug-eluting stent in-stent restenosis: A systematic review and meta-analysis. World J Cardiol 2021; 13(4): 95-102
- URL: https://www.wjgnet.com/1949-8462/full/v13/i4/95.htm
- DOI: https://dx.doi.org/10.4330/wjc.v13.i4.95


