Copyright
©The Author(s) 2020.
World J Cardiol. Sep 26, 2020; 12(9): 460-467
Published online Sep 26, 2020. doi: 10.4330/wjc.v12.i9.460
Published online Sep 26, 2020. doi: 10.4330/wjc.v12.i9.460
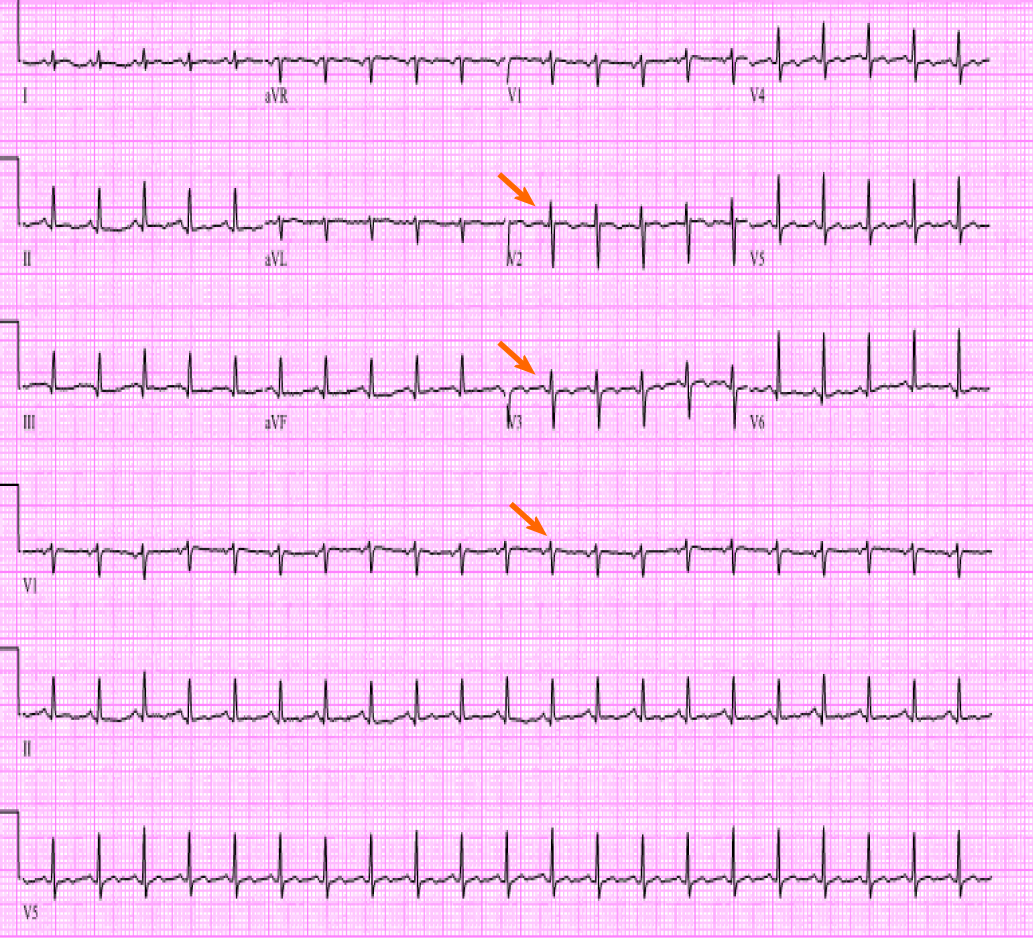
Figure 1 Electrocardiogram showed sinus tachycardia, low voltage QRS (arrows) with small ST-T wave changes.
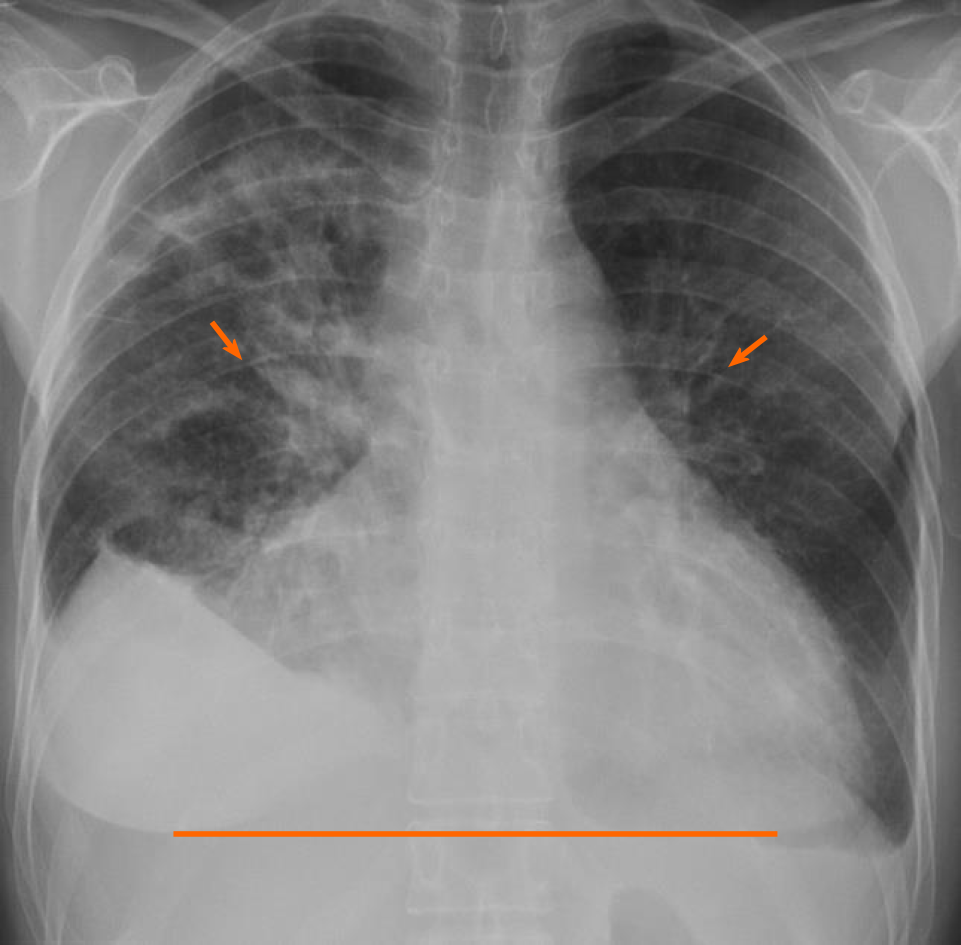
Figure 2 Chest radiograph revealed cardiomegaly (line) and bilateral opacities (arrows).
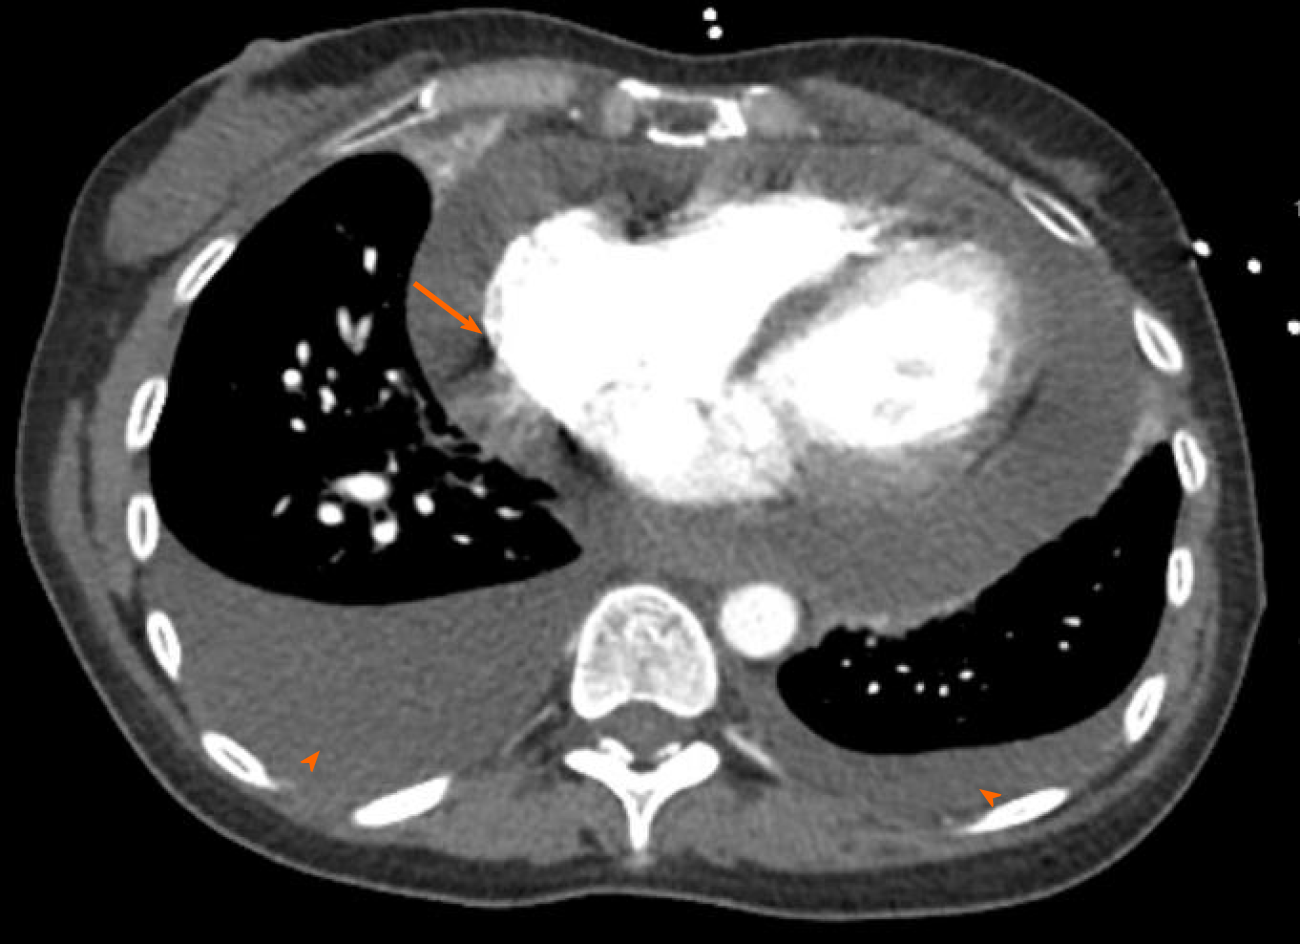
Figure 3 Chest computed tomography angiogram revealed a large pericardial effusion (arrow); moderate right and small left pleural effusion (arrowhead).
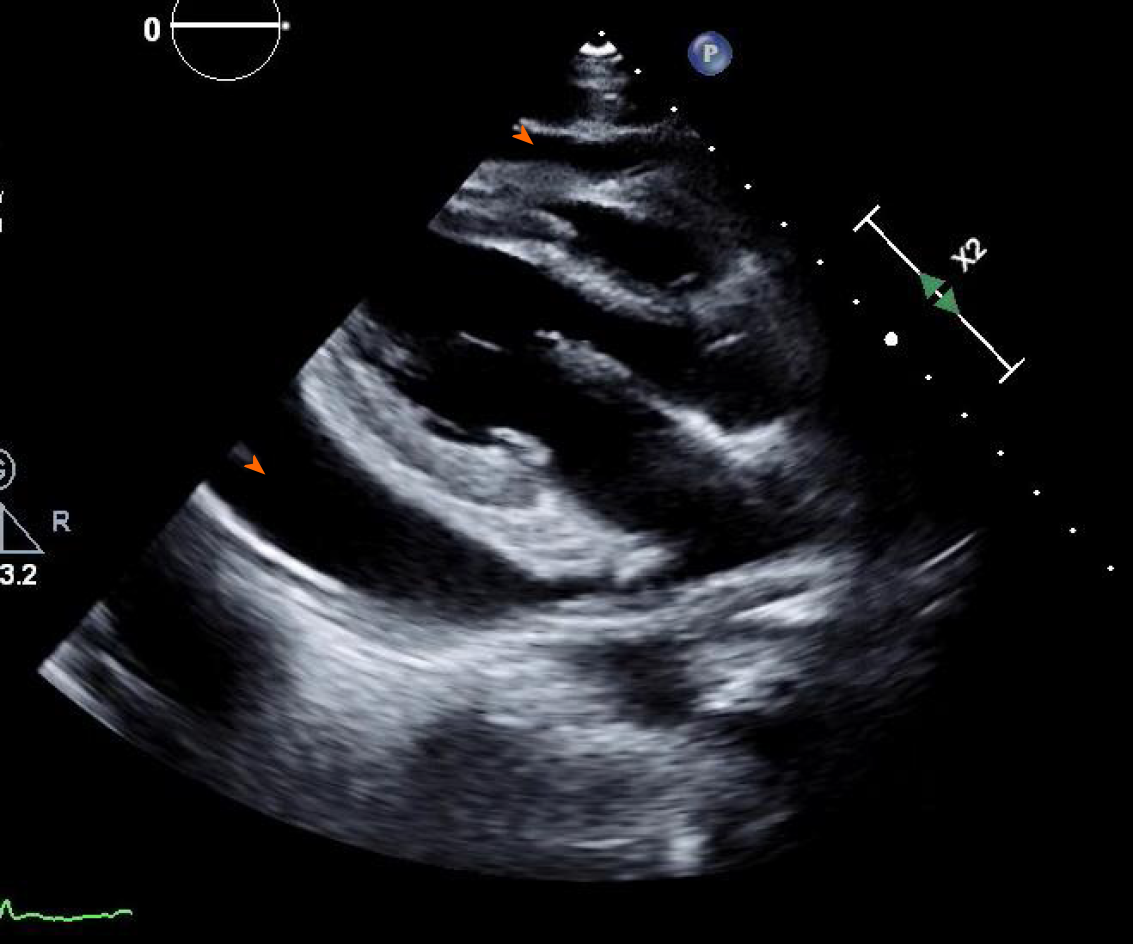
Figure 4 Transthoracic echocardiogram showed large pericardial effusion (arrowhead).
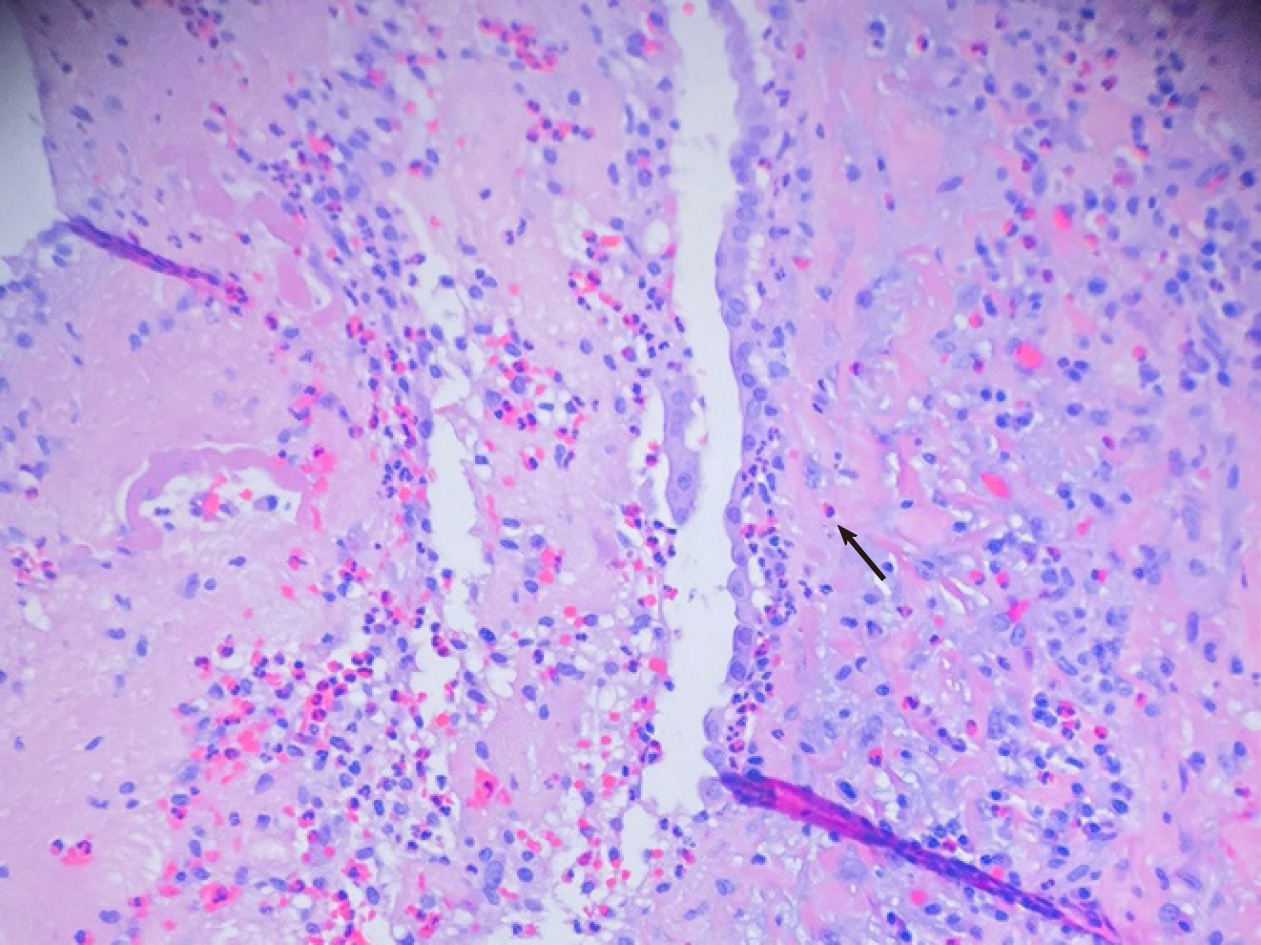
Figure 5 Cardiac biopsy revealed pericardial thickening with eosinophil predominant infiltrate (arrow).
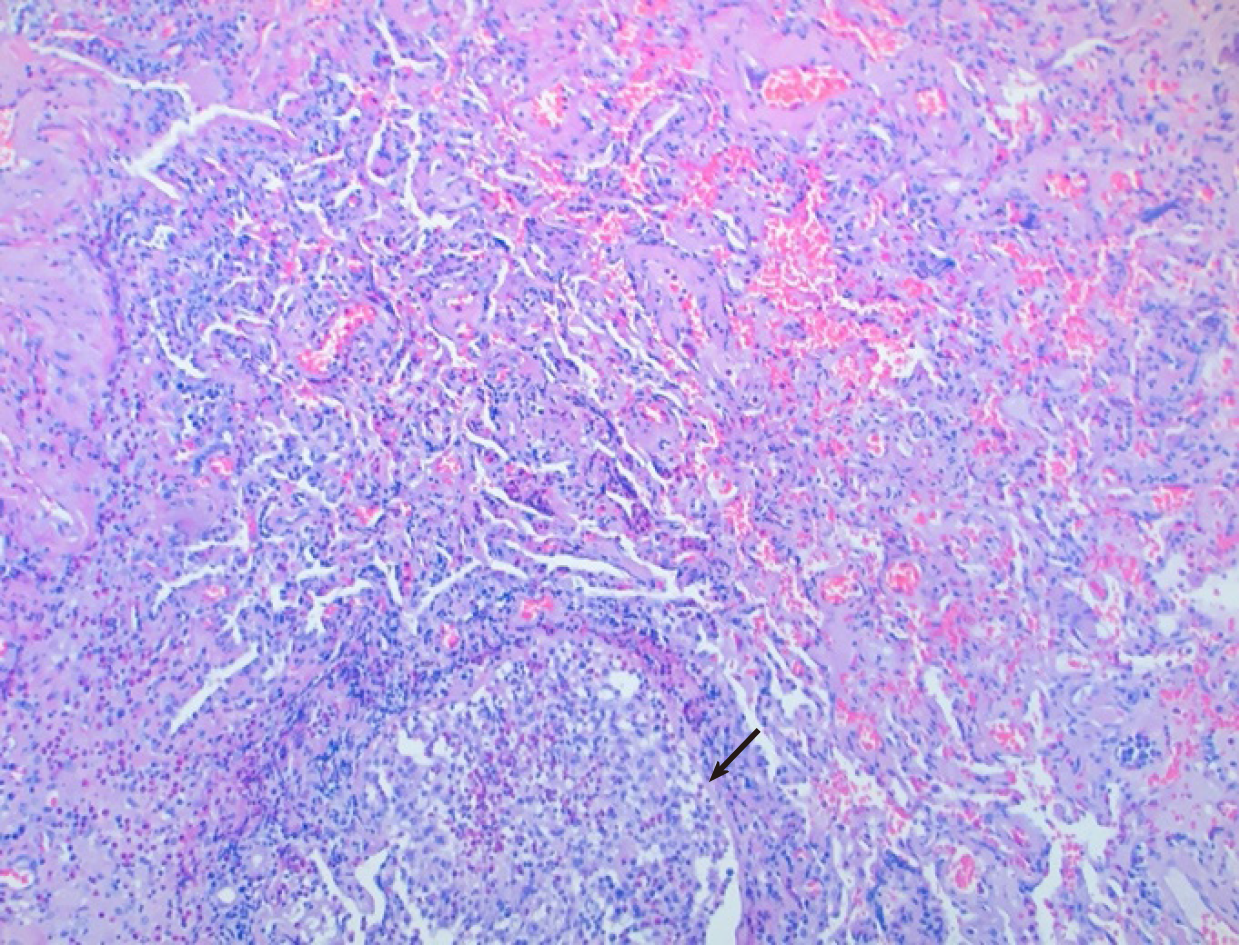
Figure 6 Lung biopsy revealed organizing inflammatory infiltrate, micro abscess (arrow), and eosinophil infiltrate.
- Citation: Alam L, Lasam G, Fishberg R. Pericardial effusion with tamponade – an uncommon presentation leading to the diagnosis of eosinophilic granulomatosis polyangiitis: A case report. World J Cardiol 2020; 12(9): 460-467
- URL: https://www.wjgnet.com/1949-8462/full/v12/i9/460.htm
- DOI: https://dx.doi.org/10.4330/wjc.v12.i9.460


