Copyright
©The Author(s) 2020.
World J Cardiol. Jun 26, 2020; 12(6): 291-302
Published online Jun 26, 2020. doi: 10.4330/wjc.v12.i6.291
Published online Jun 26, 2020. doi: 10.4330/wjc.v12.i6.291
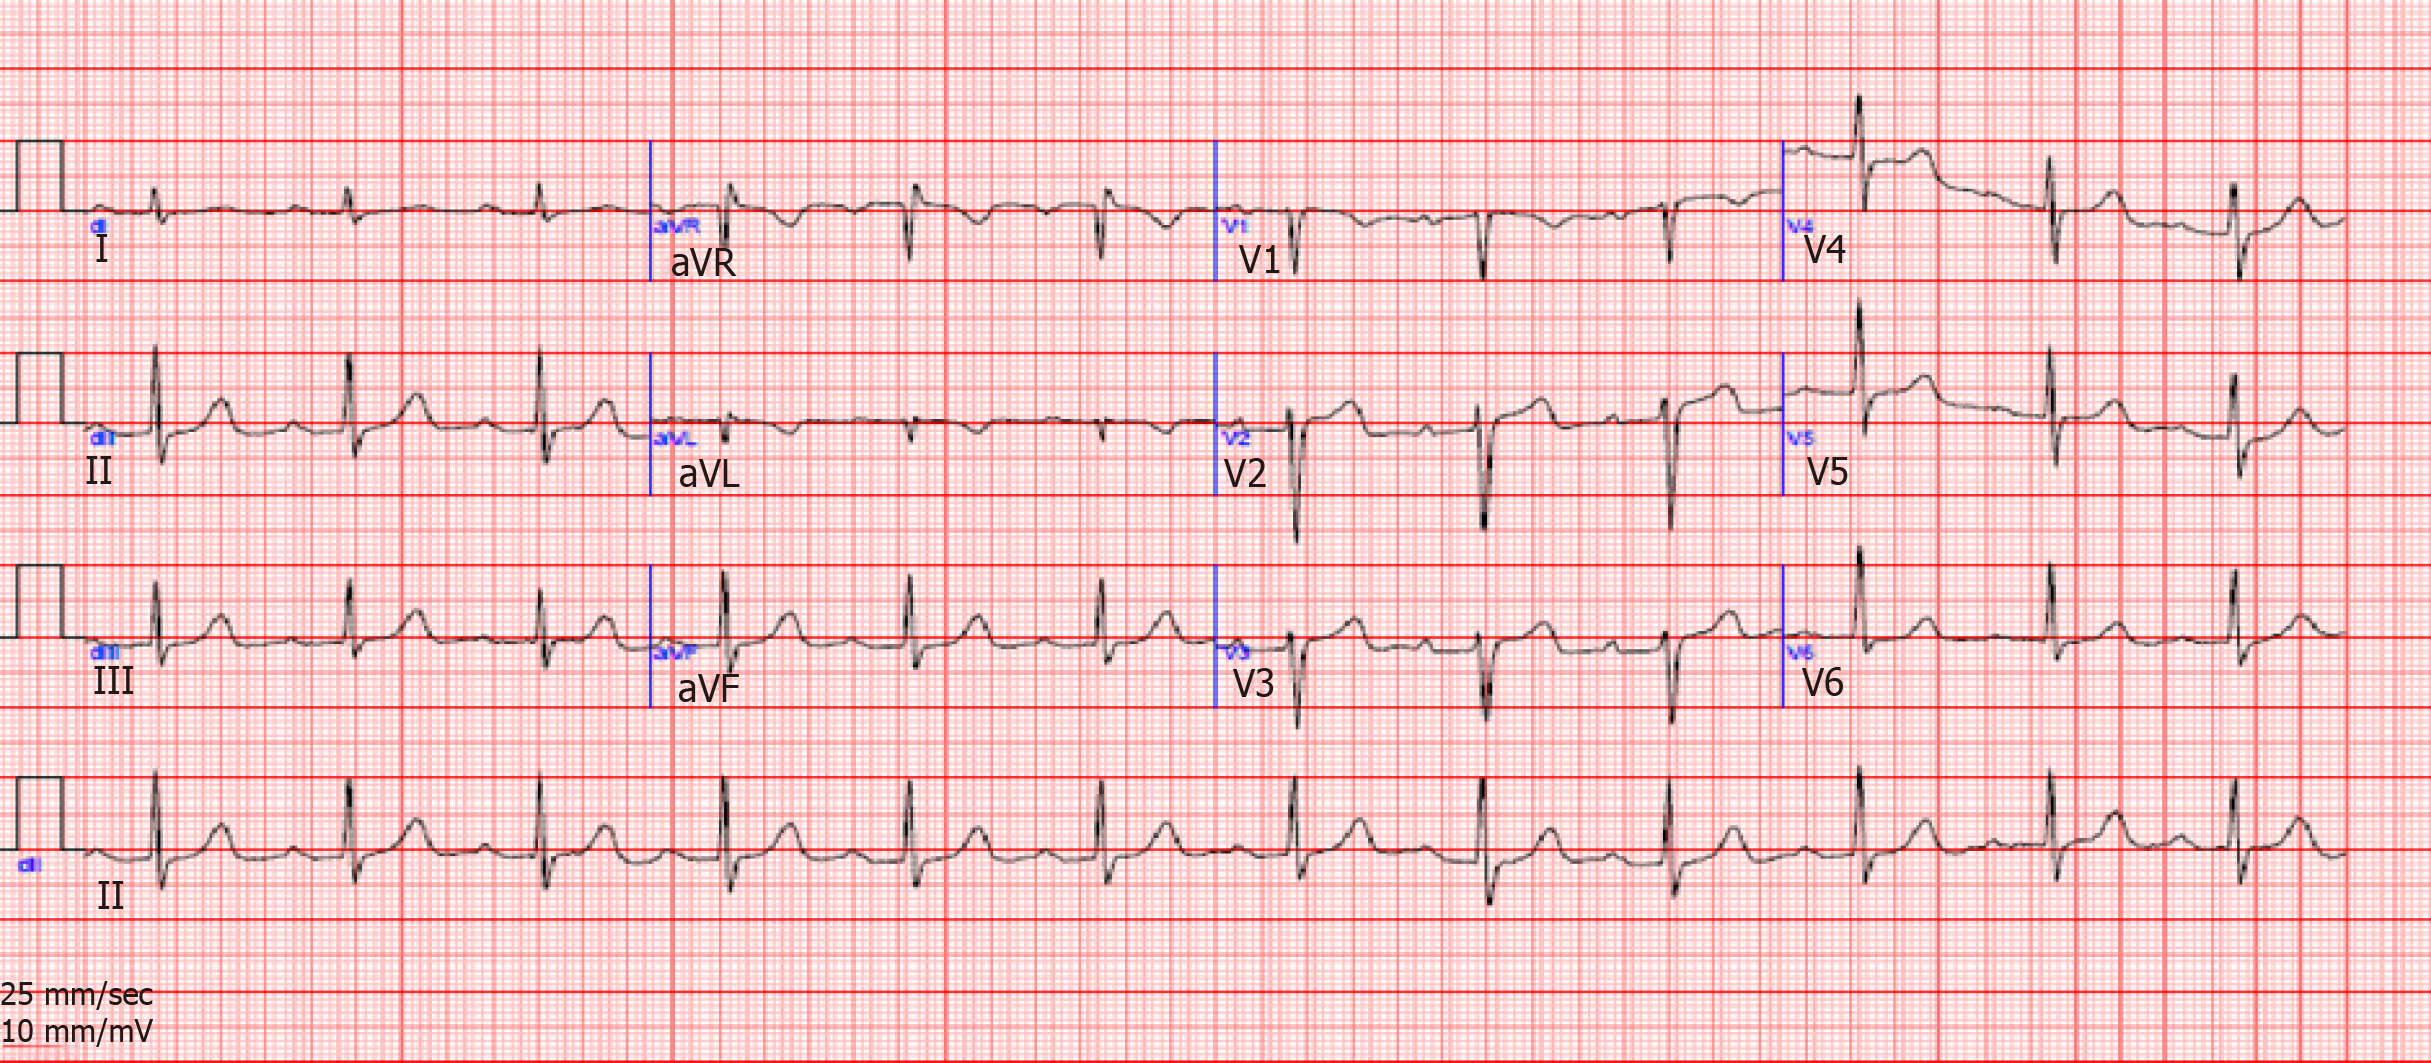
Figure 1 Resting electrocardiogram on presentation, showing first degree atrioventricular block and QTc at 450 ms.
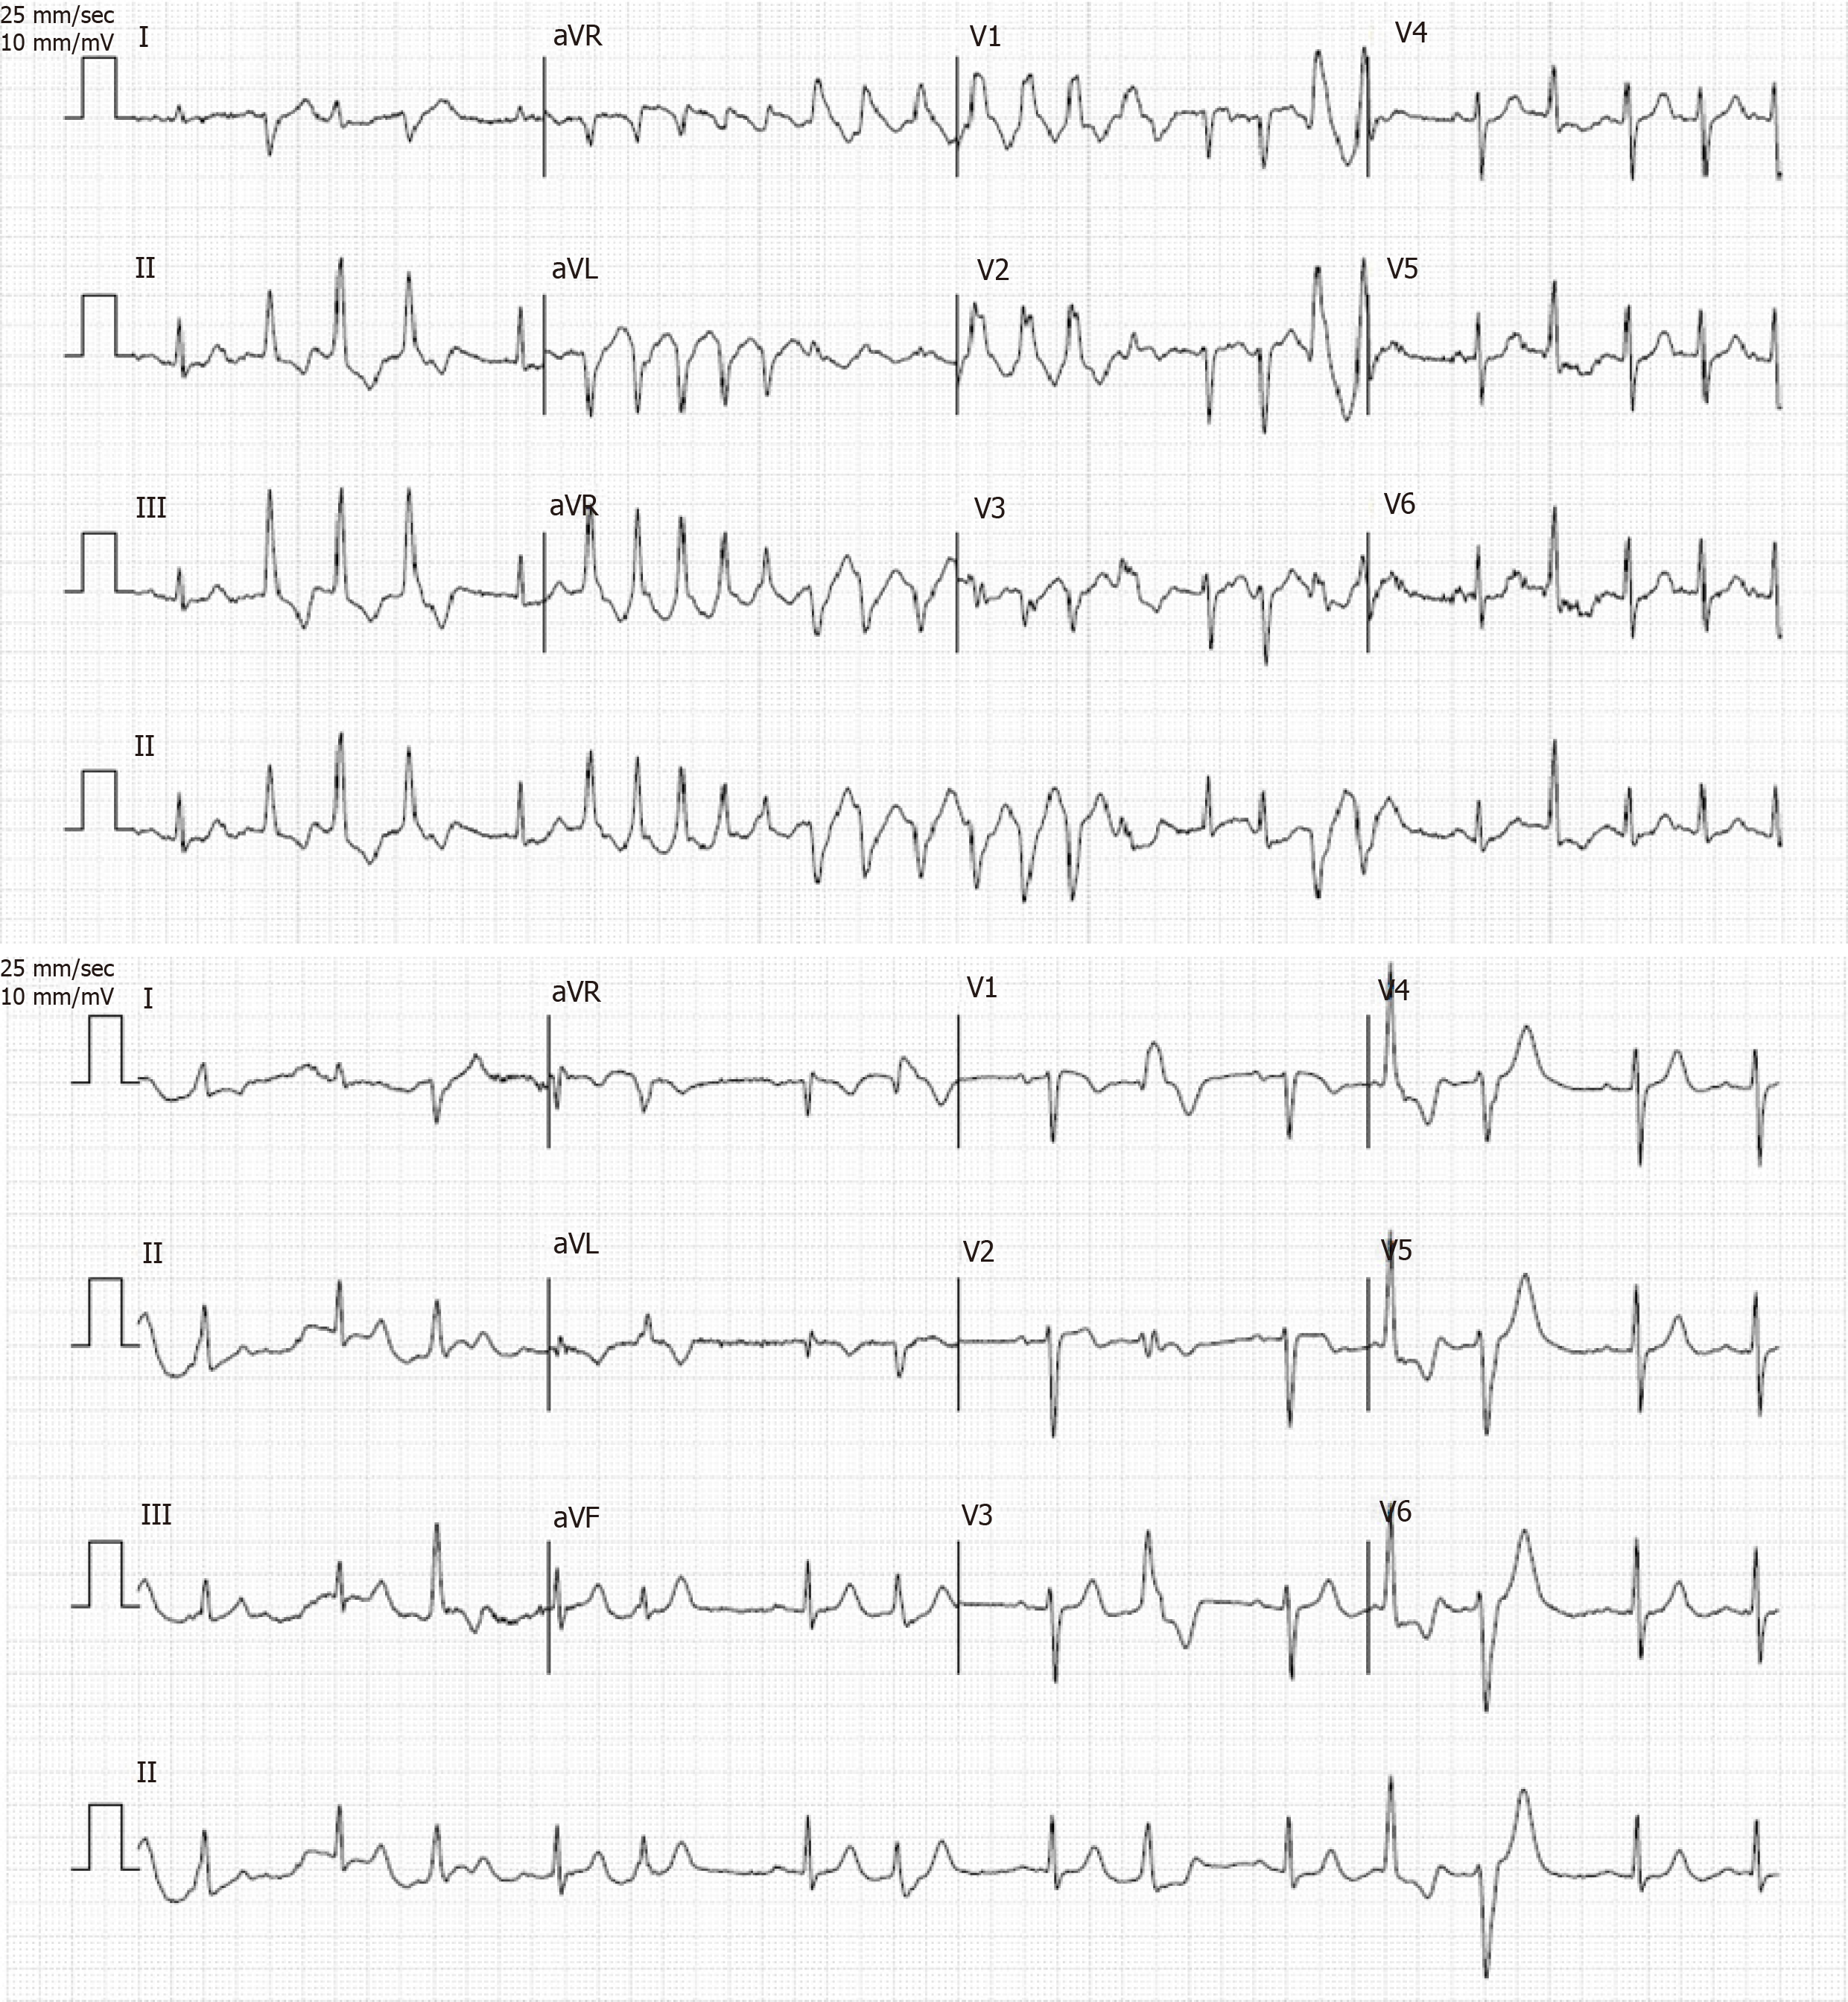
Figure 2 Exercise stress test, showing multifocal ventricular extrasystoles and torsades de pointes.
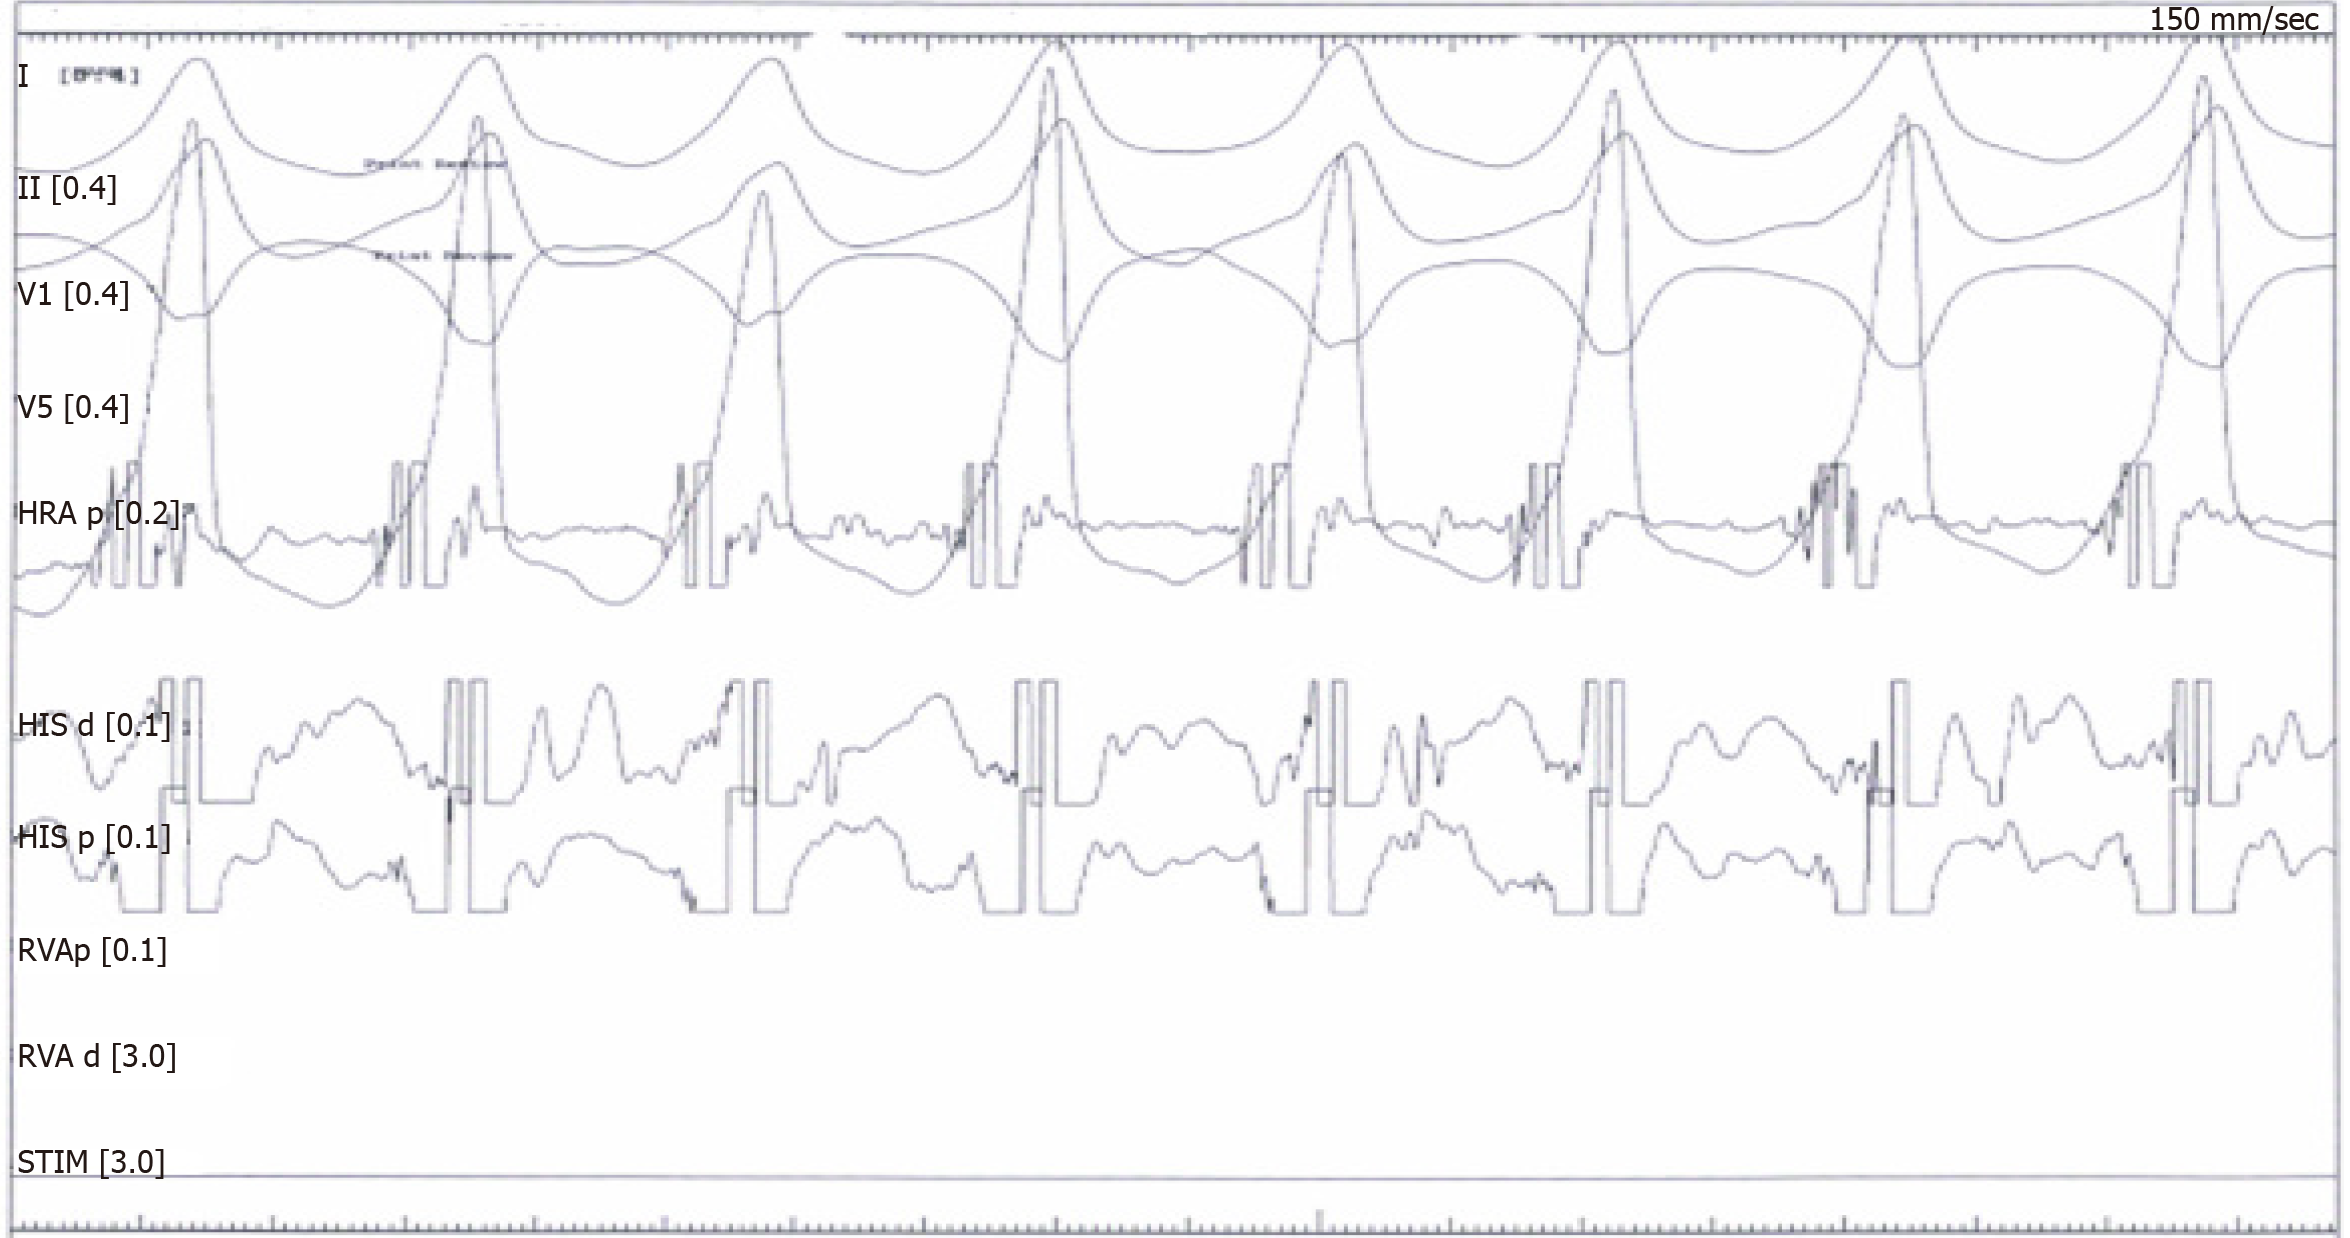
Figure 3 Cardiac electrophysiology study, showing a sustained induced ventricular tachycardia.
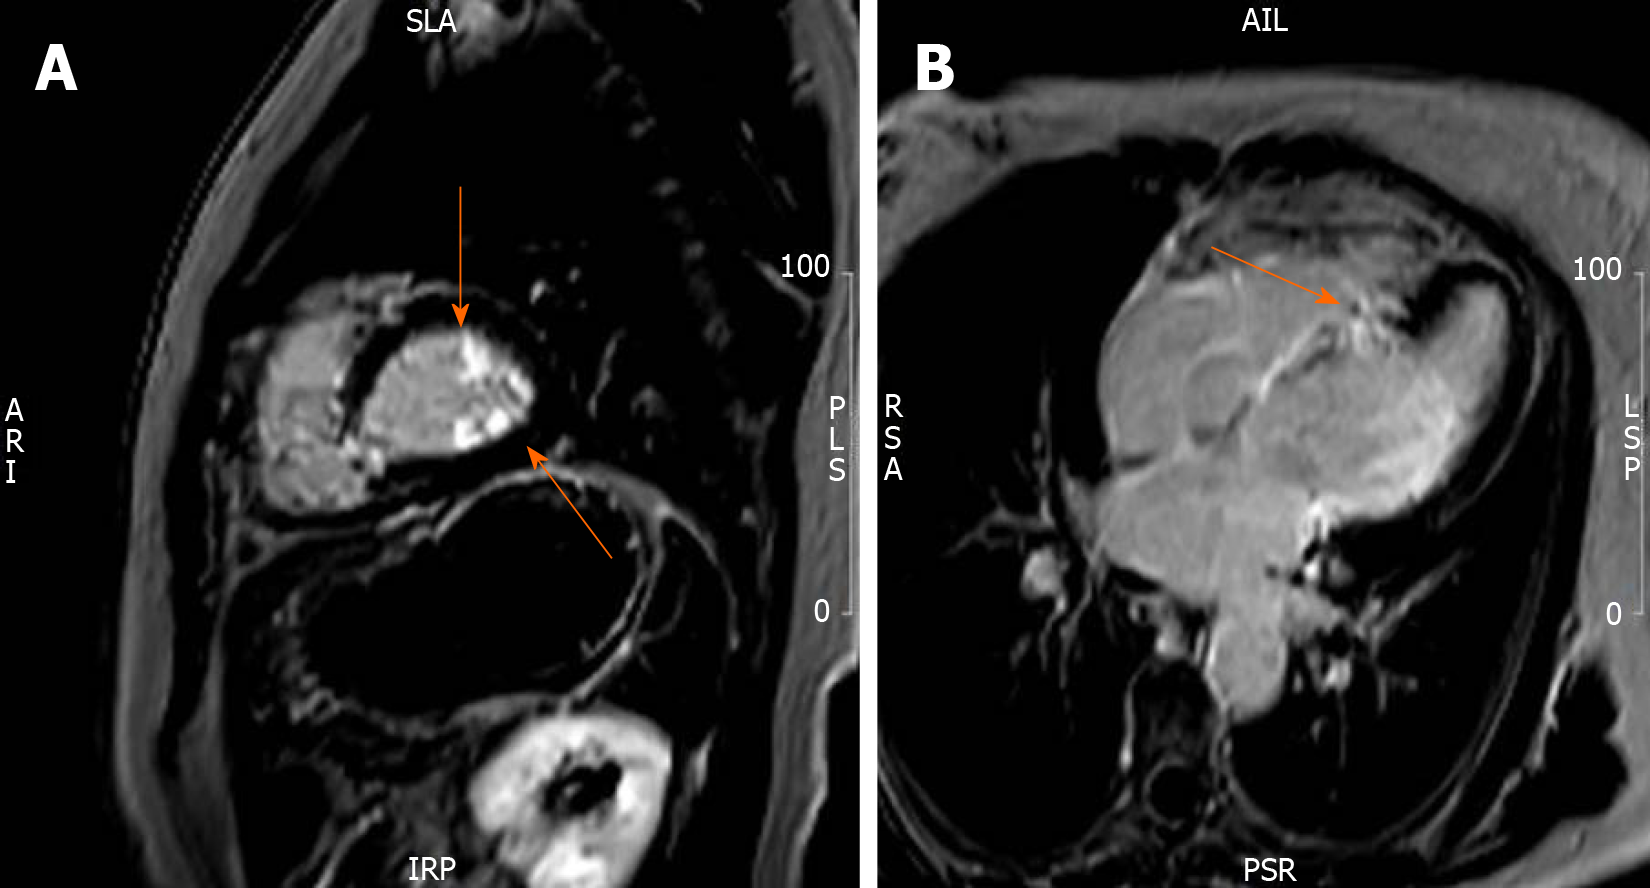
Figure 4 T1-weighted cardiac magnetic resonance image with delayed enhancement.
A: Hyperenhancement of the papillary muscles (arrows); B: Patchy transmural fibrosis of the septum (arrow).
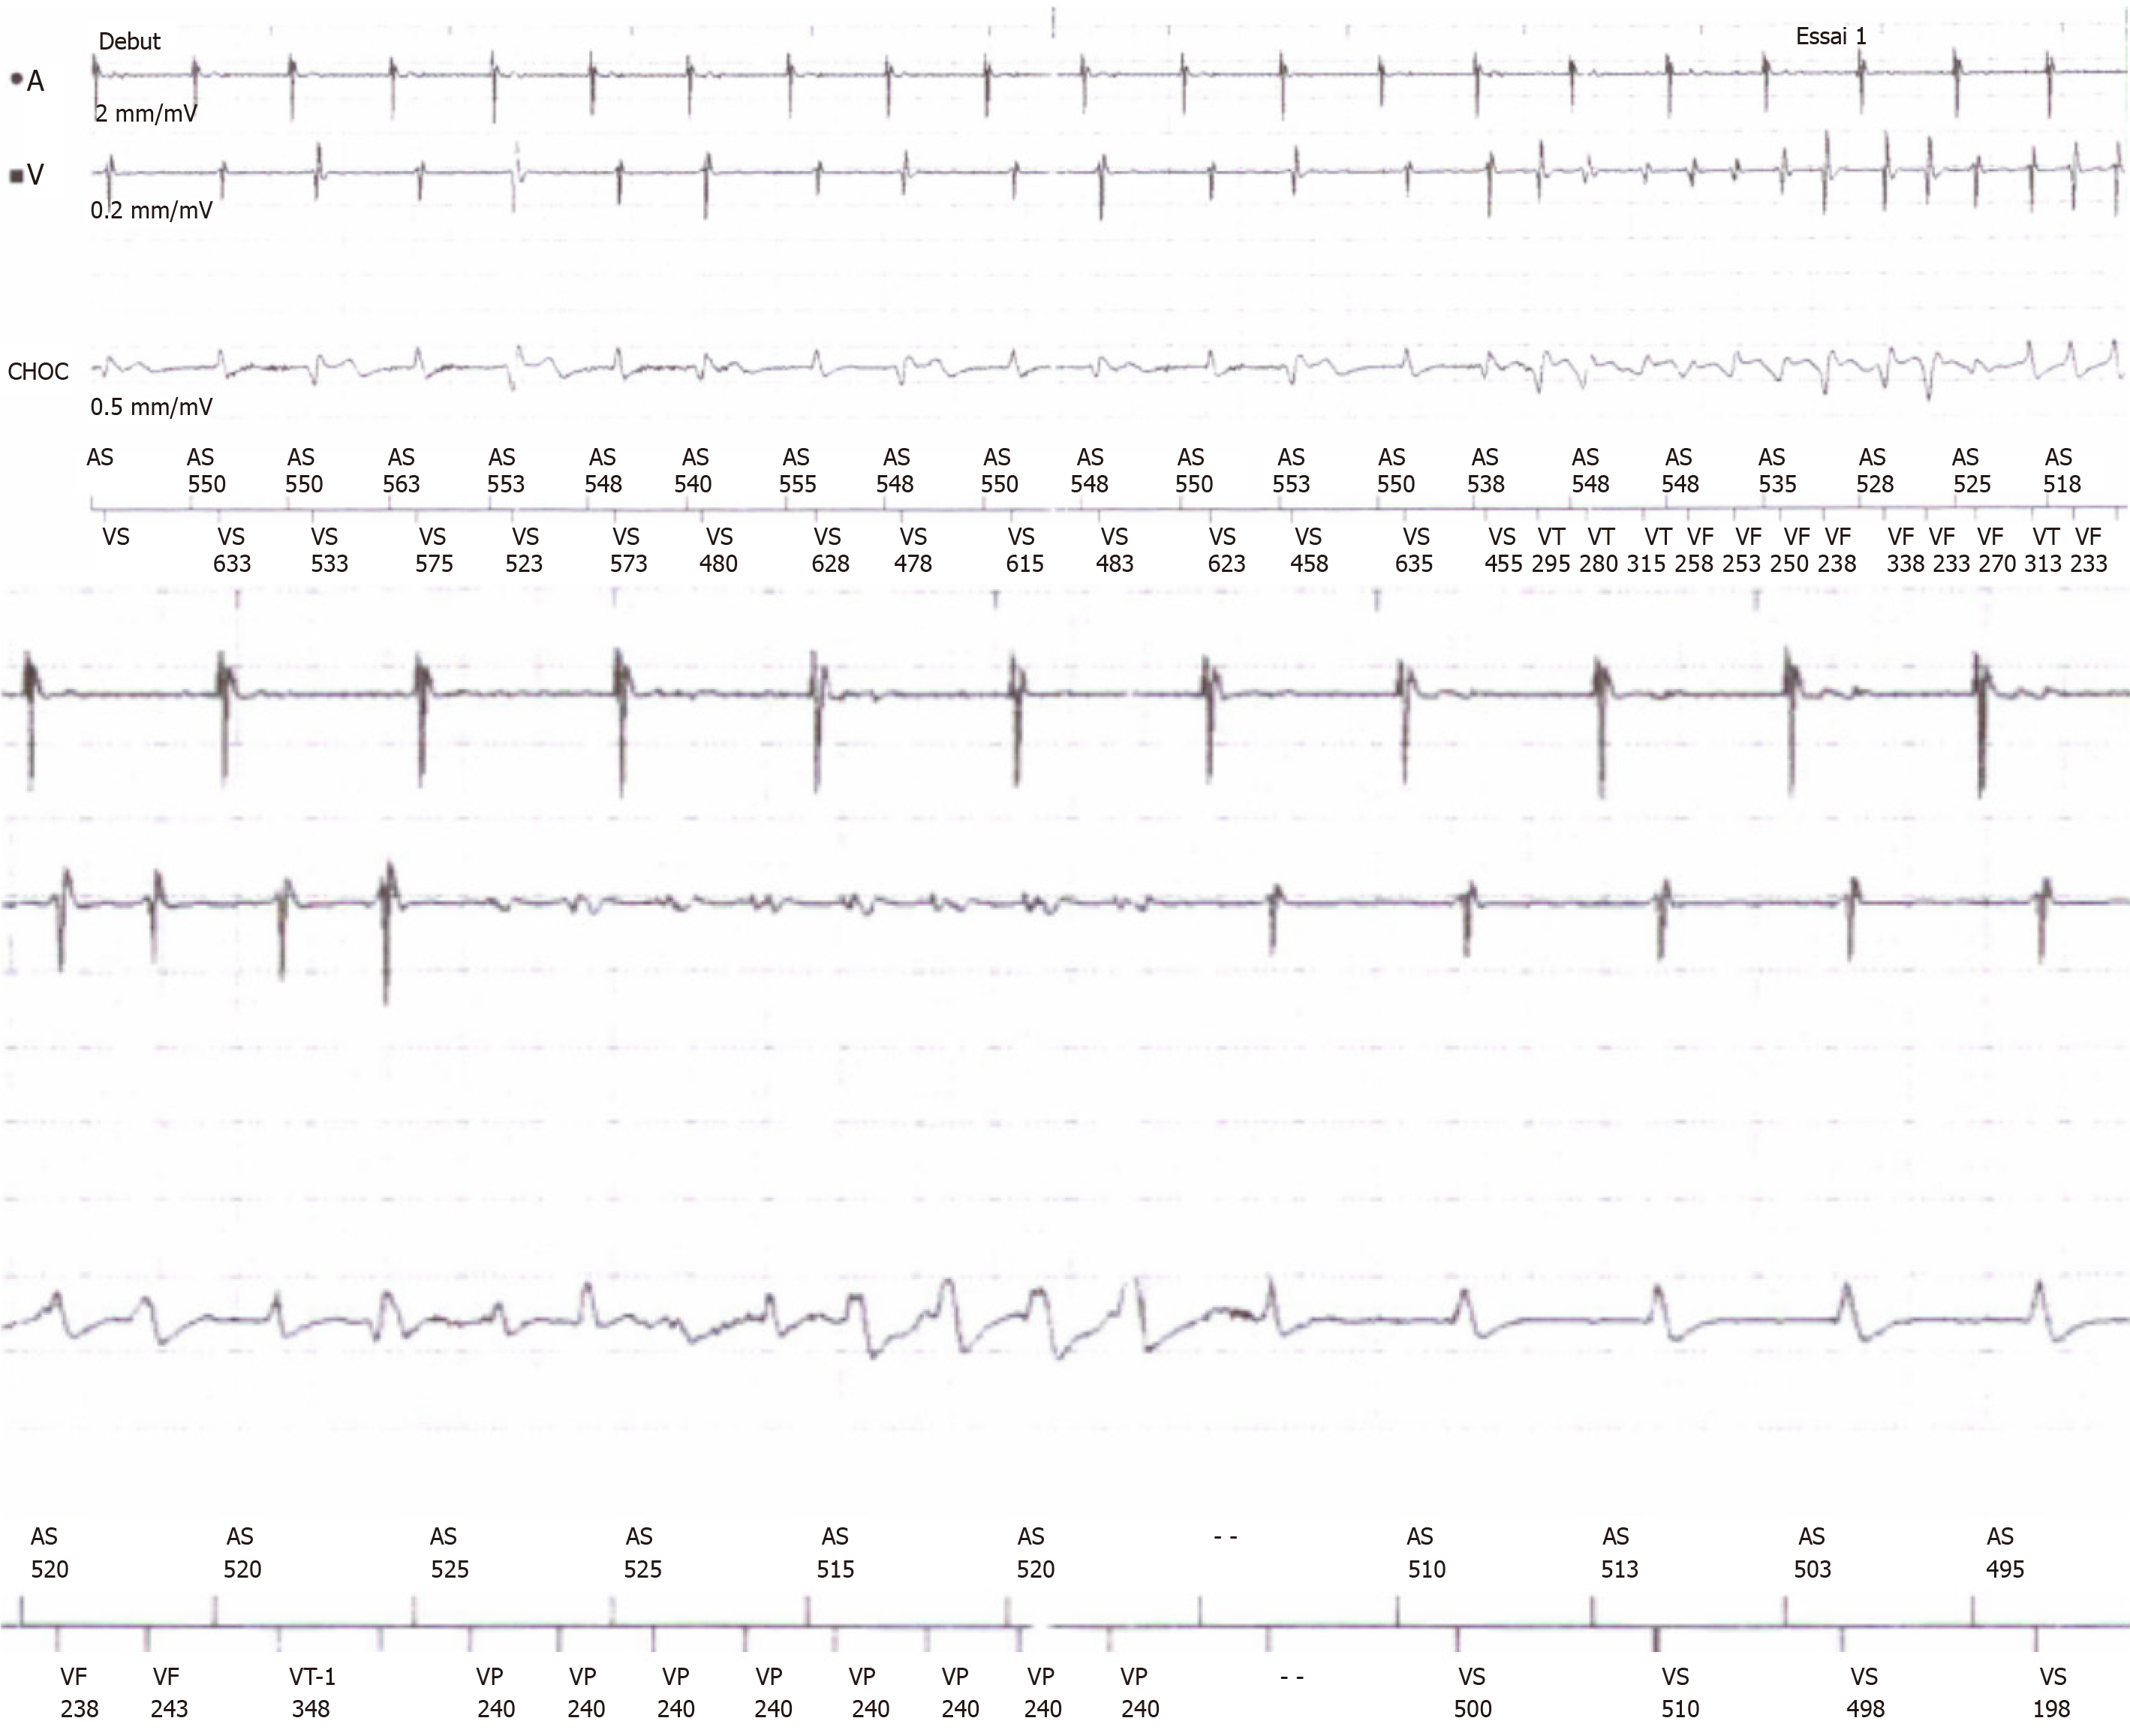
Figure 5 Episode of nonsustained ventricular tachycardia during implantable cardiac defibrillator interrogation stopped by an antitachycardia pacing run.
- Citation: Ghafari C, Vandergheynst F, Parent E, Tanaka K, Carlier S. Exercise-induced torsades de pointes as an unusual presentation of cardiac sarcoidosis: A case report and review of literature. World J Cardiol 2020; 12(6): 291-302
- URL: https://www.wjgnet.com/1949-8462/full/v12/i6/291.htm
- DOI: https://dx.doi.org/10.4330/wjc.v12.i6.291


