Copyright
©The Author(s) 2020.
World J Cardiol. Apr 26, 2020; 12(4): 123-135
Published online Apr 26, 2020. doi: 10.4330/wjc.v12.i4.123
Published online Apr 26, 2020. doi: 10.4330/wjc.v12.i4.123
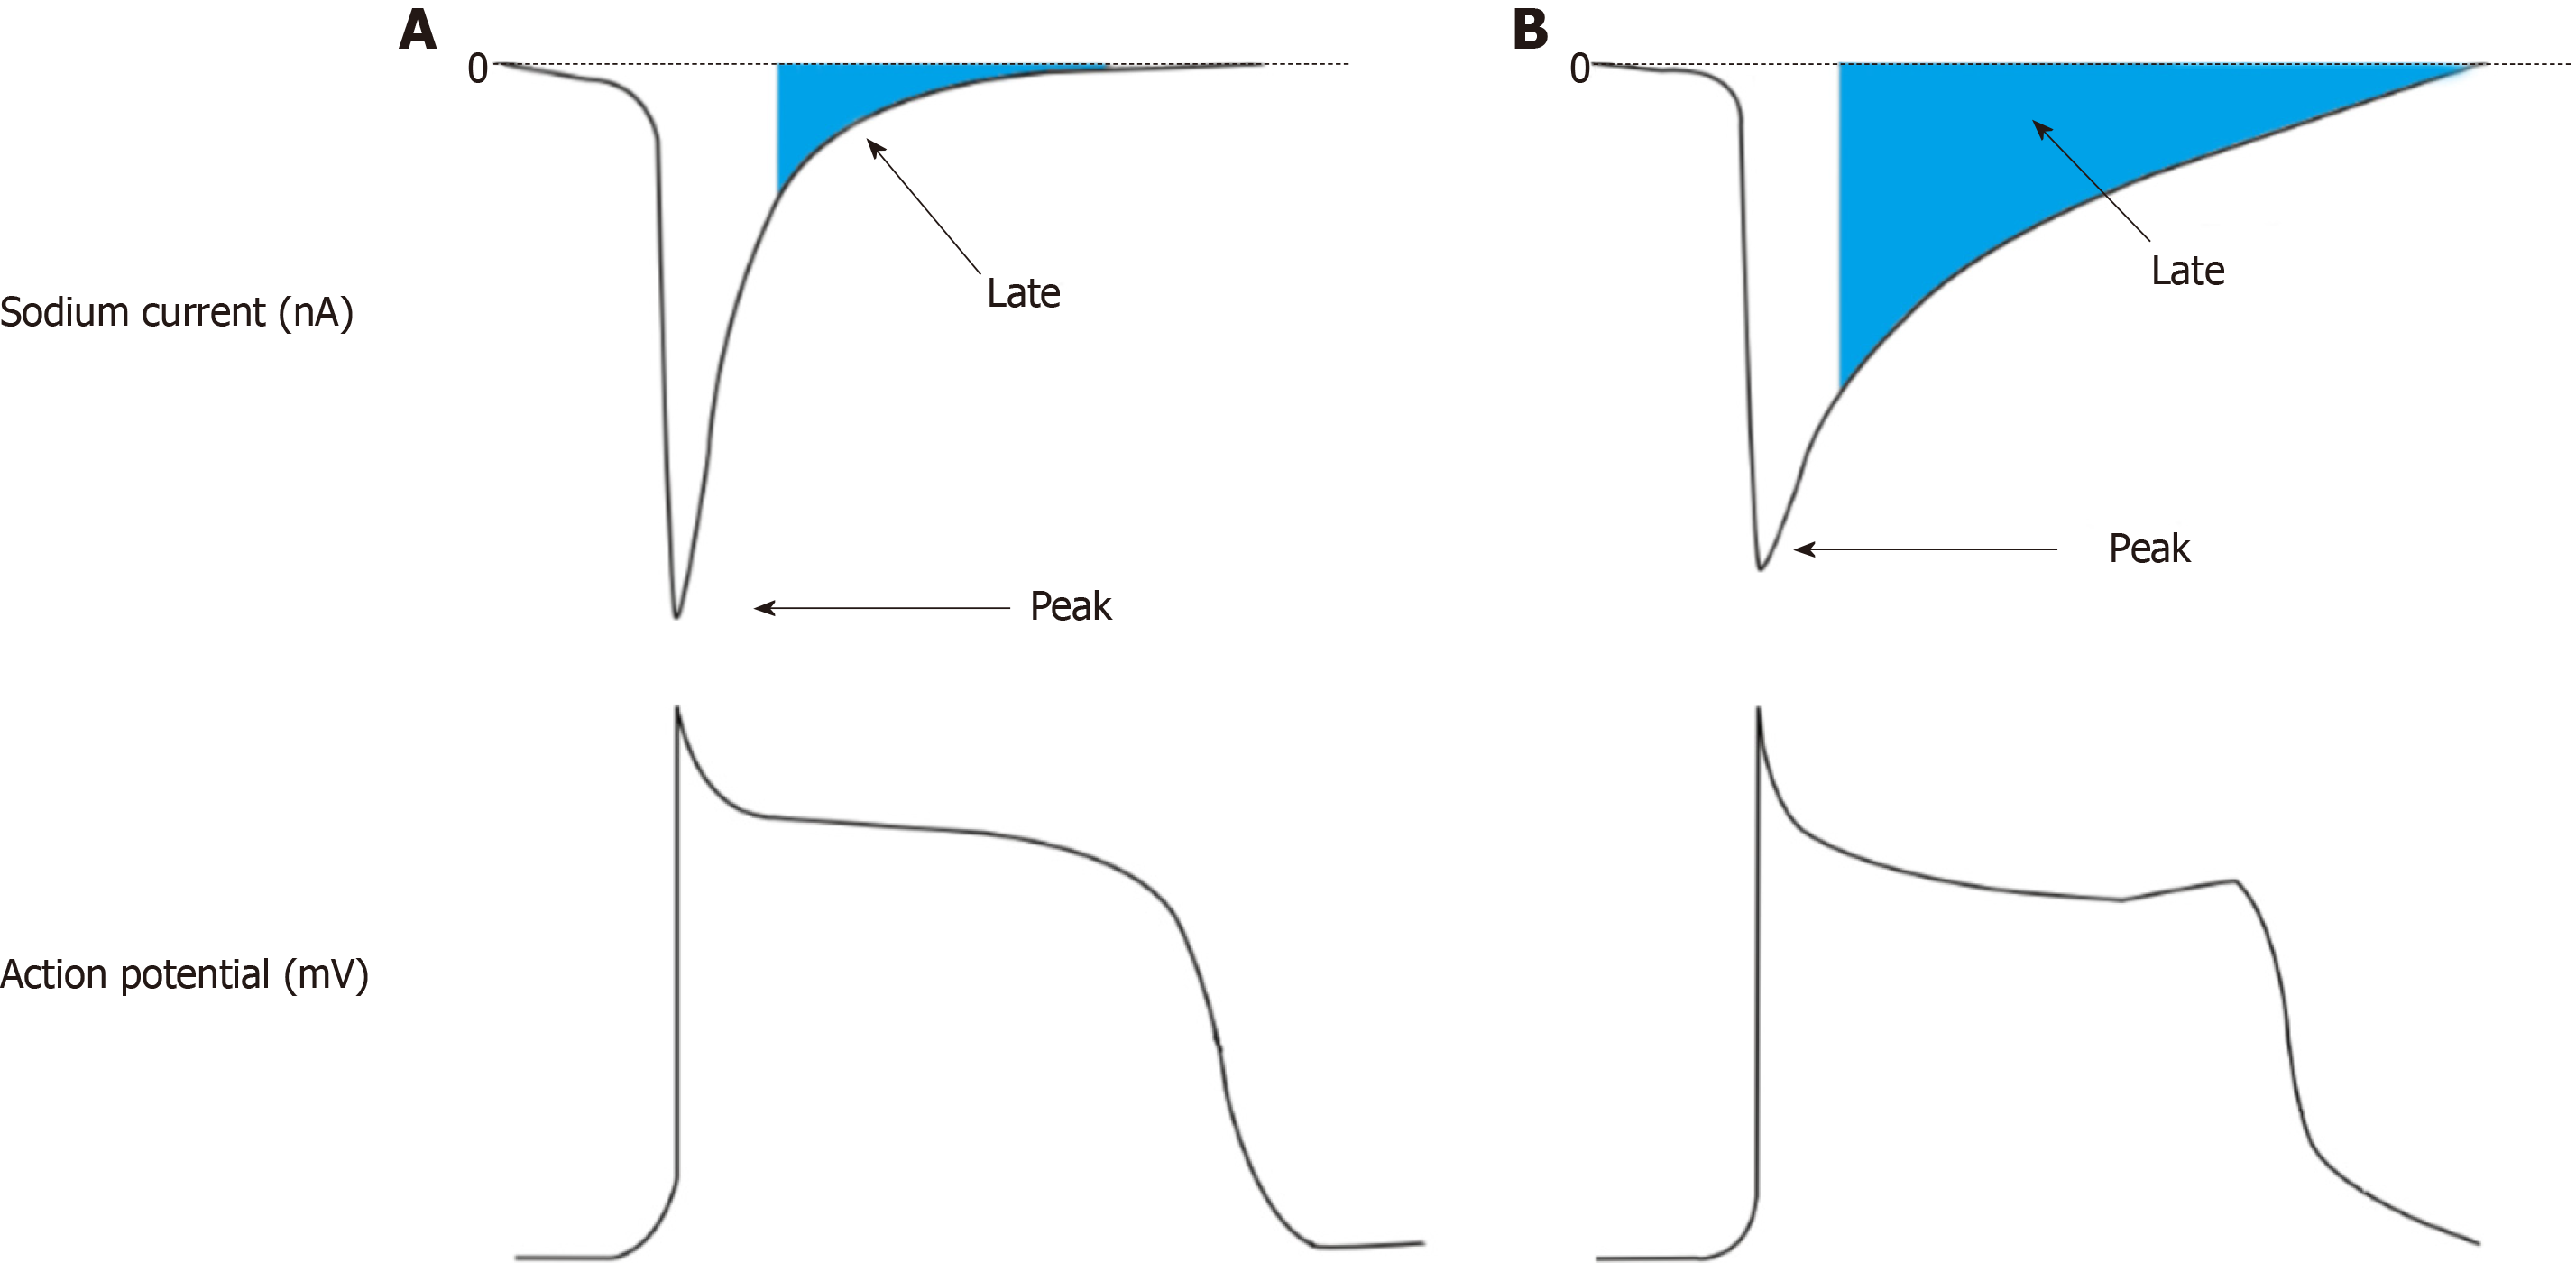
Figure 1 Peak and Late sodium currents on action potential morphology.
A: Top left: An illustration of a normal sodium current within a cardiomyocyte with its rapid peak current and short late current; Bottom left: An action potential as a result of normal sodium ion influx. Plateau and repolarisation phases are not prolonged and no afterdepolarizations present; B: Top right: An Illustration of a pathologically enhanced late sodium current; Bottom right: An action potential as a consequence of enhanced late sodium current with a prolonged plateau and repolarisation period. The late upstroke between phase 2 and phase 3 represents an after depolarisation brought about due to the aberrant late sodium current. Adapted from Vadnais et al[74], 2010 with permission.
Figure 2 Gain of function effects of SCN5a mutations on channel gating.
Top left: Curves illustrating the fraction of channels activated (white squares) and the fraction of channels inactivated (grey squares) vs membrane potential. Green squares demonstrate the effect of a gain of function mutation resulting in incomplete inactivation of sodium channels at higher membrane potentials. This results in a higher fraction of channels inappropriately activated for a longer period, therefore developing an enhanced late current (Bottom left); Top right: Curves illustrating the delayed inactivation of sodium channels due to gain of function mutations resulting in an increased window current where channels may reactivate, again leading to increased late current; Bottom right: A normal action potential (blue) and an action potential with a prolonged plateau and repolarisation phases (green) as a consequence of faulty sodium channel gating mechanics brought about by gain of function mutations in SCN5a gene leading to aberrant sodium currents. Adapted from Wilde et al[75], 2018, with permission.
Figure 3 Loss of function effects of SCN5a mutations on channel gating.
Top Left: Curves illustrating the fraction of channels activated (white squares) and the fraction of channels inactivated (grey squares) vs membrane potential. Orange squares represent the effect of loss of function mutation on channel activation, the white curve is shifted to the right demonstrating a delay; Top right: Orange squares here represent the effect of loss of function mutation on channel inactivation. The grey curve is shifted to the left demonstrating early inactivation. Both of these effects mean a reduction in Na+ availability and a decreased peak sodium current (Bottom left); Bottom right: A normal action potential (blue) juxtaposed alongside an action potential due to a loss of function mutation (orange). Action potential upstroke is diminished and slowed. Adapted from Wilde et al[75], 2018, with permission.
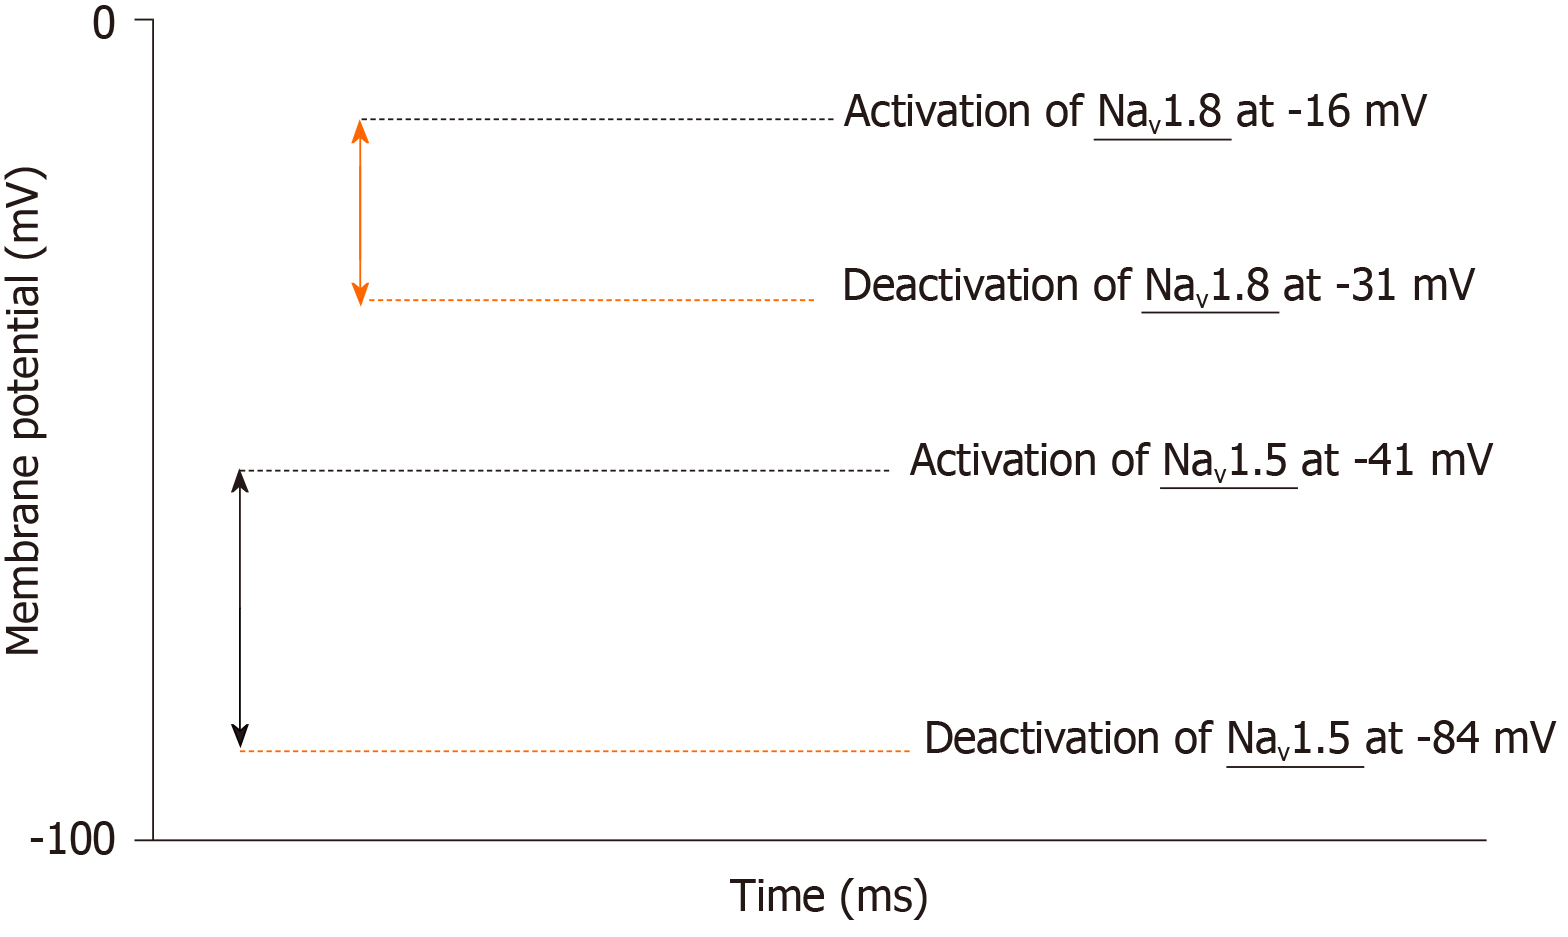
Figure 4 Visual Schematic representing the relative gating kinetics of Nav1.
5 and Nav1.8. Nav1.5 represented by the double-headed blue arrow activates at -41 mV and deactivates at -83 mV. Nav1.8 represented by the double-headed orange arrow activates at -16 mV and deactivates at -31 mV.
- Citation: Isaac E, Cooper SM, Jones SA, Loubani M. Do age-associated changes of voltage-gated sodium channel isoforms expressed in the mammalian heart predispose the elderly to atrial fibrillation? World J Cardiol 2020; 12(4): 123-135
- URL: https://www.wjgnet.com/1949-8462/full/v12/i4/123.htm
- DOI: https://dx.doi.org/10.4330/wjc.v12.i4.123


