Copyright
©The Author(s) 2020.
World J Cardiol. Jan 26, 2020; 12(1): 44-54
Published online Jan 26, 2020. doi: 10.4330/wjc.v12.i1.44
Published online Jan 26, 2020. doi: 10.4330/wjc.v12.i1.44
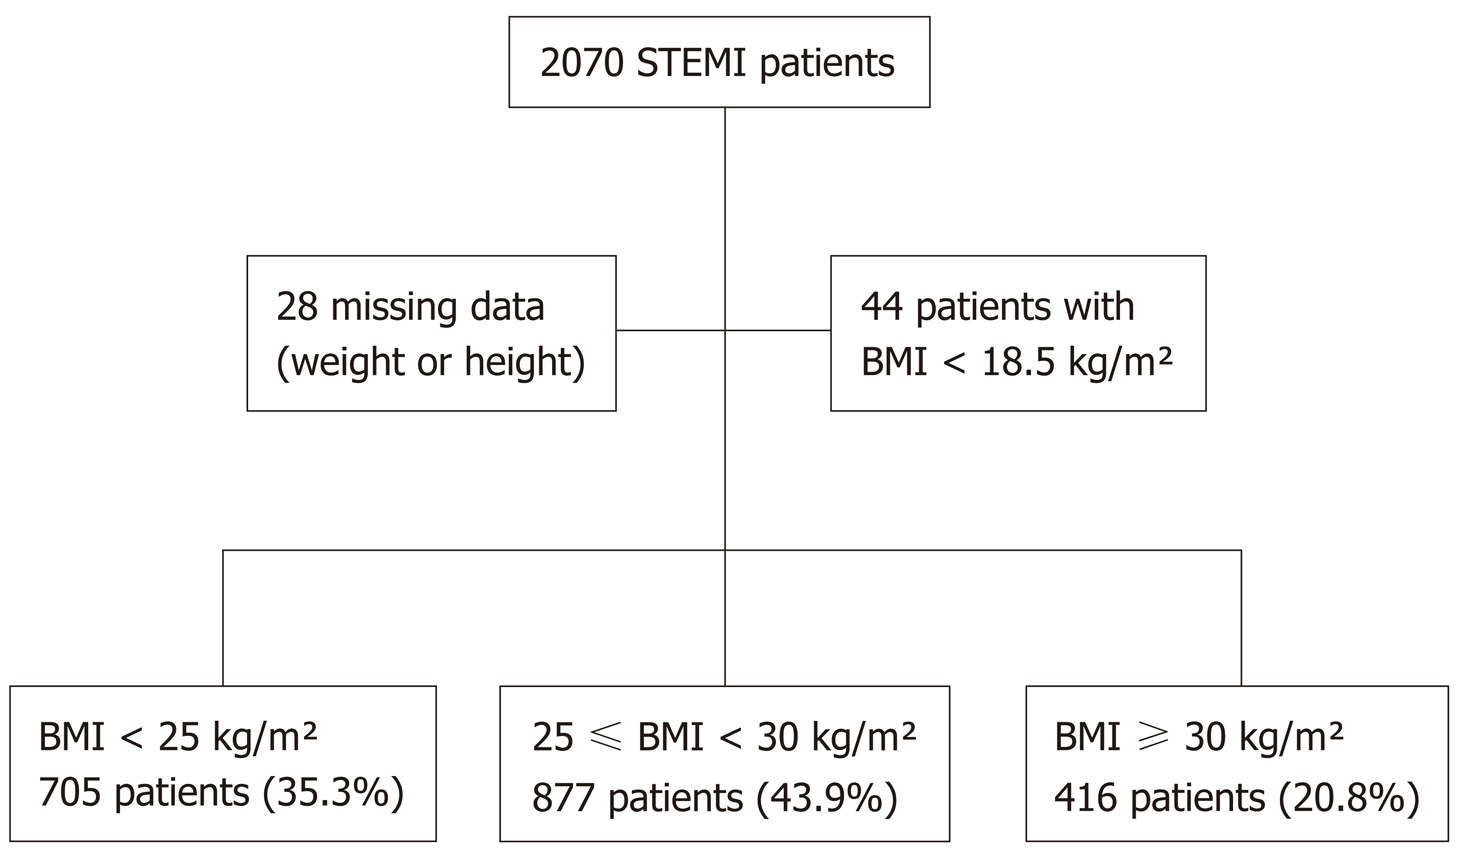
Figure 1 Flow chart.
BMI: Body mass index; STEMI: ST elevation myocardial infarction.
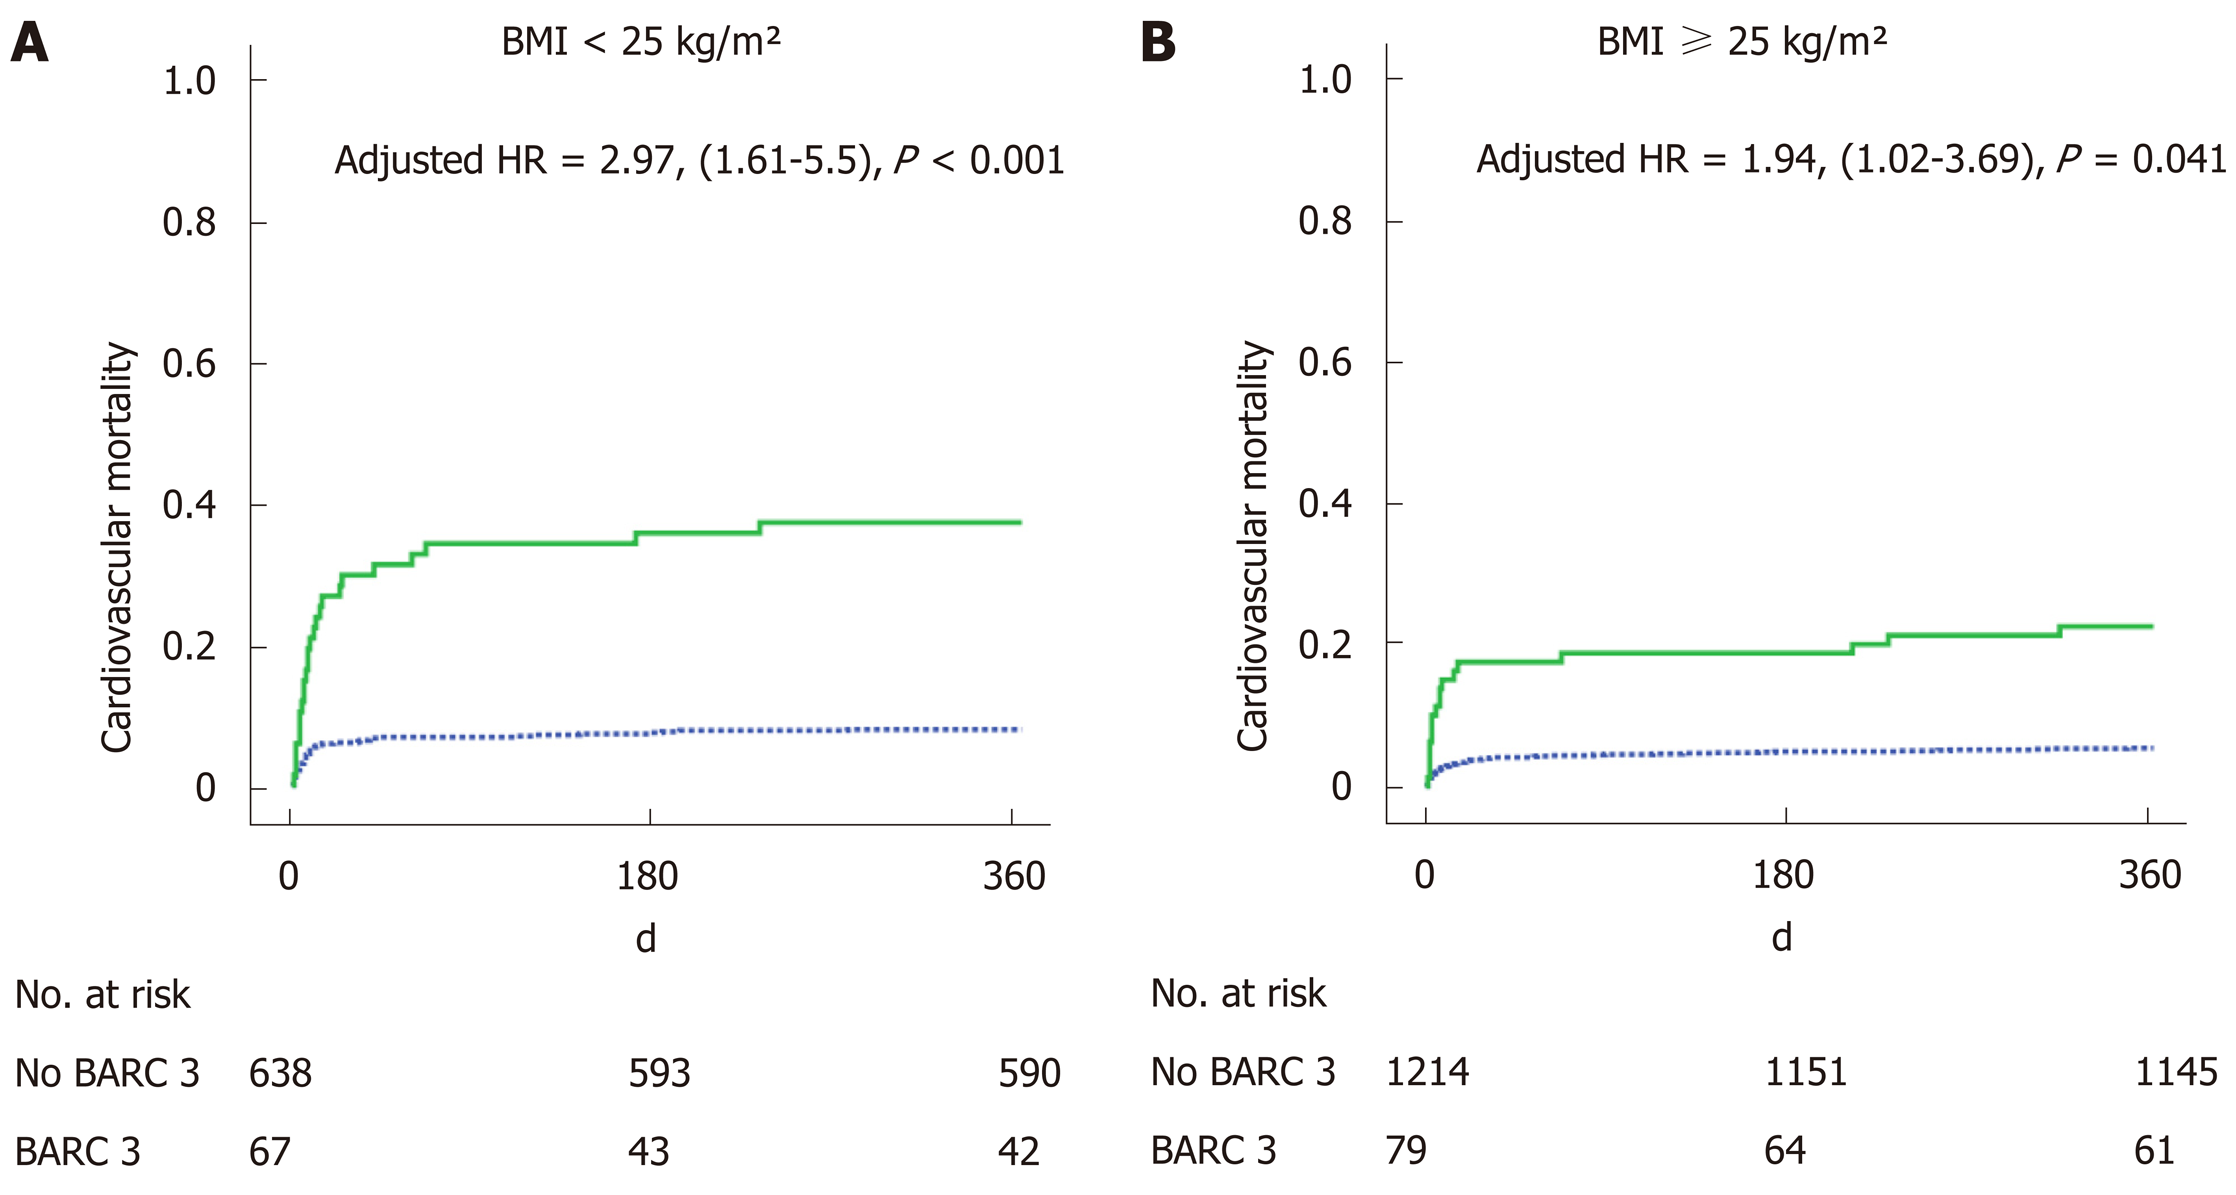
Figure 2 Time-to-event curves for the primary end-point.
A: Occurrence of 1-year cardiovascular mortality according to Bleeding Academic Research Consortium (BARC) 3 in body mass index (BMI) < 25 kg/m² patients; B: Occurrence of 1-year cardiovascular mortality according to BARC 3 in BMI ≥ 25 kg/m² patients. BARC: Bleeding Academic Research Consortium; BMI: Body mass index; HR: Hazard ratio.
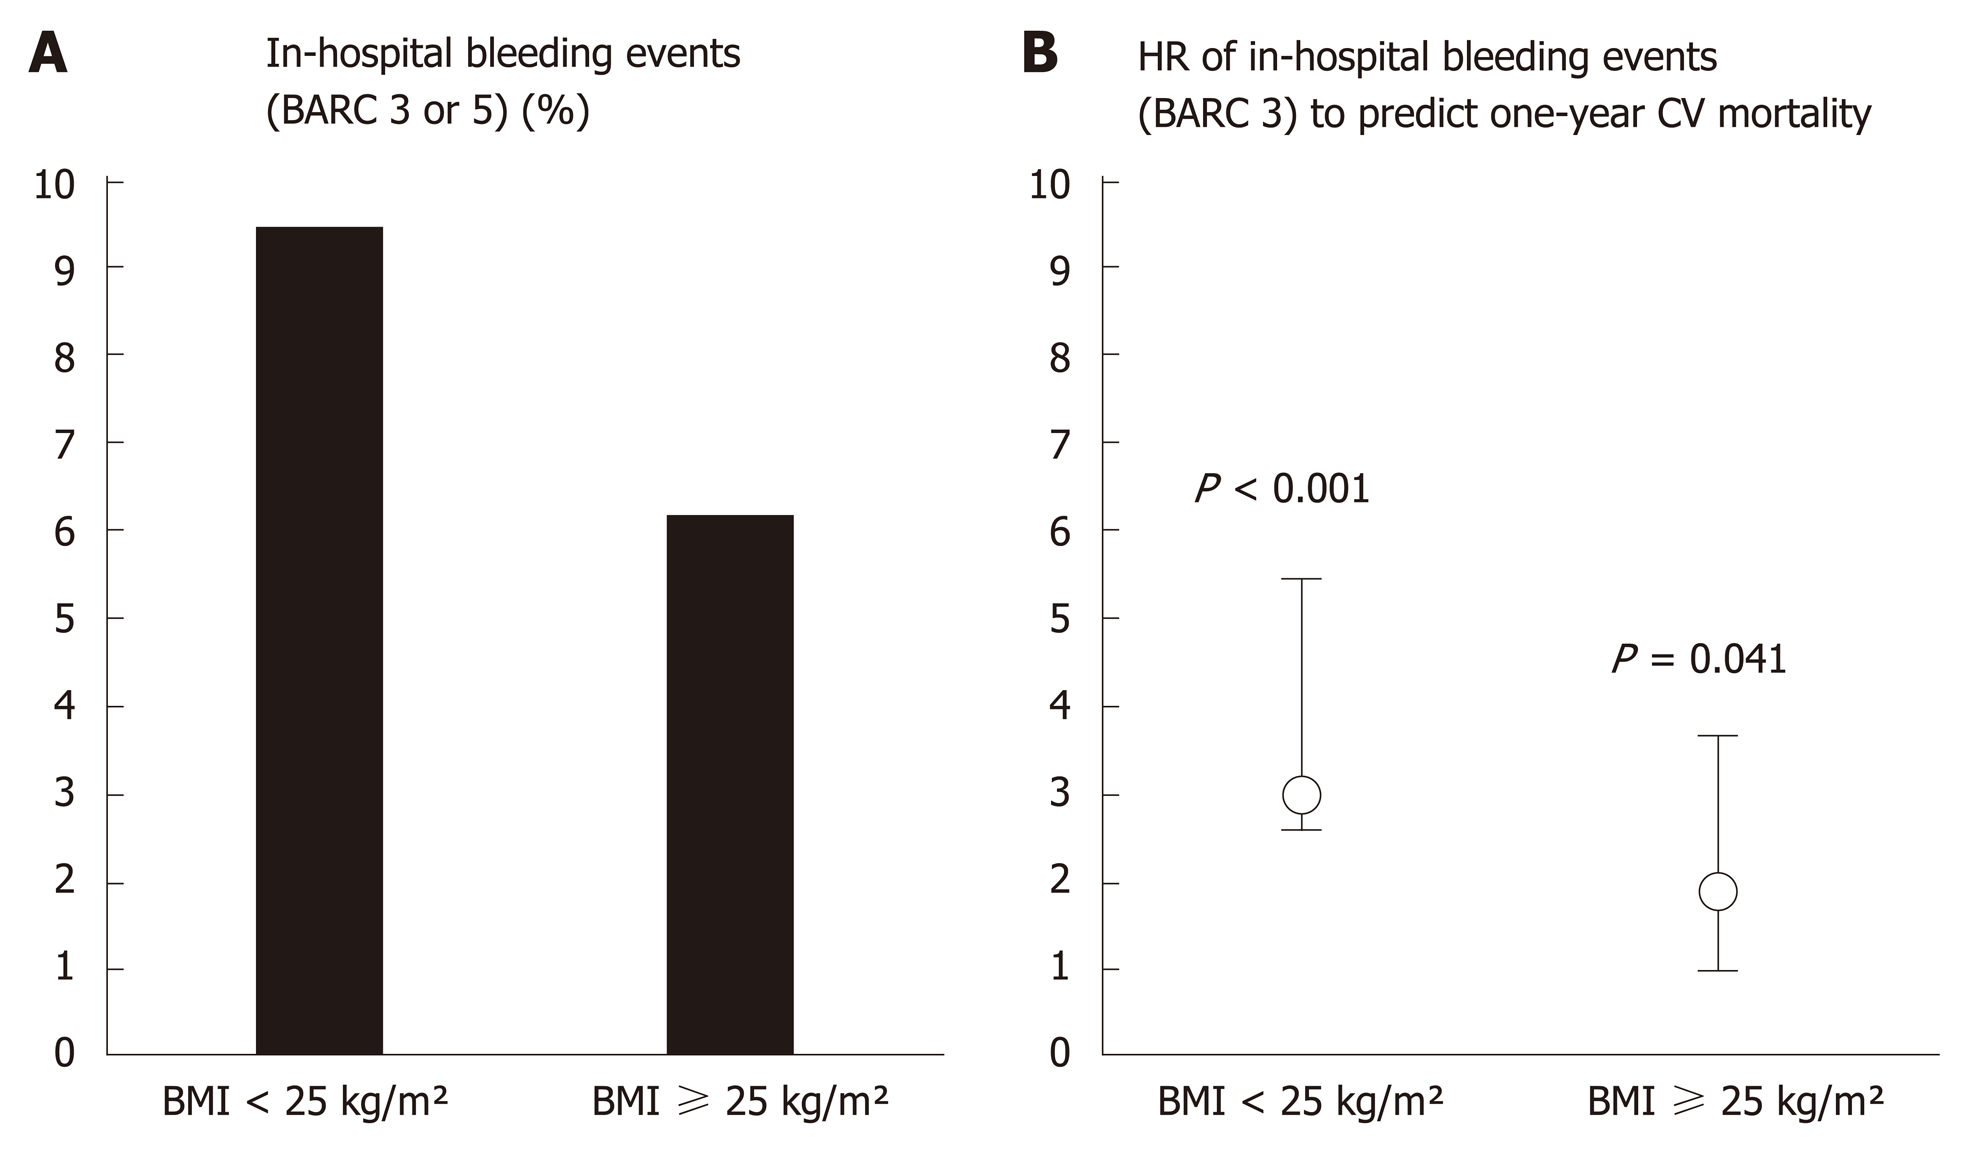
Figure 3 Bleeding events and prognosis.
A: In-hospital bleeding events [Bleeding Academic Research Consortium (BARC) 3 or 5] prevalence; B: Hazard ratios (HR) of in-hospital bleeding event (BARC 3) to predict one-year cardiovascular mortality. P values for HR in each body mass index subgroup. BARC: Bleeding Academic Research Consortium; BMI: Body mass index; CV: Cardiovascular; HR: Hazard ratio.
- Citation: Ingremeau D, Grall S, Valliet F, Desprets L, Prunier F, Furber A, Bière L. Prognostic impact of body mass index on in-hospital bleeding complications after ST-segment elevation myocardial infarction. World J Cardiol 2020; 12(1): 44-54
- URL: https://www.wjgnet.com/1949-8462/full/v12/i1/44.htm
- DOI: https://dx.doi.org/10.4330/wjc.v12.i1.44


