Copyright
©The Author(s) 2019.
World J Cardiol. Mar 26, 2019; 11(3): 120-125
Published online Mar 26, 2019. doi: 10.4330/wjc.v11.i3.120
Published online Mar 26, 2019. doi: 10.4330/wjc.v11.i3.120
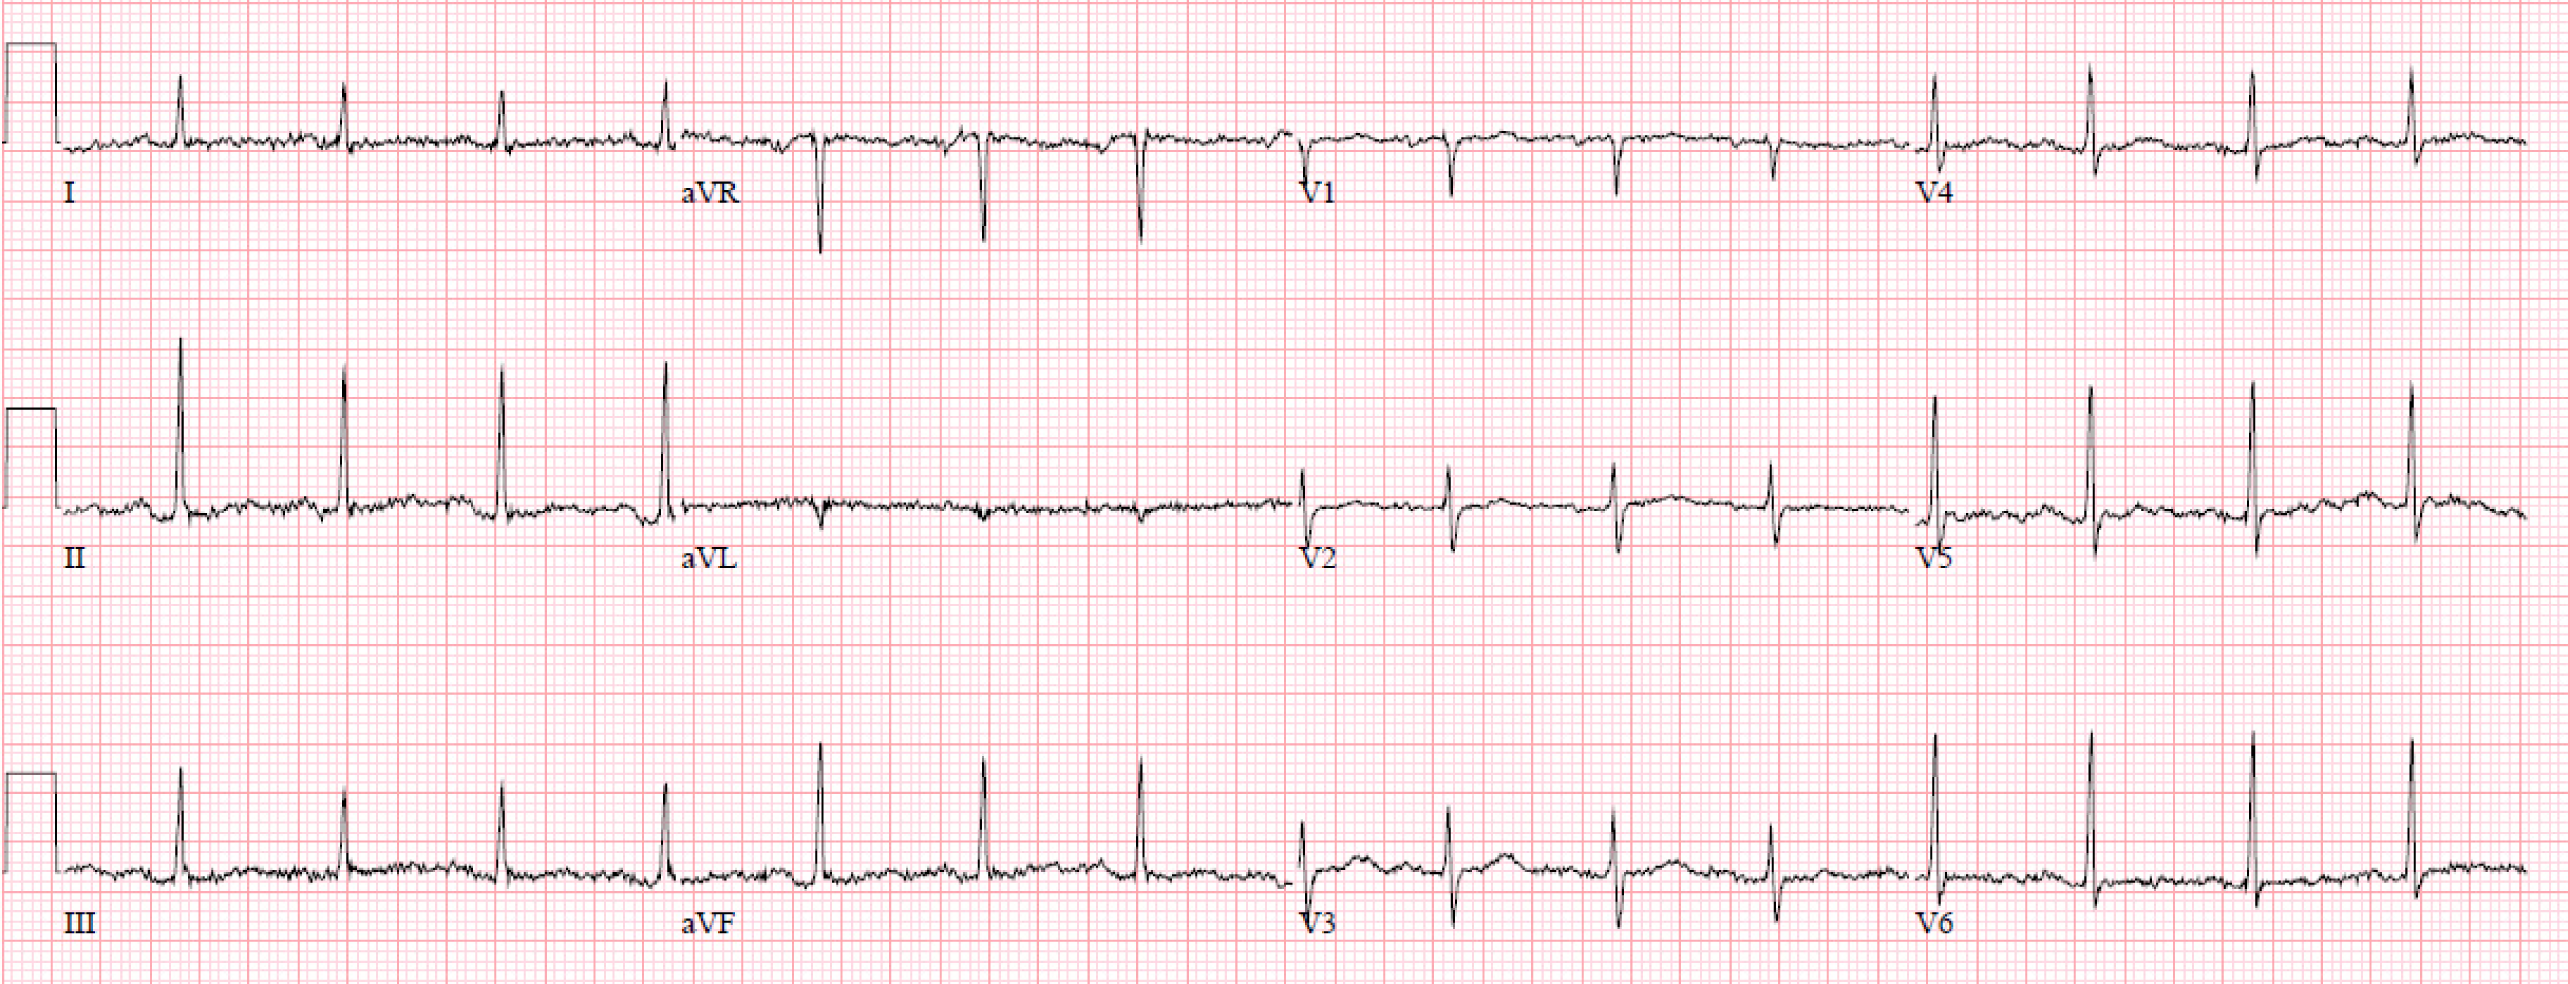
Figure 1 Electrocardiogram 12 wk before initial presentation.
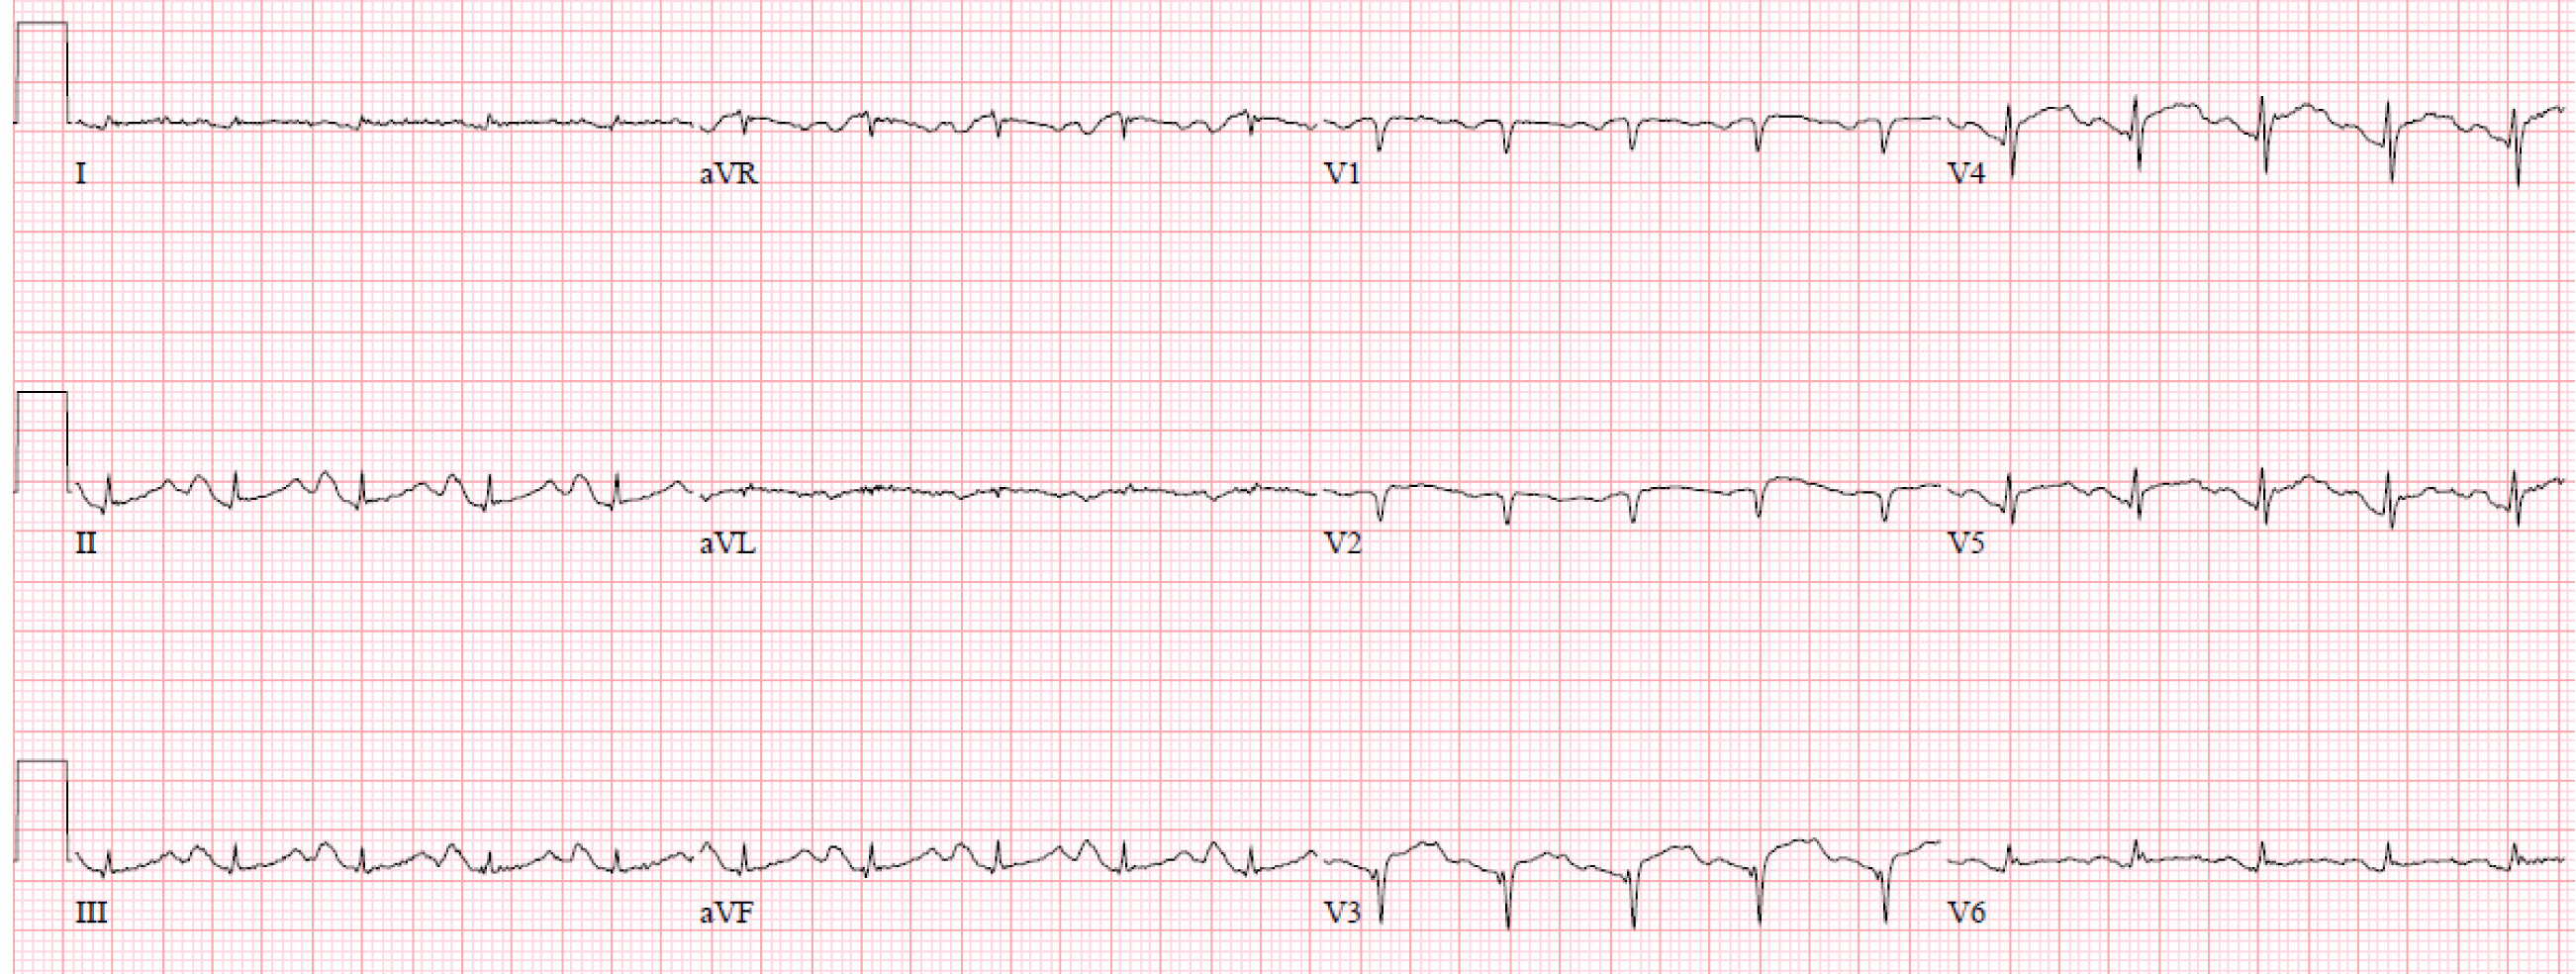
Figure 2 Electrocardiogram with acute changes on initial presentation.
Significant attenuation of amplitude of QRS complexes noted diffusely.
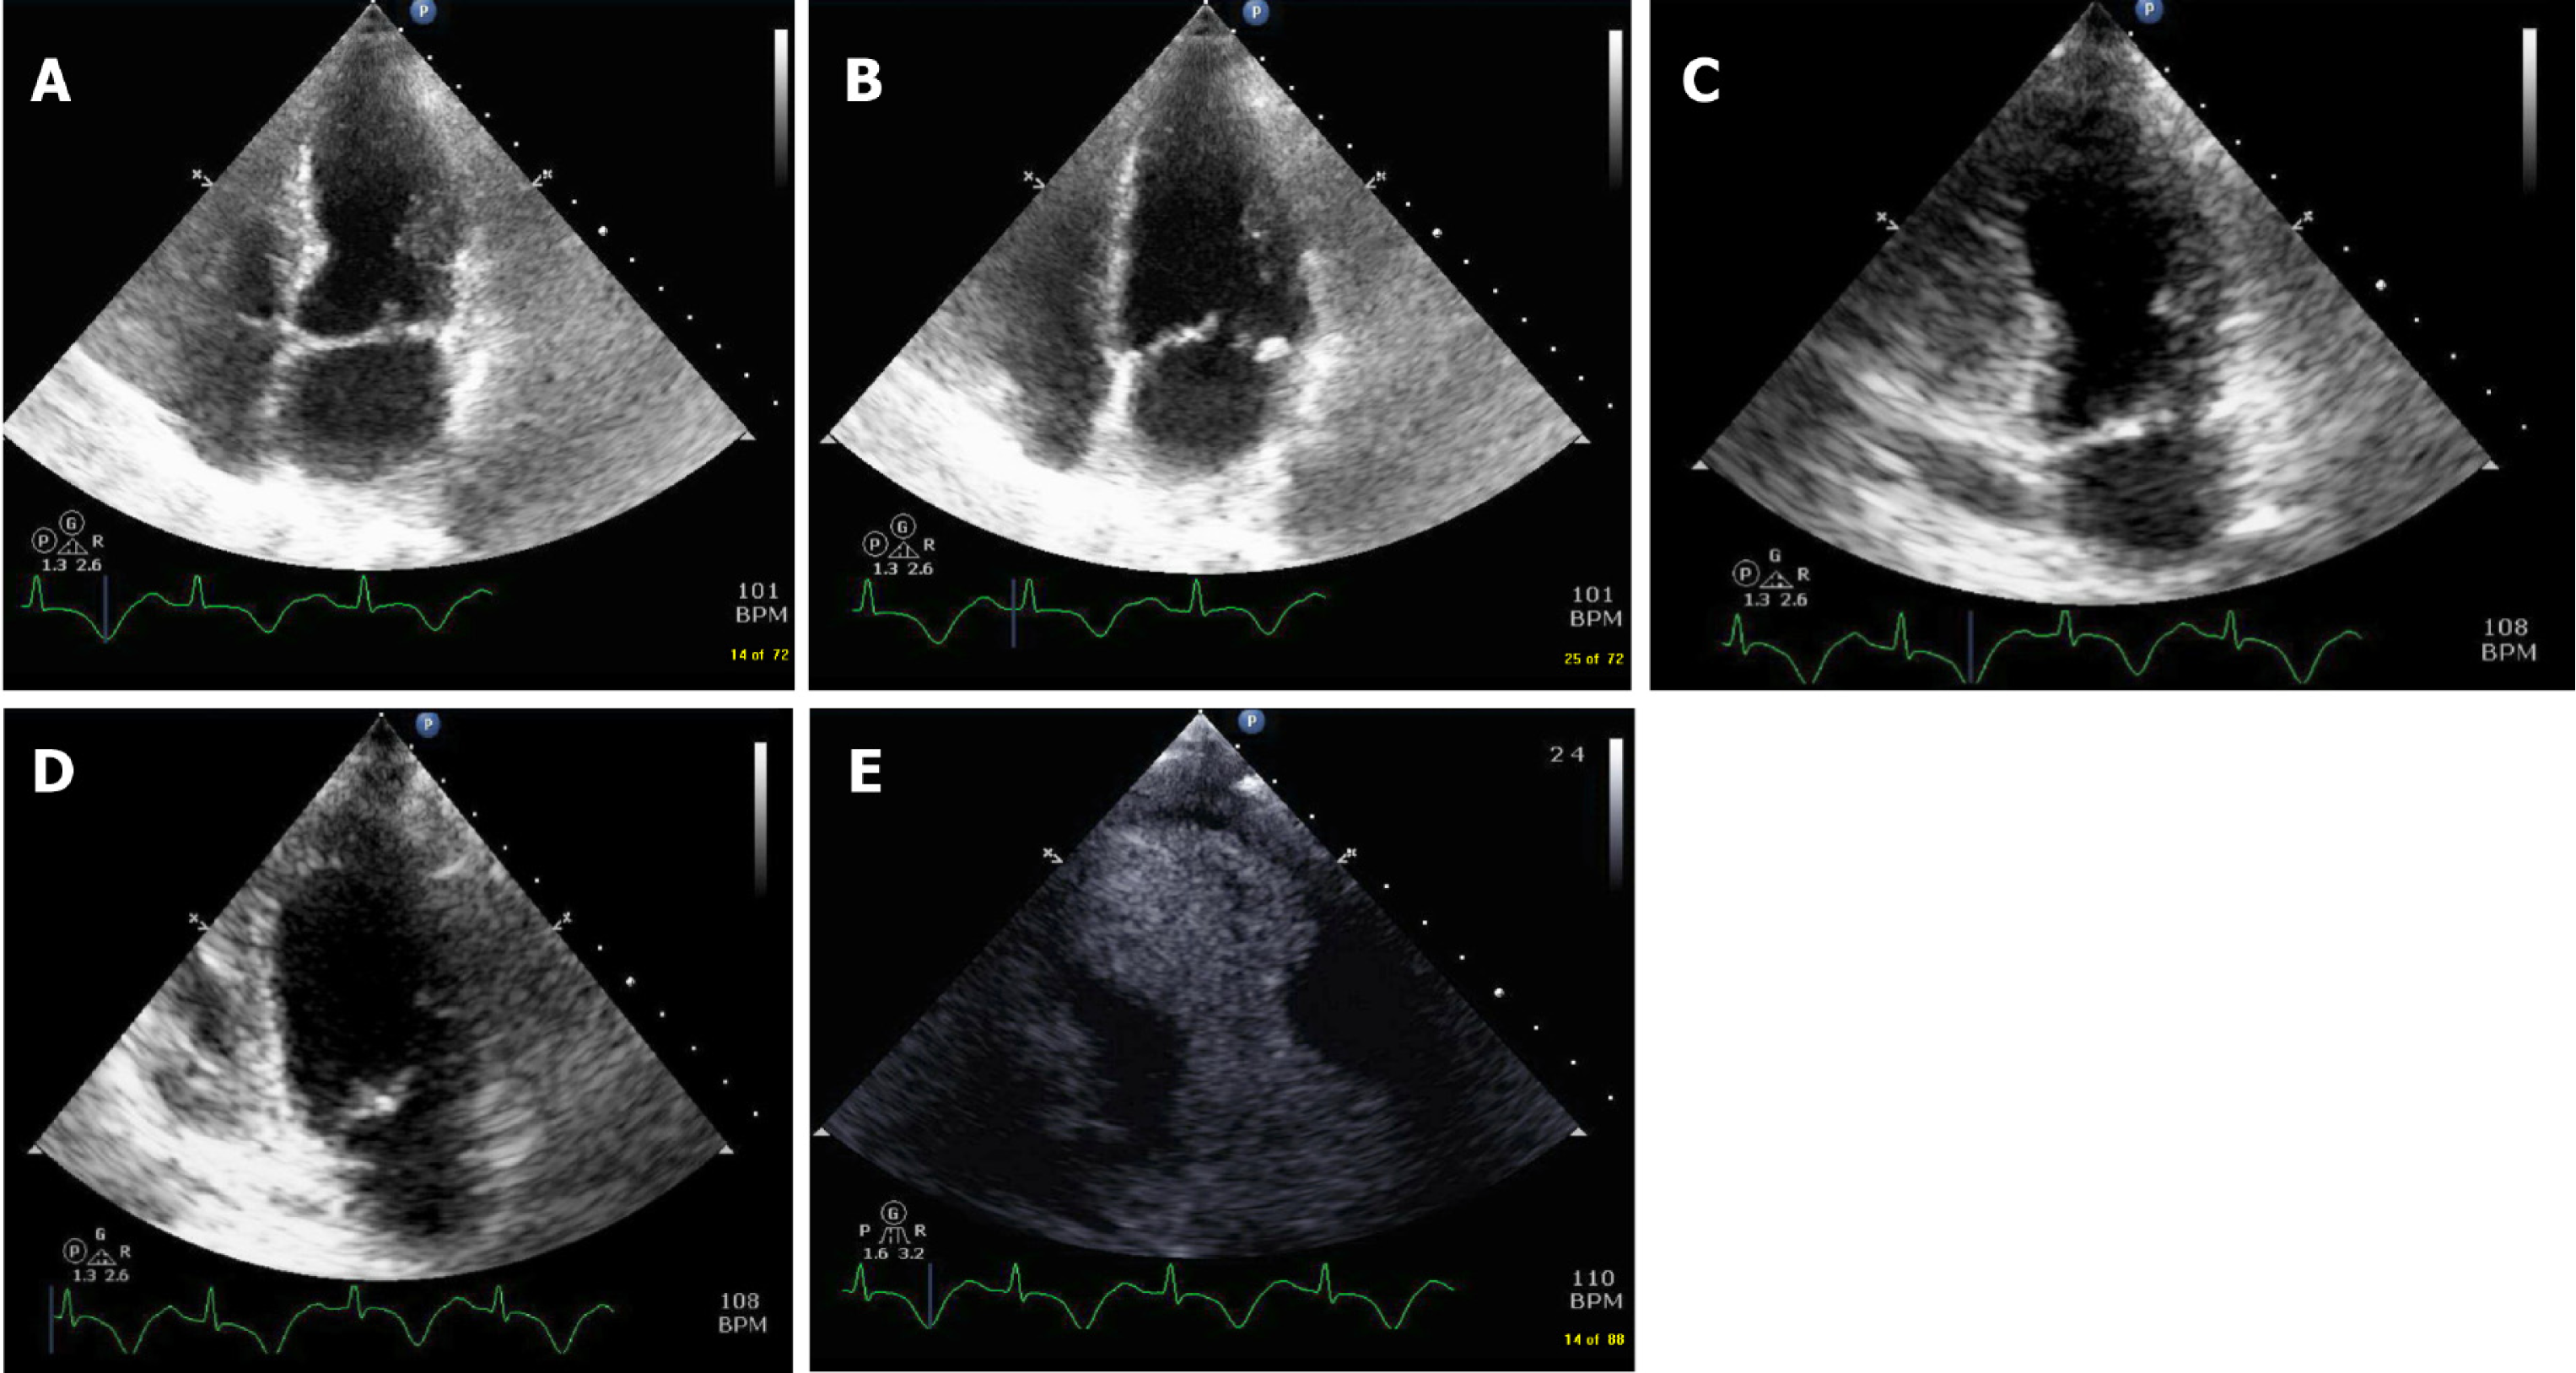
Figure 3 Four and 2 chamber view.
A: 4 chamber view demonstrating akinesis of the septal and lateral apical segments; B: 4 chamber view demonstrating akinesis of the septal and lateral apical segments; C: 2-chamber view showing akinesis of anterior-inferior apical segments during systole; D: 2-chamber view showing akinesis of anterior and inferior apical segments during diastole; E: Contrast echocardiography showing akinesis of anterior and inferior apical segments.
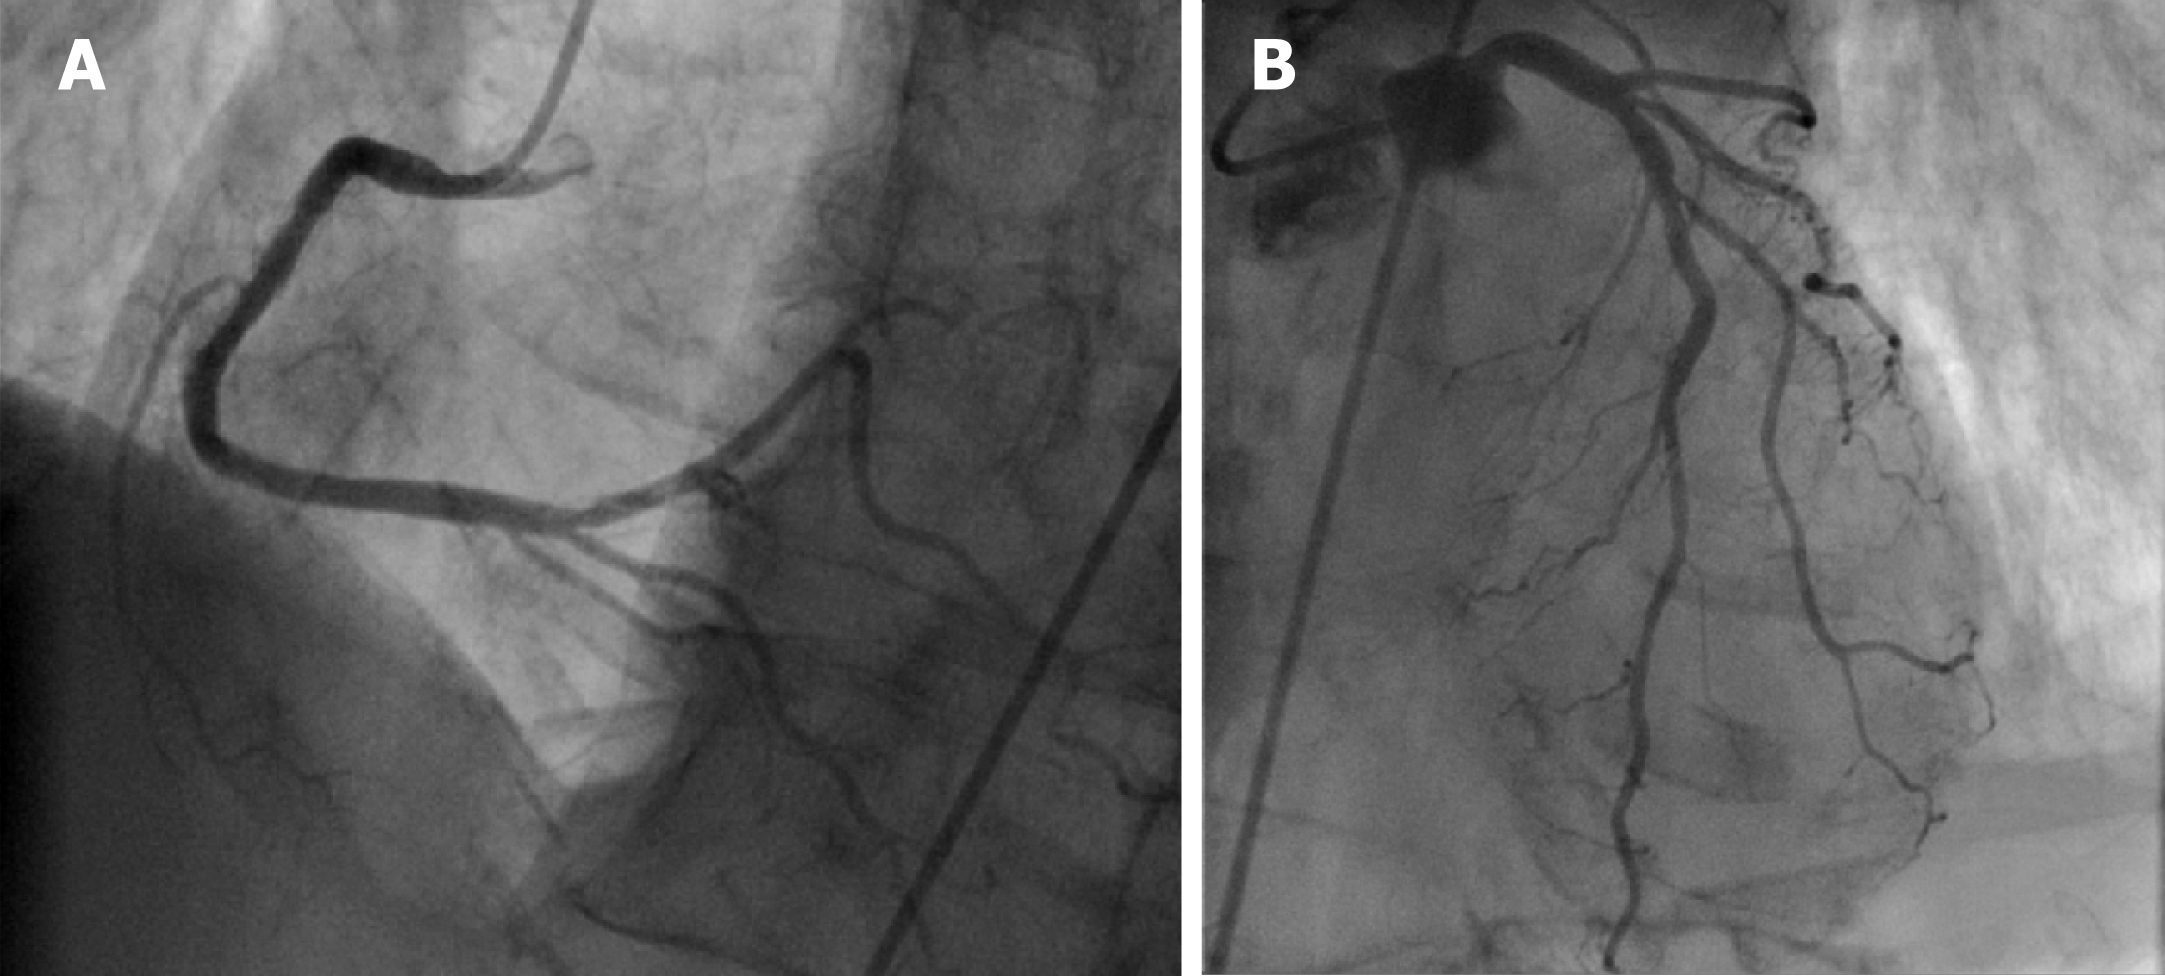
Figure 4 Coronary angiography of right coronary artery and left system demonstrating non obstructive coronary artery disease.
A: Coronary angiography of right coronary artery demonstrating non obstructive coronary artery disease; B: Coronary angiography of the left system demonstrating non obstructive coronary artery disease.
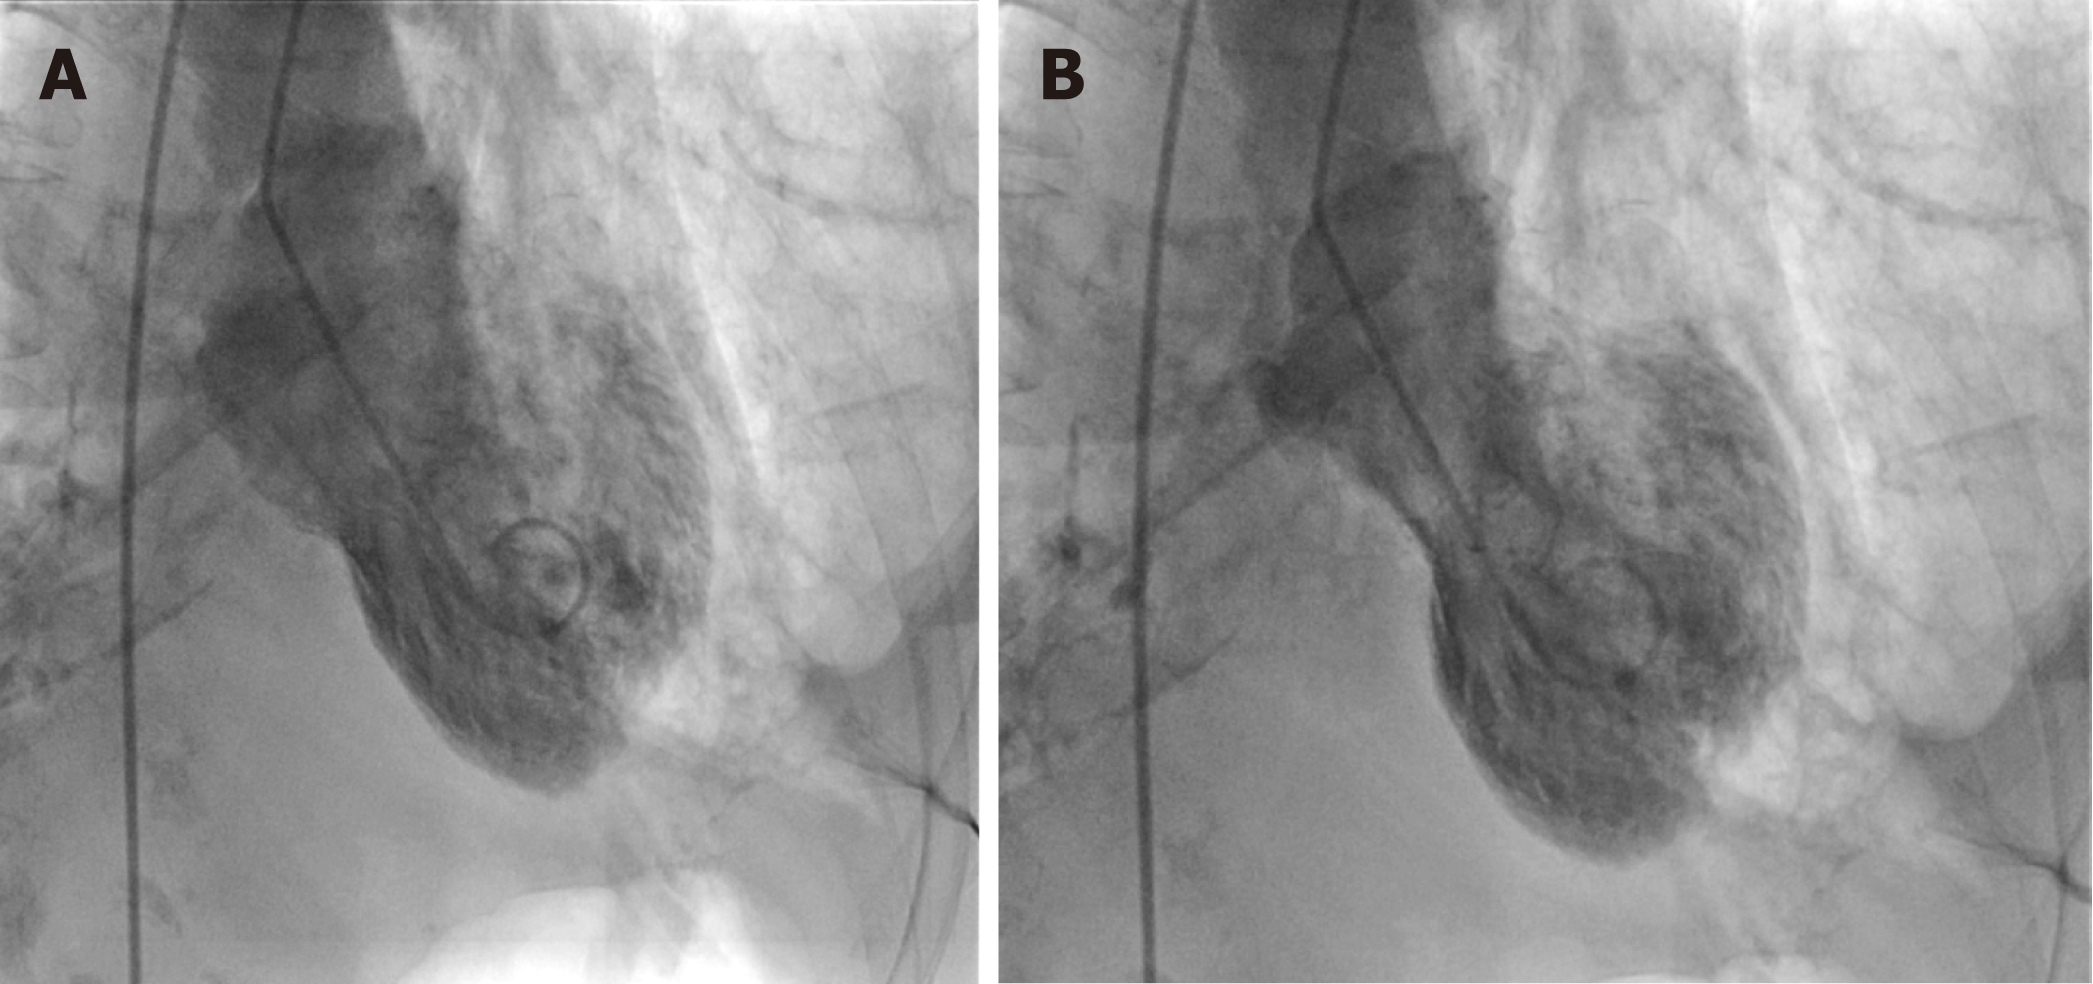
Figure 5 Left ventriculography demonstrating hyperkinetic basal segments and akinetic apex during diastole and systole.
A: Left ventriculography demonstrating hyperkinetic basal segments and akinetic apex during diastole; B: Left ventriculogram demonstrating hyperkinetic basal segments and akinetic apex during systole.
- Citation: Khan M, Watti H, Dahal K, Dominic P. Utility of recognizing early electrocardiogram changes in bronchogenic Takotsubo cardiomyopathy: A case report. World J Cardiol 2019; 11(3): 120-125
- URL: https://www.wjgnet.com/1949-8462/full/v11/i3/120.htm
- DOI: https://dx.doi.org/10.4330/wjc.v11.i3.120


