Copyright
©The Author(s) 2018.
World J Cardiol. Jul 26, 2018; 10(7): 52-59
Published online Jul 26, 2018. doi: 10.4330/wjc.v10.i7.52
Published online Jul 26, 2018. doi: 10.4330/wjc.v10.i7.52
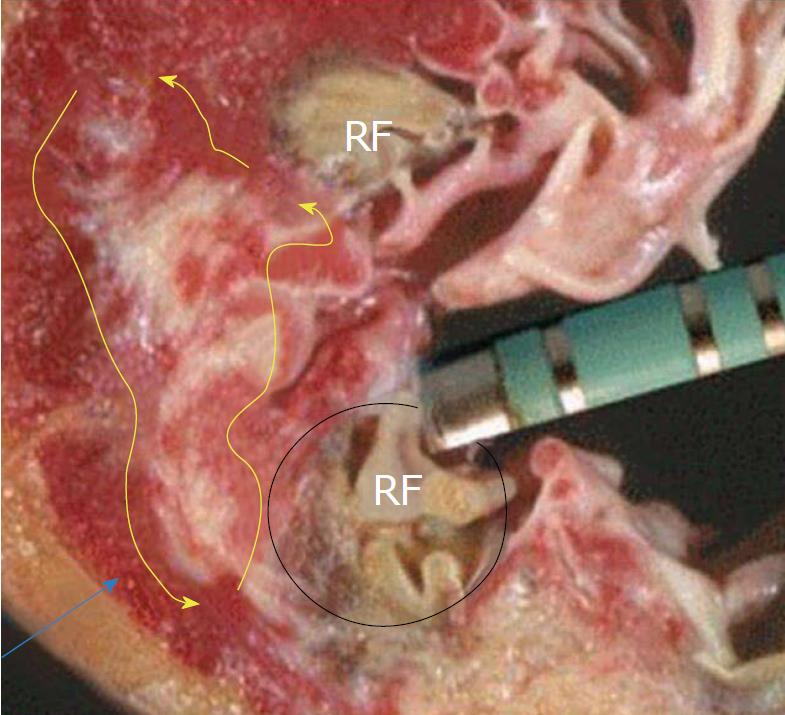
Figure 1 Arrhythmia substrate is deep (blue arrow), but the radiofrequency ablation lesions are not that deep.
RF: Radiofrequency.
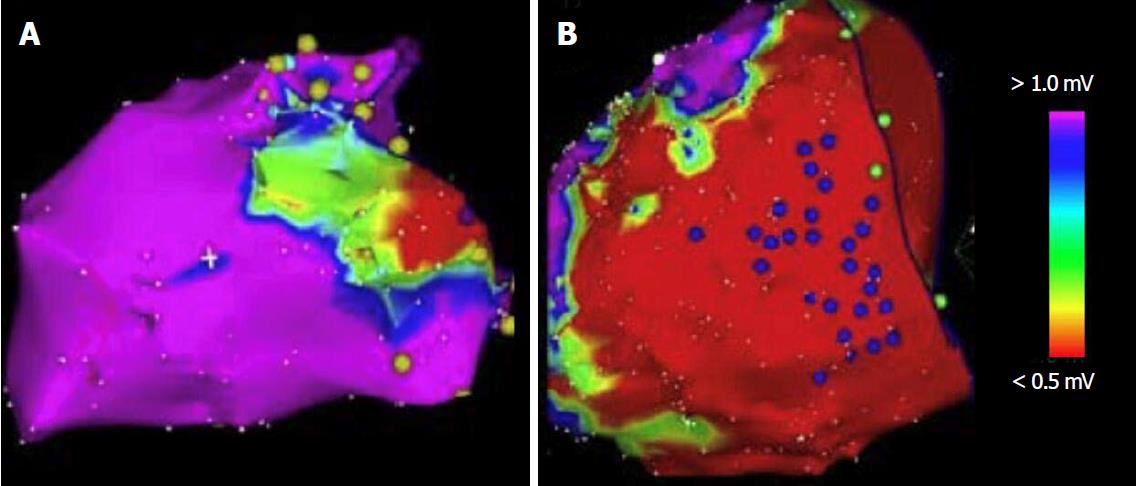
Figure 2 Endocardial and epicardial voltage mapping.
A: The voltage map of the endocardium shows an area of scar. The map is color-coded to represent bipolar electro-gram voltage (red: Dense scar, 0.5 mV; purple: Normal tissue, 1.5 mV, intervening colors represent voltage values in between); B: The voltage map of the epicardium shows a larger area of scar.
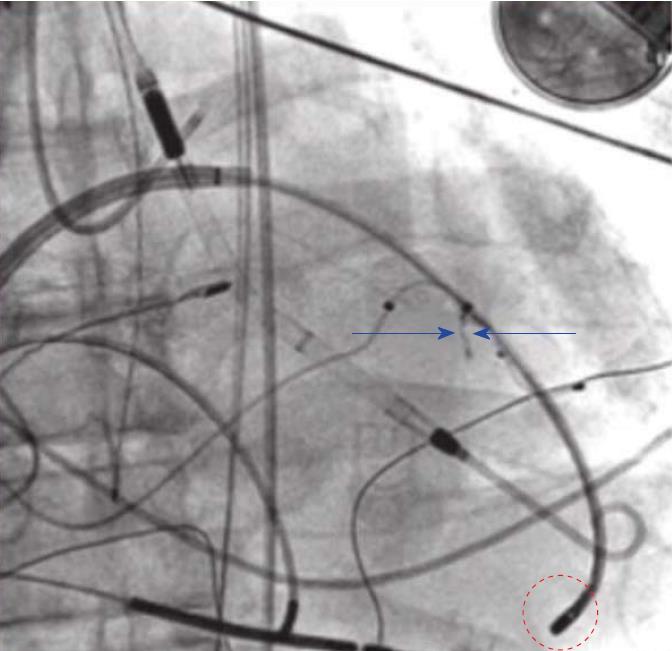
Figure 3 Transcoronary alcohol ablation.
Coronary angiography of the left anterior descending artery shows a septal perforator with a course to the site of earliest activity. A balloon catheter occludes this branch and ethanol is infused (blue arrows). The ablation catheter is placed at the region of earliest activity (red circle).
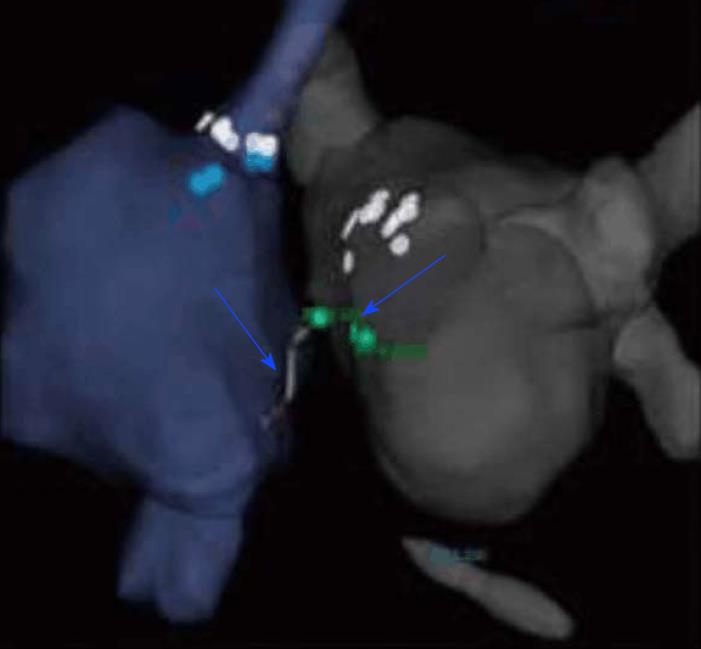
Figure 4 Bipolar ablation.
Bipolar radiofrequency ablation between the right and left ventricular septum using two catheters.
- Citation: Spartalis M, Spartalis E, Tzatzaki E, Tsilimigras DI, Moris D, Kontogiannis C, Livanis E, Iliopoulos DC, Voudris V, Theodorakis GN. Novel approaches for the treatment of ventricular tachycardia. World J Cardiol 2018; 10(7): 52-59
- URL: https://www.wjgnet.com/1949-8462/full/v10/i7/52.htm
- DOI: https://dx.doi.org/10.4330/wjc.v10.i7.52


