Copyright
©The Author(s) 2018.
World J Cardiol. Apr 26, 2018; 10(4): 26-34
Published online Apr 26, 2018. doi: 10.4330/wjc.v10.i4.26
Published online Apr 26, 2018. doi: 10.4330/wjc.v10.i4.26
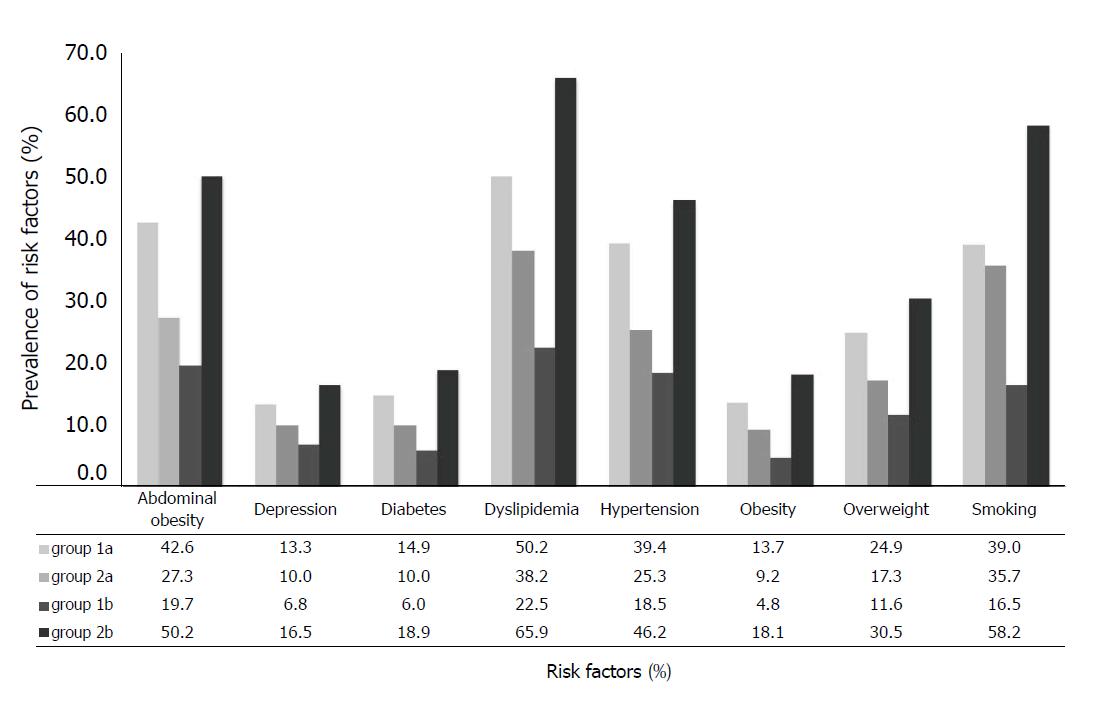
Figure 1 Distribution of the risk factors by the physical fitness level.
From left to right for each risk factor: the first column (very clear gray) represents the group 1a (normal physical fitness), the second column (light gray) represents the group 2a (poor physical fitness), the third column (dark gray) represents the group 1b (highest physical fitness) and the fourth column (black) represents the group 2b (lowest physical fitness).
- Citation: Caru M, Kern L, Bousquet M, Curnier D. Preventive fraction of physical fitness on risk factors in cardiac patients: Retrospective epidemiological study. World J Cardiol 2018; 10(4): 26-34
- URL: https://www.wjgnet.com/1949-8462/full/v10/i4/26.htm
- DOI: https://dx.doi.org/10.4330/wjc.v10.i4.26


