Copyright
©The Author(s) 2016.
World J Biol Chem. Feb 26, 2016; 7(1): 138-145
Published online Feb 26, 2016. doi: 10.4331/wjbc.v7.i1.138
Published online Feb 26, 2016. doi: 10.4331/wjbc.v7.i1.138
Figure 1 Neuronal growth in trigeminal subnucleus caudalis, spinal dorsal horn and hippocampus cultures.
Examples of images were recorded at day 14 after plating. Vc: Trigeminal subnucleus caudalis; SDH: Spinal dorsal horn; Hip: Hippocampus.
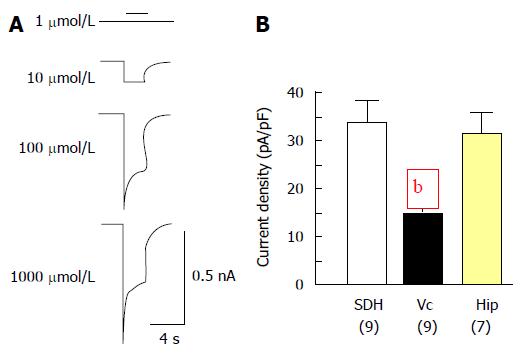
Figure 2 Whole-cell responses mediated by glutamate.
A: Examples of current traces recorded in Vc neurons. The currents were evoked with glutamate at concentrations as indicated; B: Summary data (mean ± SEM) of peak current density evoked with 1000 μmol/L of glutamate respectively from Vc, SDH and Hip neurons. Values in brackets indicate number of neurons tested. bP < 0.01, independent t-test, indicate significant differences detected in Vc vs that in SDH or Hip neurons. Vc: Trigeminal subnucleus caudalis; SDH: Spinal dorsal horn; Hip: Hippocampus.
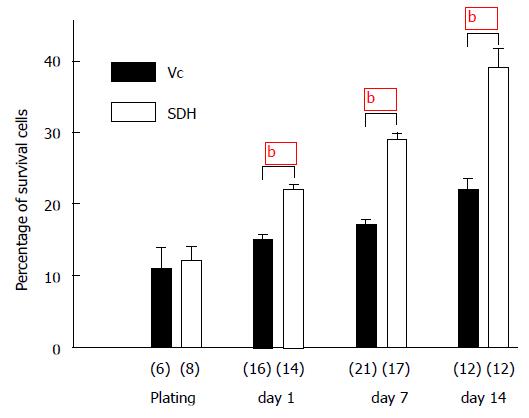
Figure 3 Cell viability in in trigeminal subnucleus caudalis and spinal dorsal horn cultures.
Bars show the percentage values (mean ± SEM) of live cells in Vc and SDH cells detected during and after plating as indicated. bP < 0.01 (independent t-test) when compared with that in SDH cultures. Numbers in brackets indicate the number of dishes tested. Vc: Trigeminal subnucleus caudalis; SDH: Spinal dorsal horn; Hip: Hippocampus.
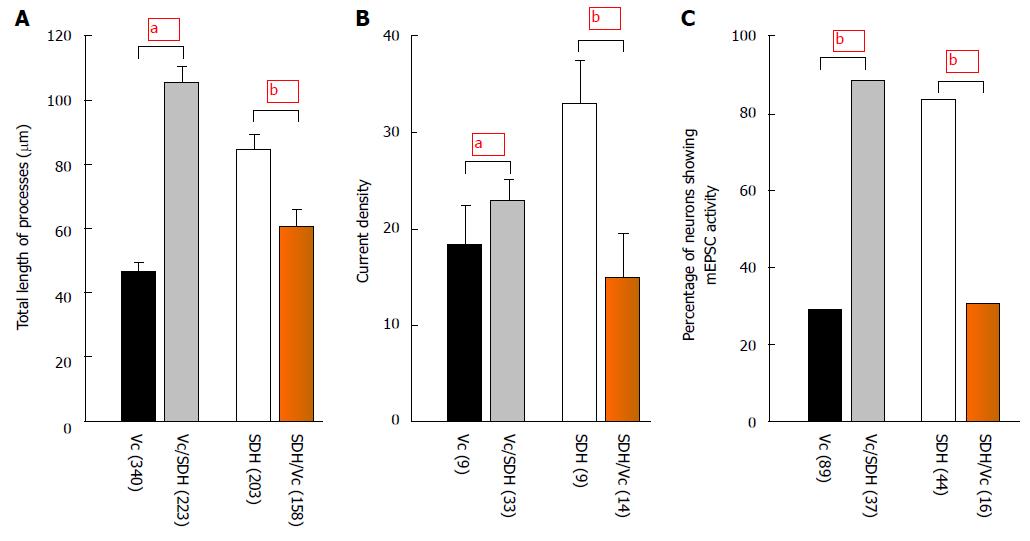
Figure 4 Effects of co-culture.
The bar graph shows summary data (mean ± SEM) of the total length of processes at day 7 after plating (A), current density (B) and occurrence of mEPSC activity (C) recorded at day 14 after plating. Vc/SDH: Vc cells co-cultured with SDH; SDH/Vc: SDH cells co-cultured with Vc; aP < 0.05, bP < 0.01 (independent t-test in A and B, Fisher’s exact test in C) when compared with those in co-cultures. Numbers in brackets indicate the number of neurons tested. Vc: Trigeminal subnucleus caudalis; SDH: Spinal dorsal horn. mEPSC: Miniature excitatory post-synaptic current.
- Citation: Xie YF, Jiang XH, Sessle BJ, Yu XM. Development of regional specificity of spinal and medullary dorsal horn neurons. World J Biol Chem 2016; 7(1): 138-145
- URL: https://www.wjgnet.com/1949-8454/full/v7/i1/138.htm
- DOI: https://dx.doi.org/10.4331/wjbc.v7.i1.138


