Copyright
©The Author(s) 2017.
World J Gastrointest Surg. Dec 27, 2017; 9(12): 256-263
Published online Dec 27, 2017. doi: 10.4240/wjgs.v9.i12.256
Published online Dec 27, 2017. doi: 10.4240/wjgs.v9.i12.256
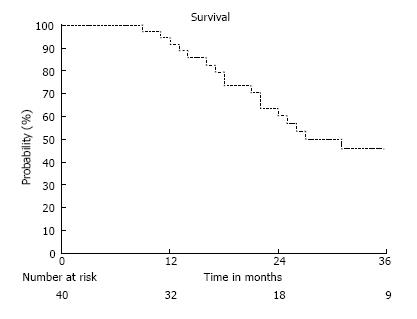
Figure 1 Overall Survival of all patients.
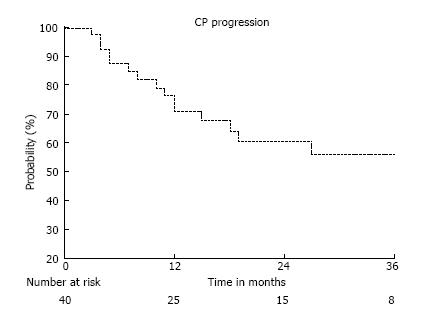
Figure 2 Freedom from child Pugh Progression of all patients.
CP progression: Percentage of patients retaining child Pugh A status.
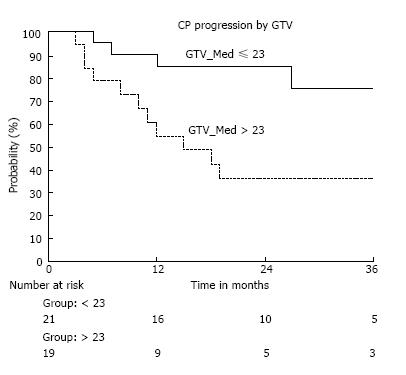
Figure 3 Freedom from child Pugh progression by gross tumor volume.
CP progression: Percentage of patients retaining child Pugh A status; GTV: Gross tumor volume in cubic centimeters; Group ≤ 23: Number of patients with a GTV less than or equal to 23 cc; Group > 23: Number of patients with a GTV greater than 23 cc.
- Citation: Hasan S, Thai N, Uemura T, Kudithipudi V, Renz P, Abel S, Kirichenko AV. Hepatocellular carcinoma with child Pugh-A Cirrhosis treated with stereotactic body radiotherapy. World J Gastrointest Surg 2017; 9(12): 256-263
- URL: https://www.wjgnet.com/1948-9366/full/v9/i12/256.htm
- DOI: https://dx.doi.org/10.4240/wjgs.v9.i12.256


