Copyright
©The Author(s) 2016.
World J Gastrointest Surg. Apr 27, 2016; 8(4): 335-344
Published online Apr 27, 2016. doi: 10.4240/wjgs.v8.i4.335
Published online Apr 27, 2016. doi: 10.4240/wjgs.v8.i4.335
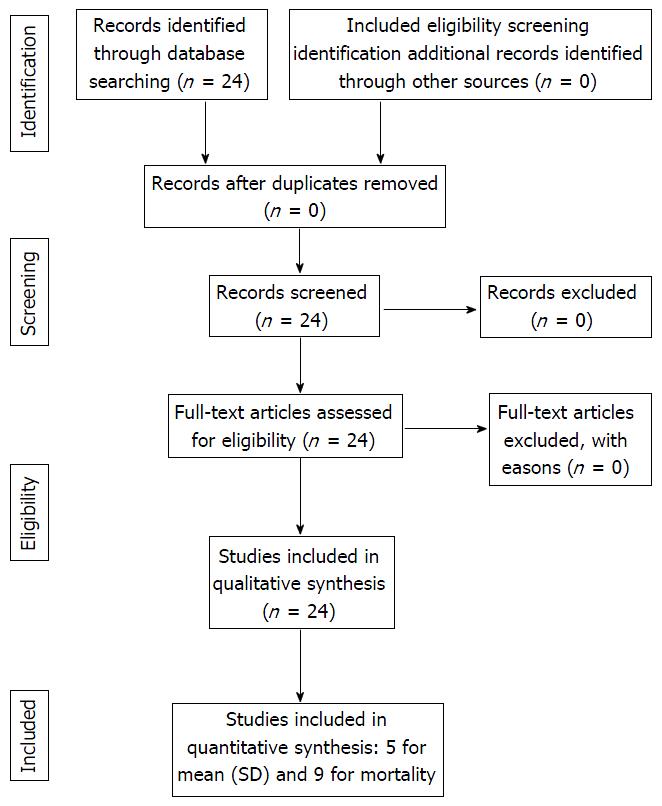
Figure 1 PRISMA flow chart.
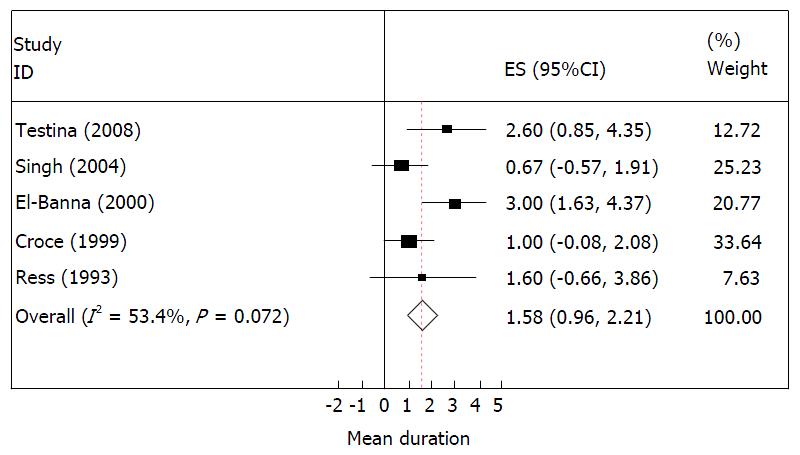
Figure 2 Forest plot of duration to detect injury (days).
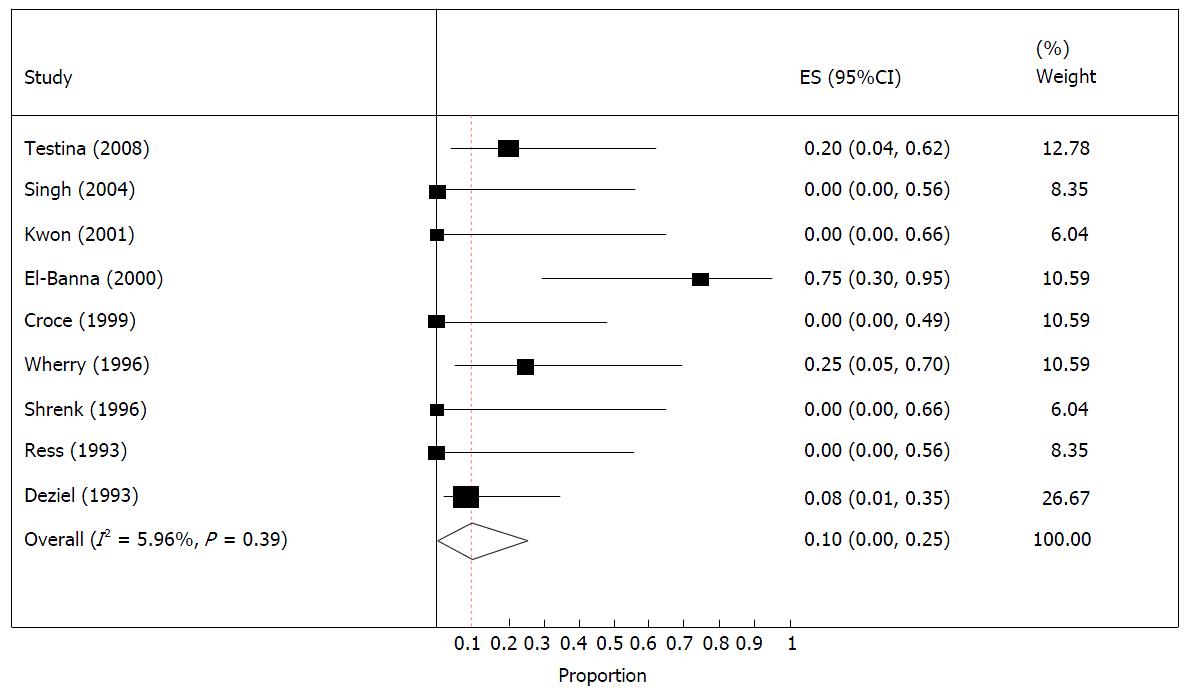
Figure 3 Forest plot of injury related mortality.
Figure 4 Survival function for injury.
- Citation: Machado NO. Duodenal injury post laparoscopic cholecystectomy: Incidence, mechanism, management and outcome. World J Gastrointest Surg 2016; 8(4): 335-344
- URL: https://www.wjgnet.com/1948-9366/full/v8/i4/335.htm
- DOI: https://dx.doi.org/10.4240/wjgs.v8.i4.335


