Copyright
©2014 Baishideng Publishing Group Inc.
World J Gastrointest Surg. Nov 27, 2014; 6(11): 229-234
Published online Nov 27, 2014. doi: 10.4240/wjgs.v6.i11.229
Published online Nov 27, 2014. doi: 10.4240/wjgs.v6.i11.229
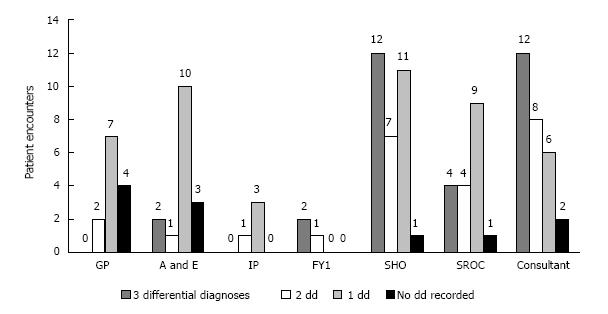
Figure 1 Number of differential diagnoses listed by each doctor grade per patient encounter.
Referring physicians (GP, A and E, and IP) rarely recorded more than one differential diagnosis. Among the surgical team, three differential diagnoses were listed most frequently, with the exception of SROC. GP: General practitioner; IP: In-patient referrer; FY1: Foundation year-1; SHO: Senior house officer; SROC: Surgical registrar on-call.
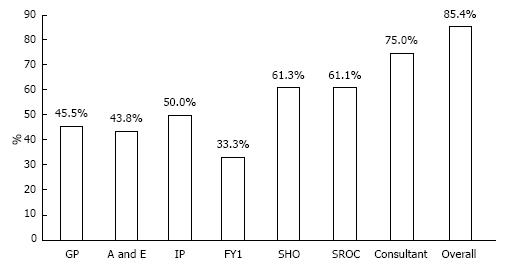
Figure 2 Percentage of patient encounters with a correct diagnosis.
Consultant was most likely to record a correct diagnosis, followed by SHO and SROC. Overall 85.4% of patients received a correct diagnosis along the primary diagnostic pathway. GP: General practitioner; IP: In-patient referrer; FY1: Foundation year-1; SHO: Senior house officer; SROC: Surgical registrar on-call.
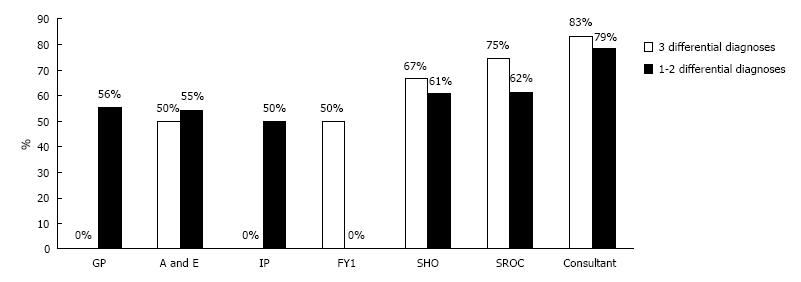
Figure 3 Percentage of correct diagnoses made with 3 differential diagnoses vs 1-2 differential diagnoses.
The use of 3 differential diagnoses among the surgical team (FY1, SHO, SROC, and Consultant) improved diagnostic accuracy by 8.1% (73.3% vs 65.2%). Referring physicians did not follow this trend. GP: General practitioner; IP: In-patient referrer; FY1: Foundation year-1; SHO: Senior house officer; SROC: Surgical registrar on-call.
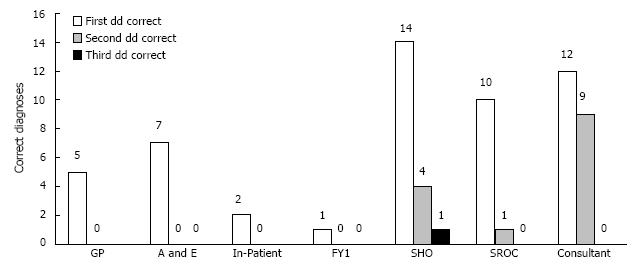
Figure 4 Differential ranking of correct diagnoses by each doctor grade.
The correct diagnosis was the first differential listed in most cases for all doctors. Consultant made the correct diagnosis with the second differential diagnosis more than any other group (42.9%), followed by SHO (21.1%) and SROC (9.1%). The correct diagnosis was made with the third differential diagnosis only once, by SHO. (3.1% of 32 times three differentials were listed). GP: General practitioner; FY1: Foundation year-1; SHO: Senior house officer; SROC: Surgical registrar on-call.
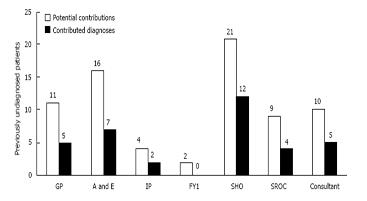
Figure 5 Potential contributions and contributed diagnoses made by each doctor grade.
Potential contributions are encounters with patients that had not received a correct diagnosis from a previous physician. SHO contributed the most correct diagnoses and had the highest percent contribution (57.1%) of any group. GP: General practitioner; IP: In-patient referrer; FY1: Foundation year-1; SHO: Senior house officer; SROC: Surgical registrar on-call.
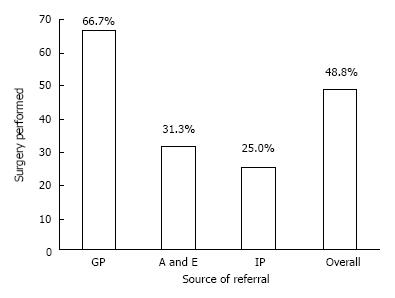
Figure 6 Percentage of patients receiving surgery or other invasive diagnostic procedure by source of referral.
GP referrals were more than twice as likely to undergo surgery than patients referred from A and E (OR 4.40, CI: 1.09-17.72, P = 0.04). However, due to the small number of in-patient referrals, significance was not reached for GP vs In-Patient referrals (P = 0.15). IP: In-patient referrer; GP: General practitioner.
- Citation: Sajid MS, Hollingsworth T, McGlue M, Miles WF. Factors influencing the diagnostic accuracy and management in acute surgical patients. World J Gastrointest Surg 2014; 6(11): 229-234
- URL: https://www.wjgnet.com/1948-9366/full/v6/i11/229.htm
- DOI: https://dx.doi.org/10.4240/wjgs.v6.i11.229


