
















Copyright: ©Author(s) 2026.
World J Gastrointest Surg. Nov 27, 2026; 18(11): 122614
Published online Nov 27, 2026. doi: 10.4240/wjgs.122614
Published online Nov 27, 2026. doi: 10.4240/wjgs.122614
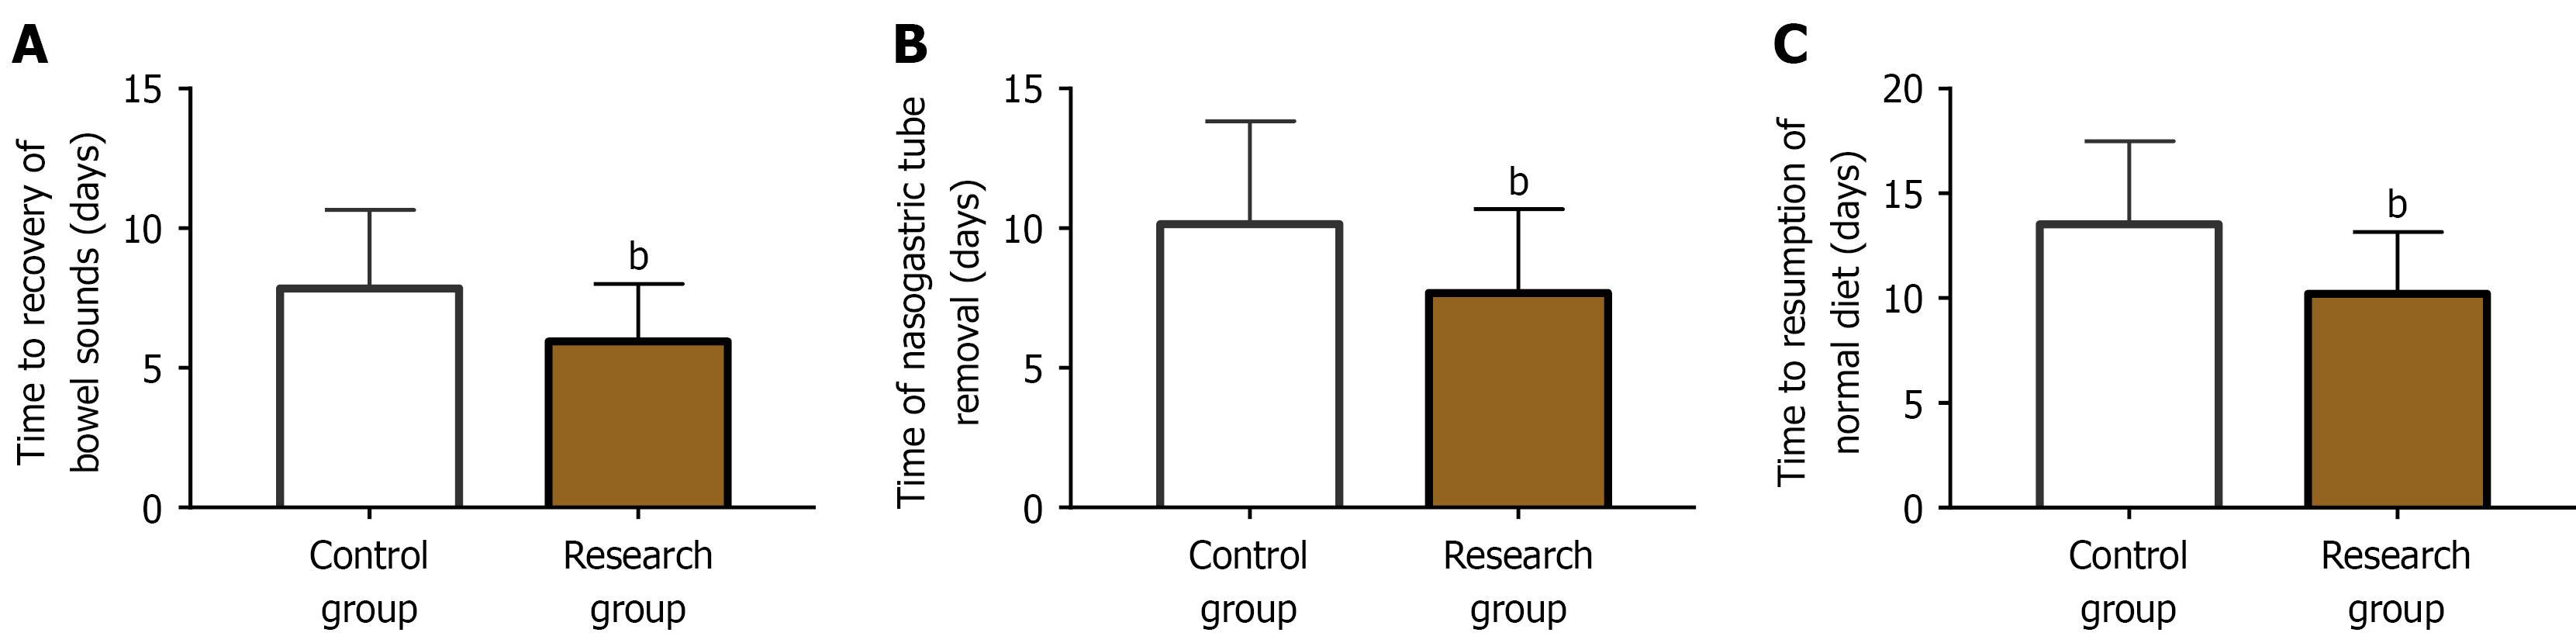
Figure 1 Recovery time of gastrointestinal function.
A: Comparison of the time to bowel sound recovery between control and research groups; B: Inter-group comparison of nasogastric tube removal time; C: Inter-group comparison of normal diet resumption time. bP < 0.01 vs control group.
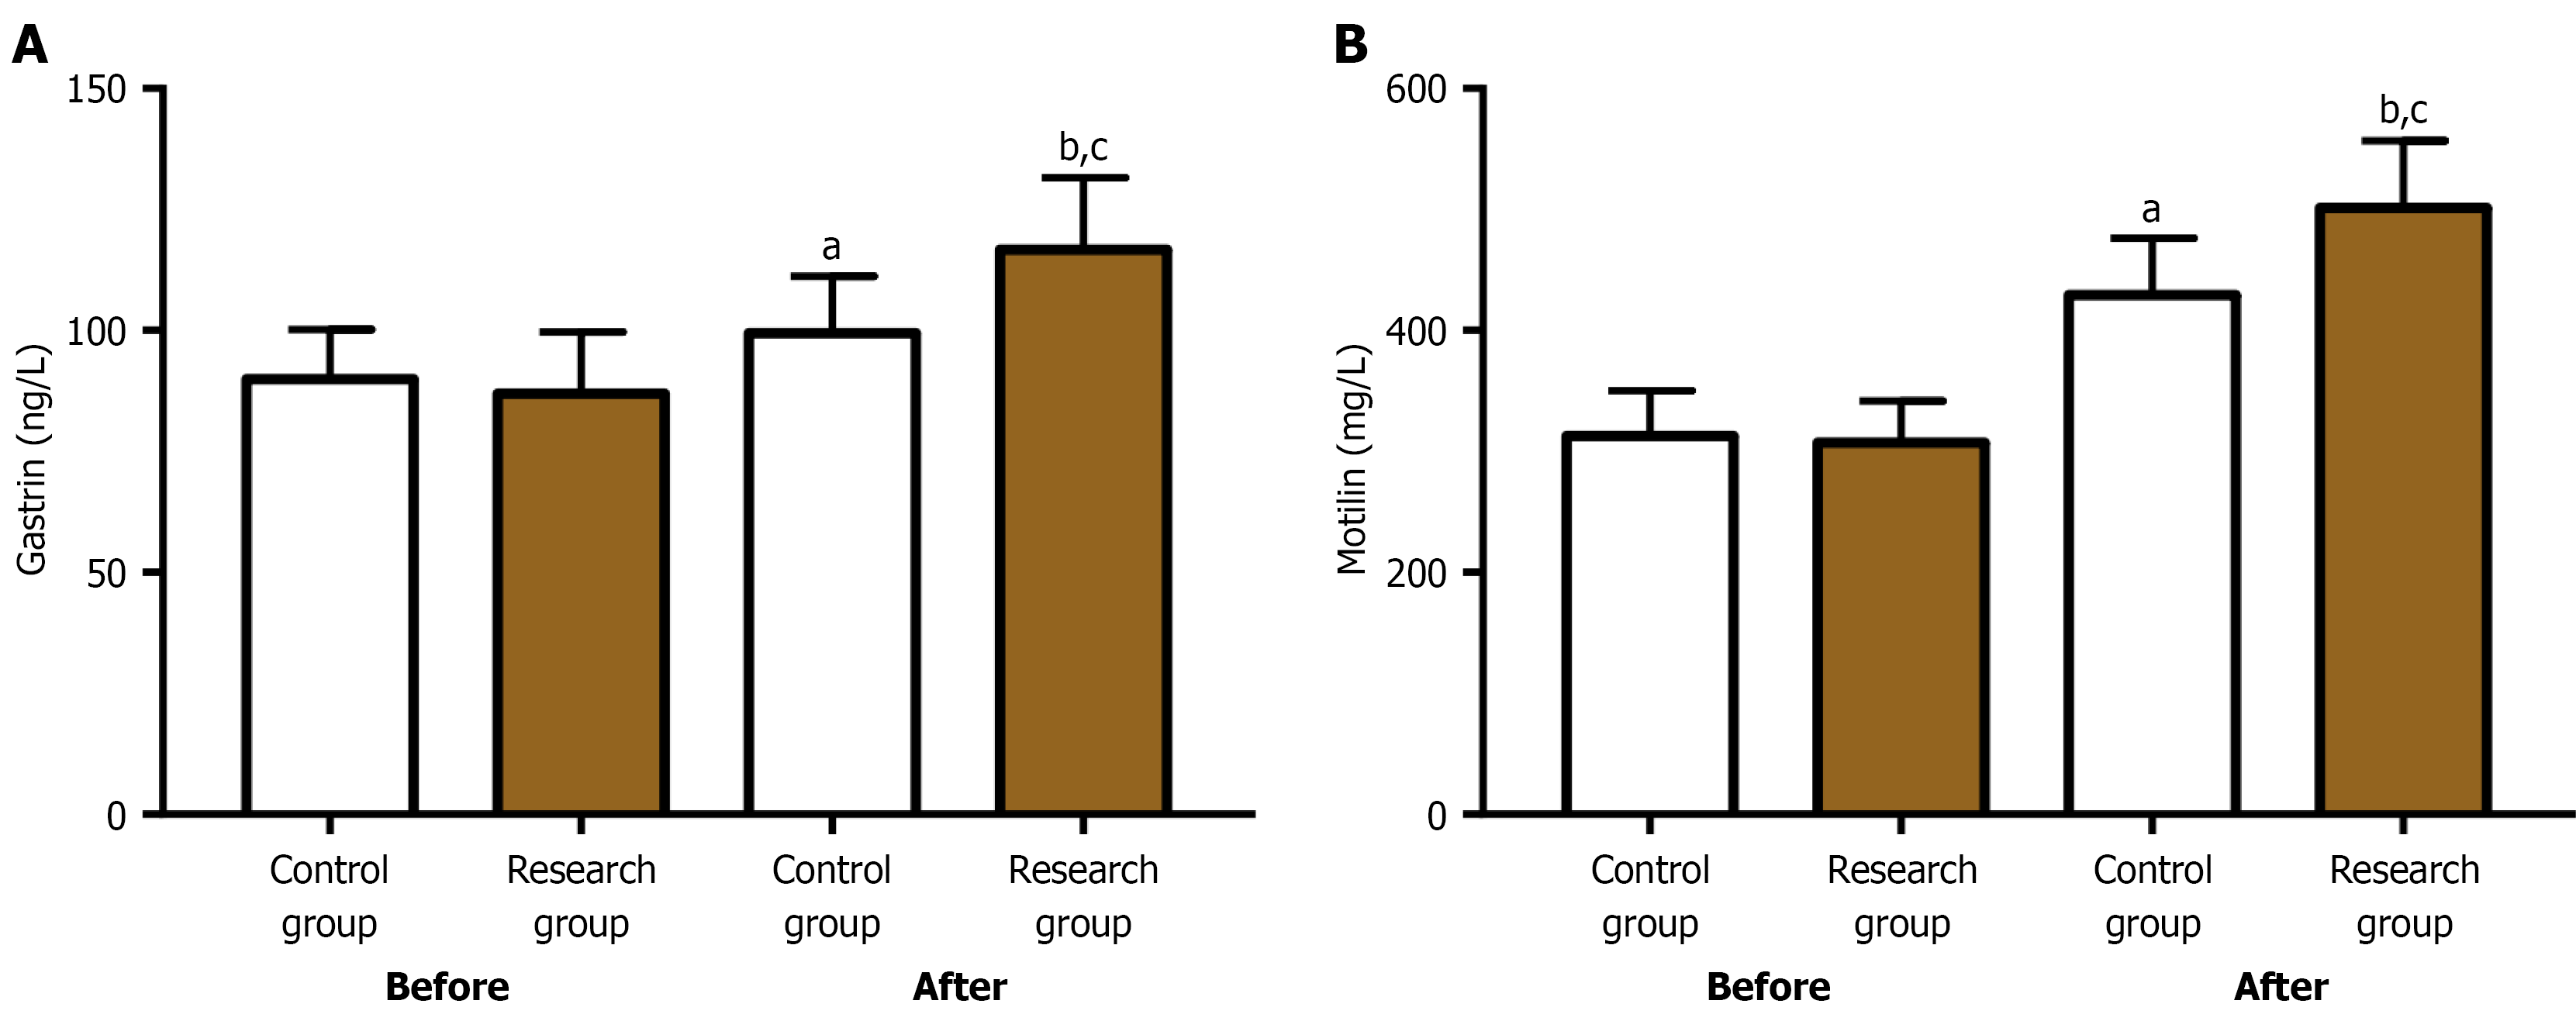
Figure 2 Gastrointestinal function indexes of the two groups.
A: Comparative gastrin assessment; B: Comparative motilin evaluation. aP < 0.05, bP < 0.01 vs the pre-interventional level within the group, cP < 0.05 vs control group at the identical time point.
- Citation: Zhu SL, Gao Q, Liu Y, Cheng KP. Omeprazole-cisapride combination for gastroparesis following radical gastrectomy for gastric cancer: An efficacy and safety analysis. World J Gastrointest Surg 2026; 18(11): 122614
- URL: https://www.wjgnet.com/1948-9366/full/v18/i11/122614.htm
- DOI: https://dx.doi.org/10.4240/wjgs.122614