
















Copyright: ©Author(s) 2026.
World J Gastrointest Surg. Nov 27, 2026; 18(11): 120547
Published online Nov 27, 2026. doi: 10.4240/wjgs.120547
Published online Nov 27, 2026. doi: 10.4240/wjgs.120547
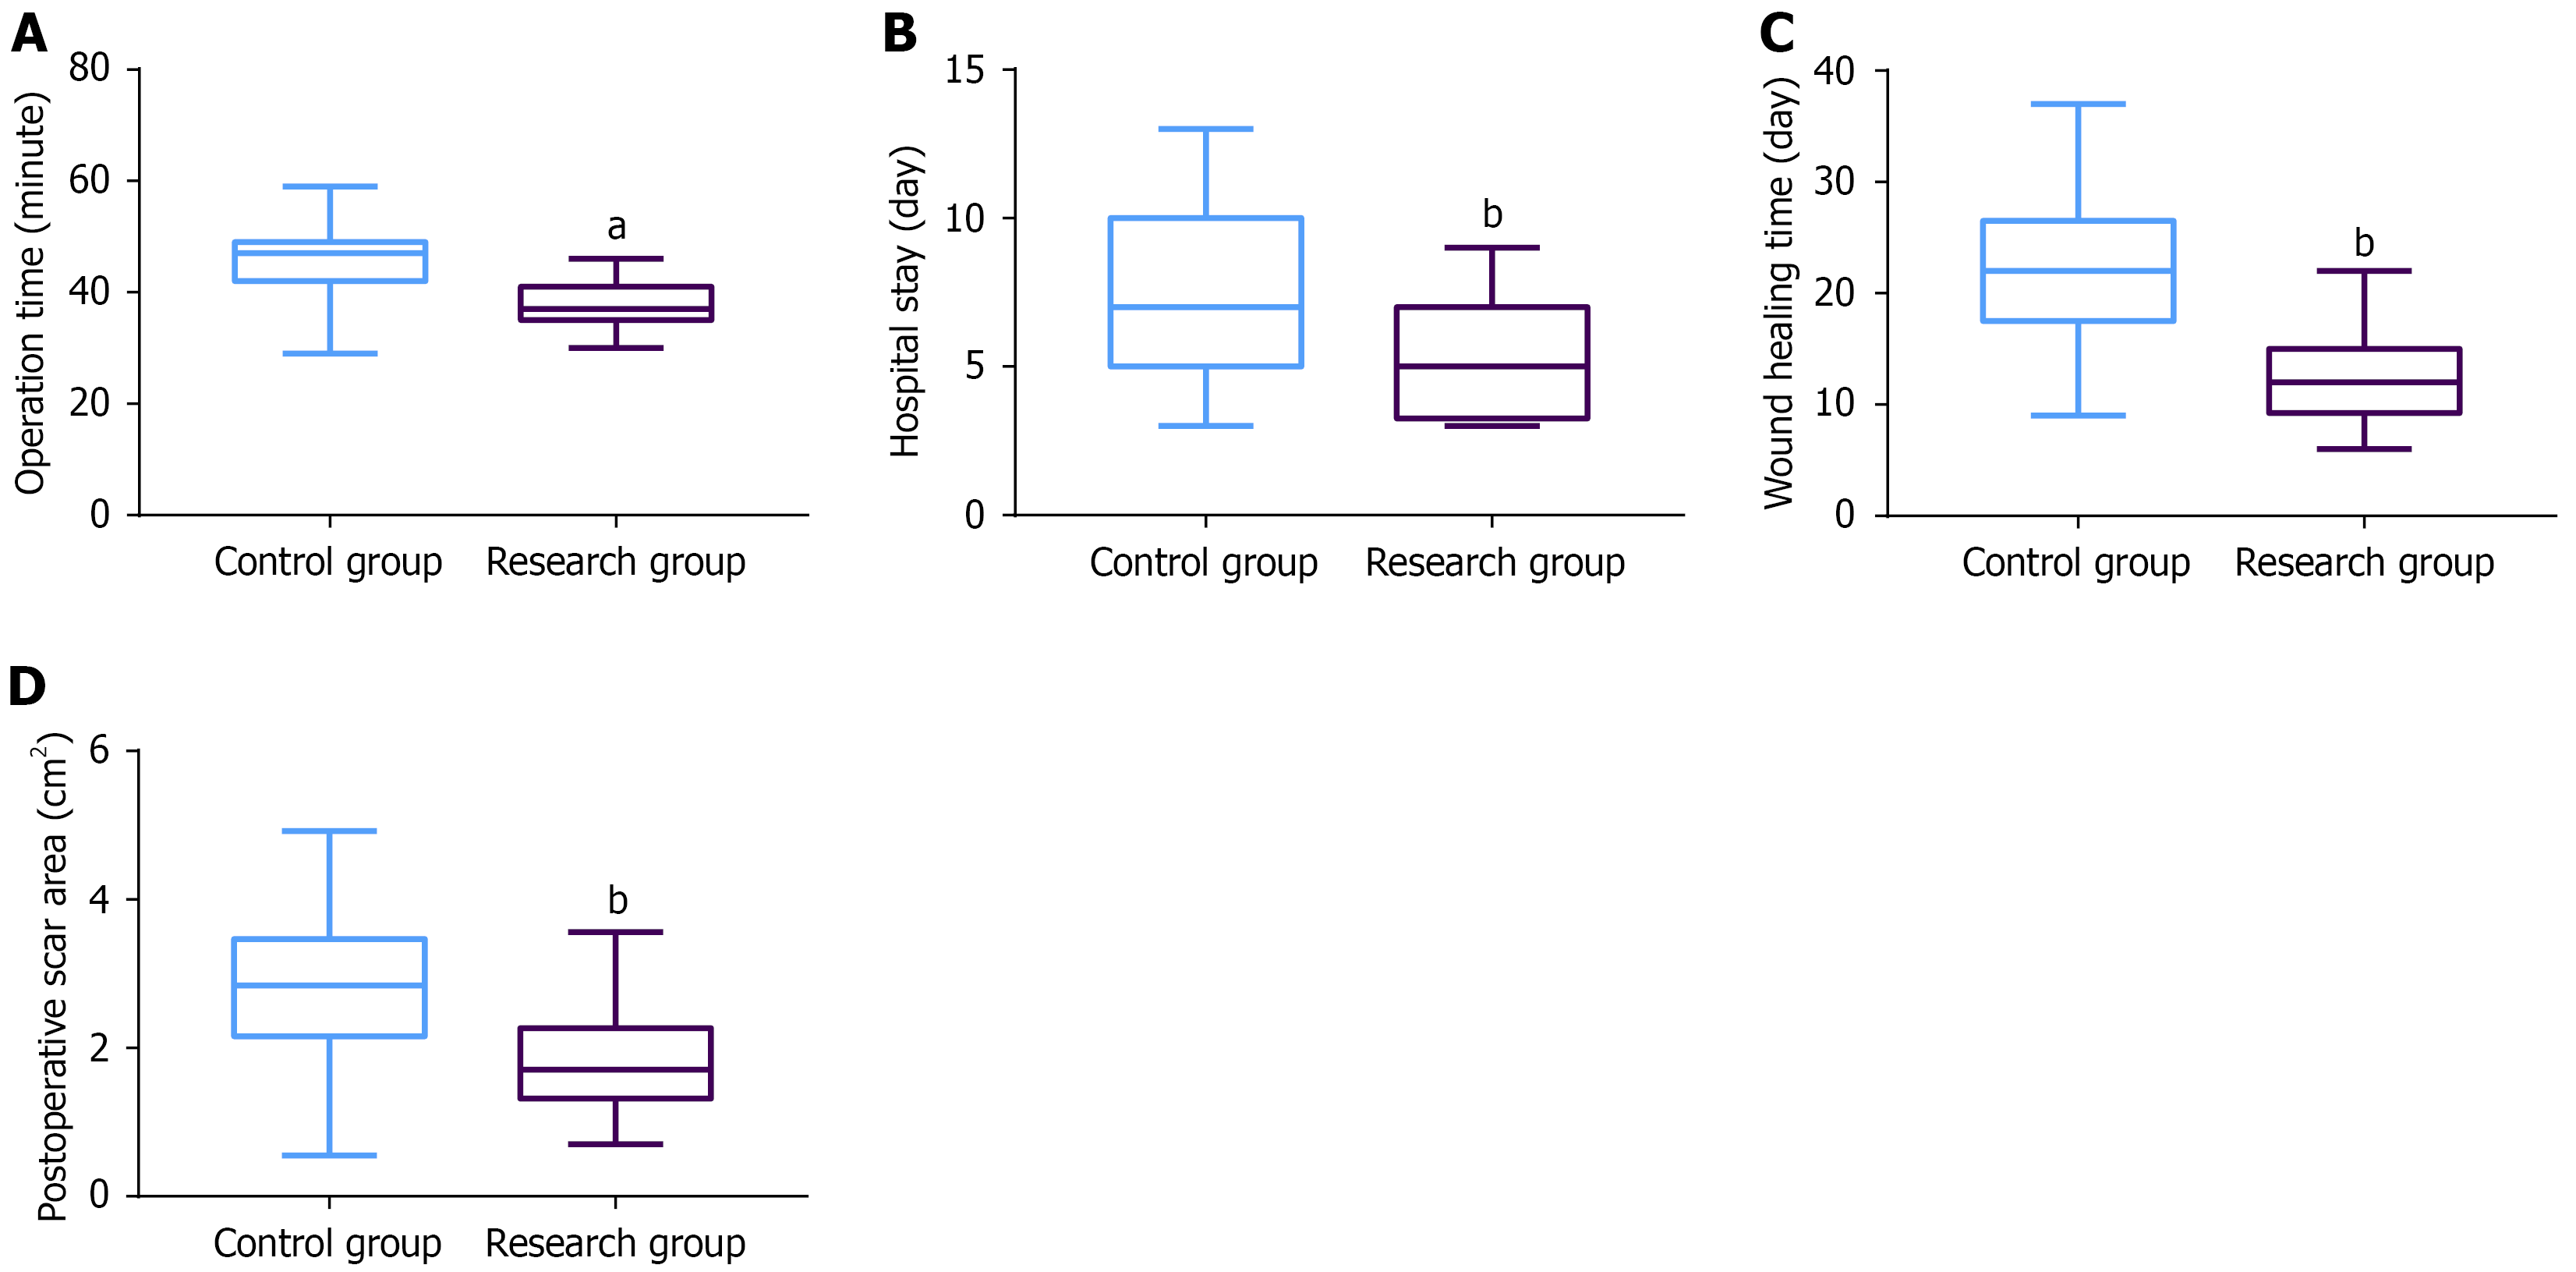
Figure 1 Surgery parameters in the two groups.
aP < 0.05, bP < 0.01 vs the control group. A: Comparison of operation time between the two groups; B: Comparison of hospital stay between the two groups; C: Comparison of wound healing time between the two groups; D: Comparison of postoperative scar area between the two groups.
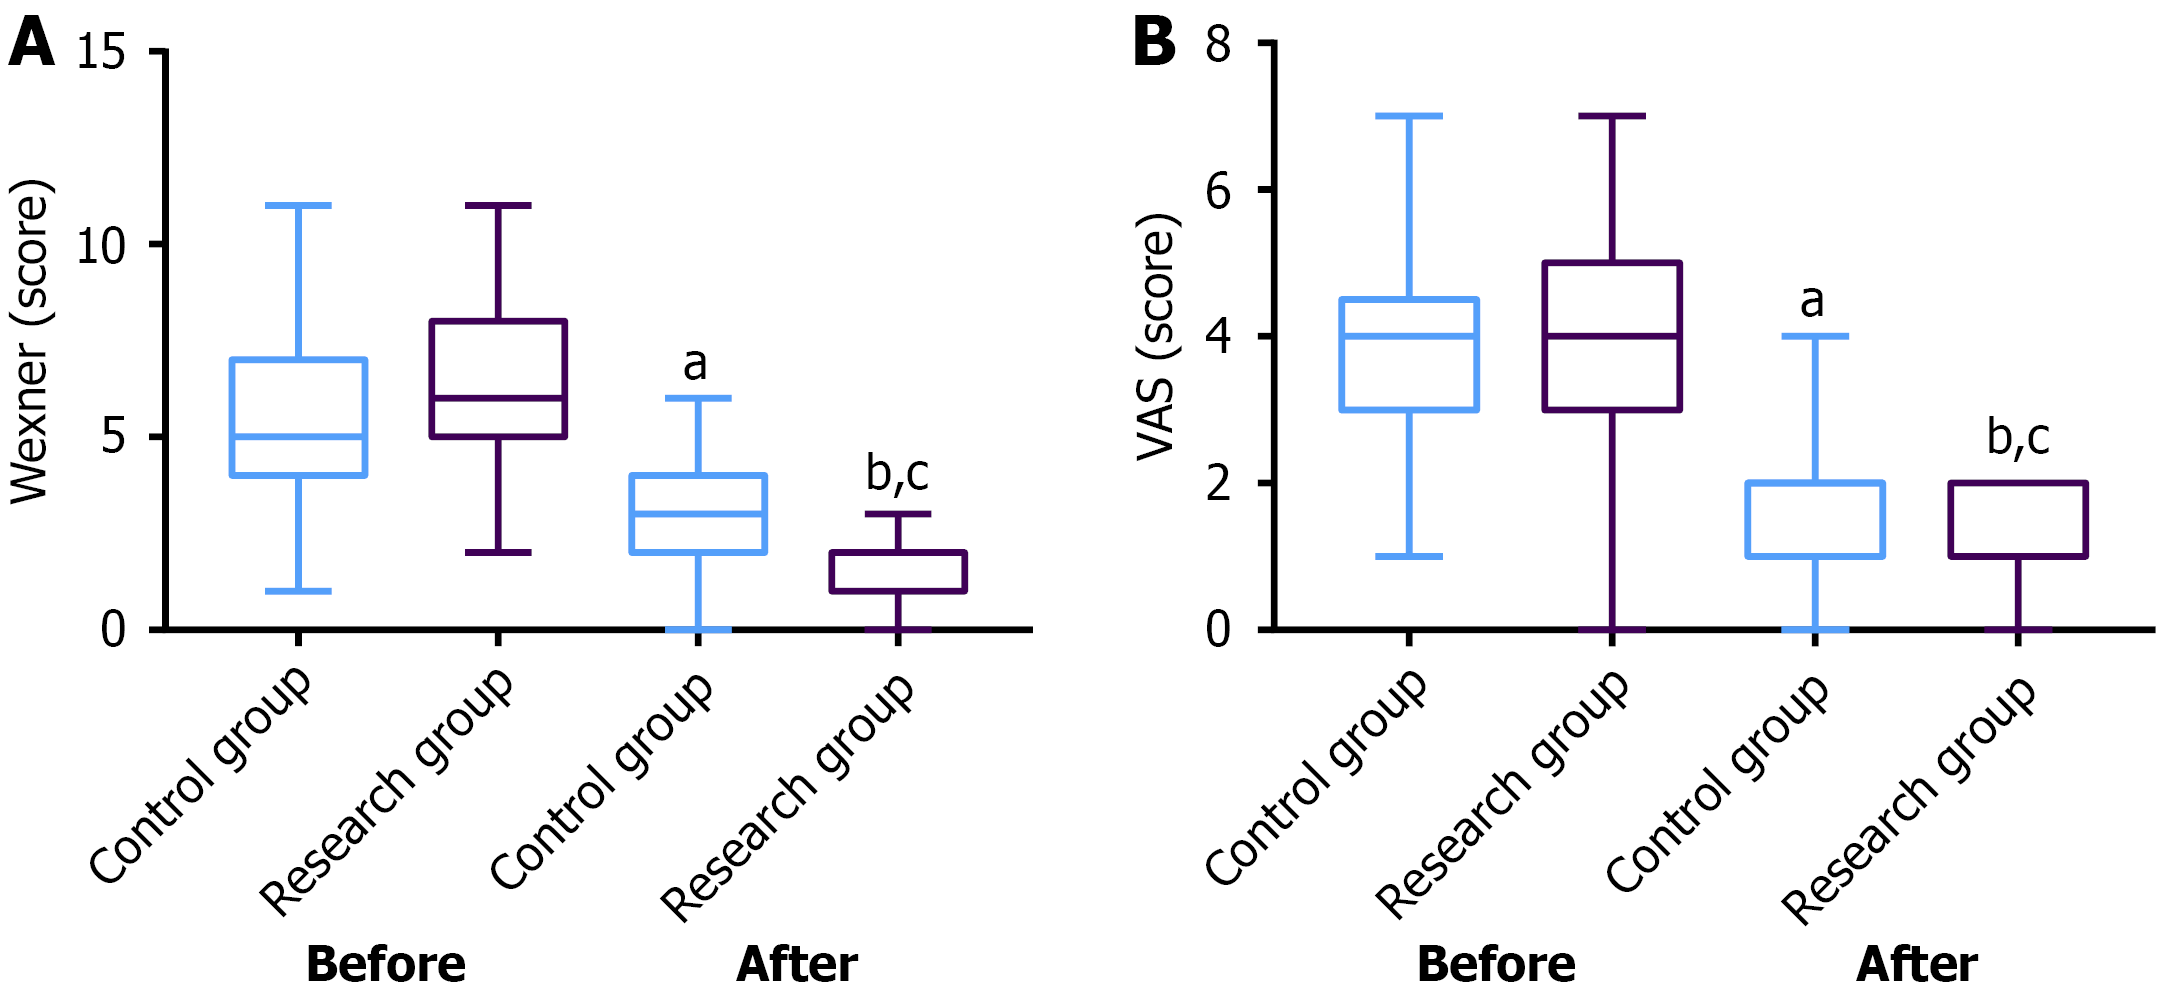
Figure 2 Anal sphincter function and pain intensity in the two groups.
aP < 0.05, bP < 0.01 vs before treatment; cP < 0.05 vs the control group. A: Comparison of the Wexner scores between the two groups; B: Comparison of Visual Analogue Scale scores between the two groups.
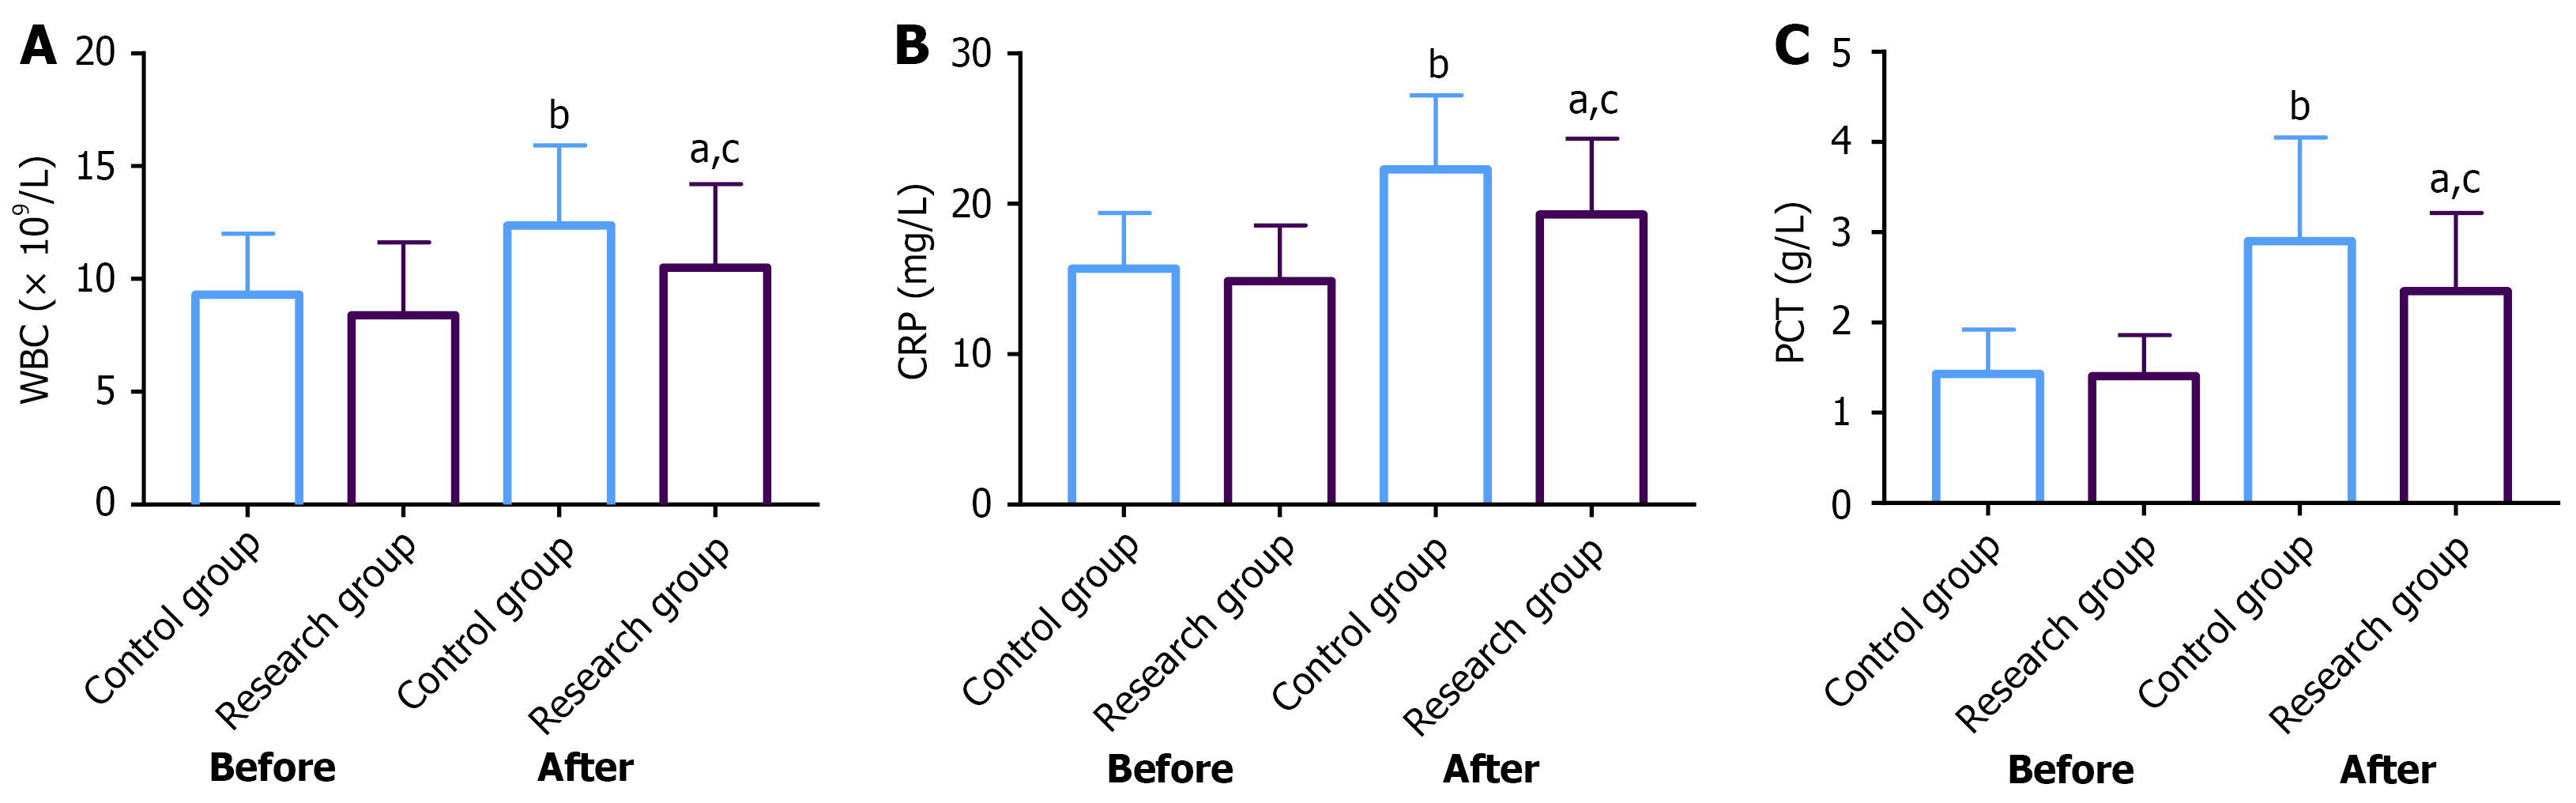
Figure 3 Infection-related parameters in the two groups.
aP < 0.05, bP < 0.01 vs before treatment; cP < 0.05 vs the control group. A: Comparison of white blood cell count between the two groups; B: Comparison of C-reactive protein between the two groups; C: Comparison of procalcitonin between the two groups. WBC: White blood cell; CRP: C-reactive protein; PCT: Procalcitonin.
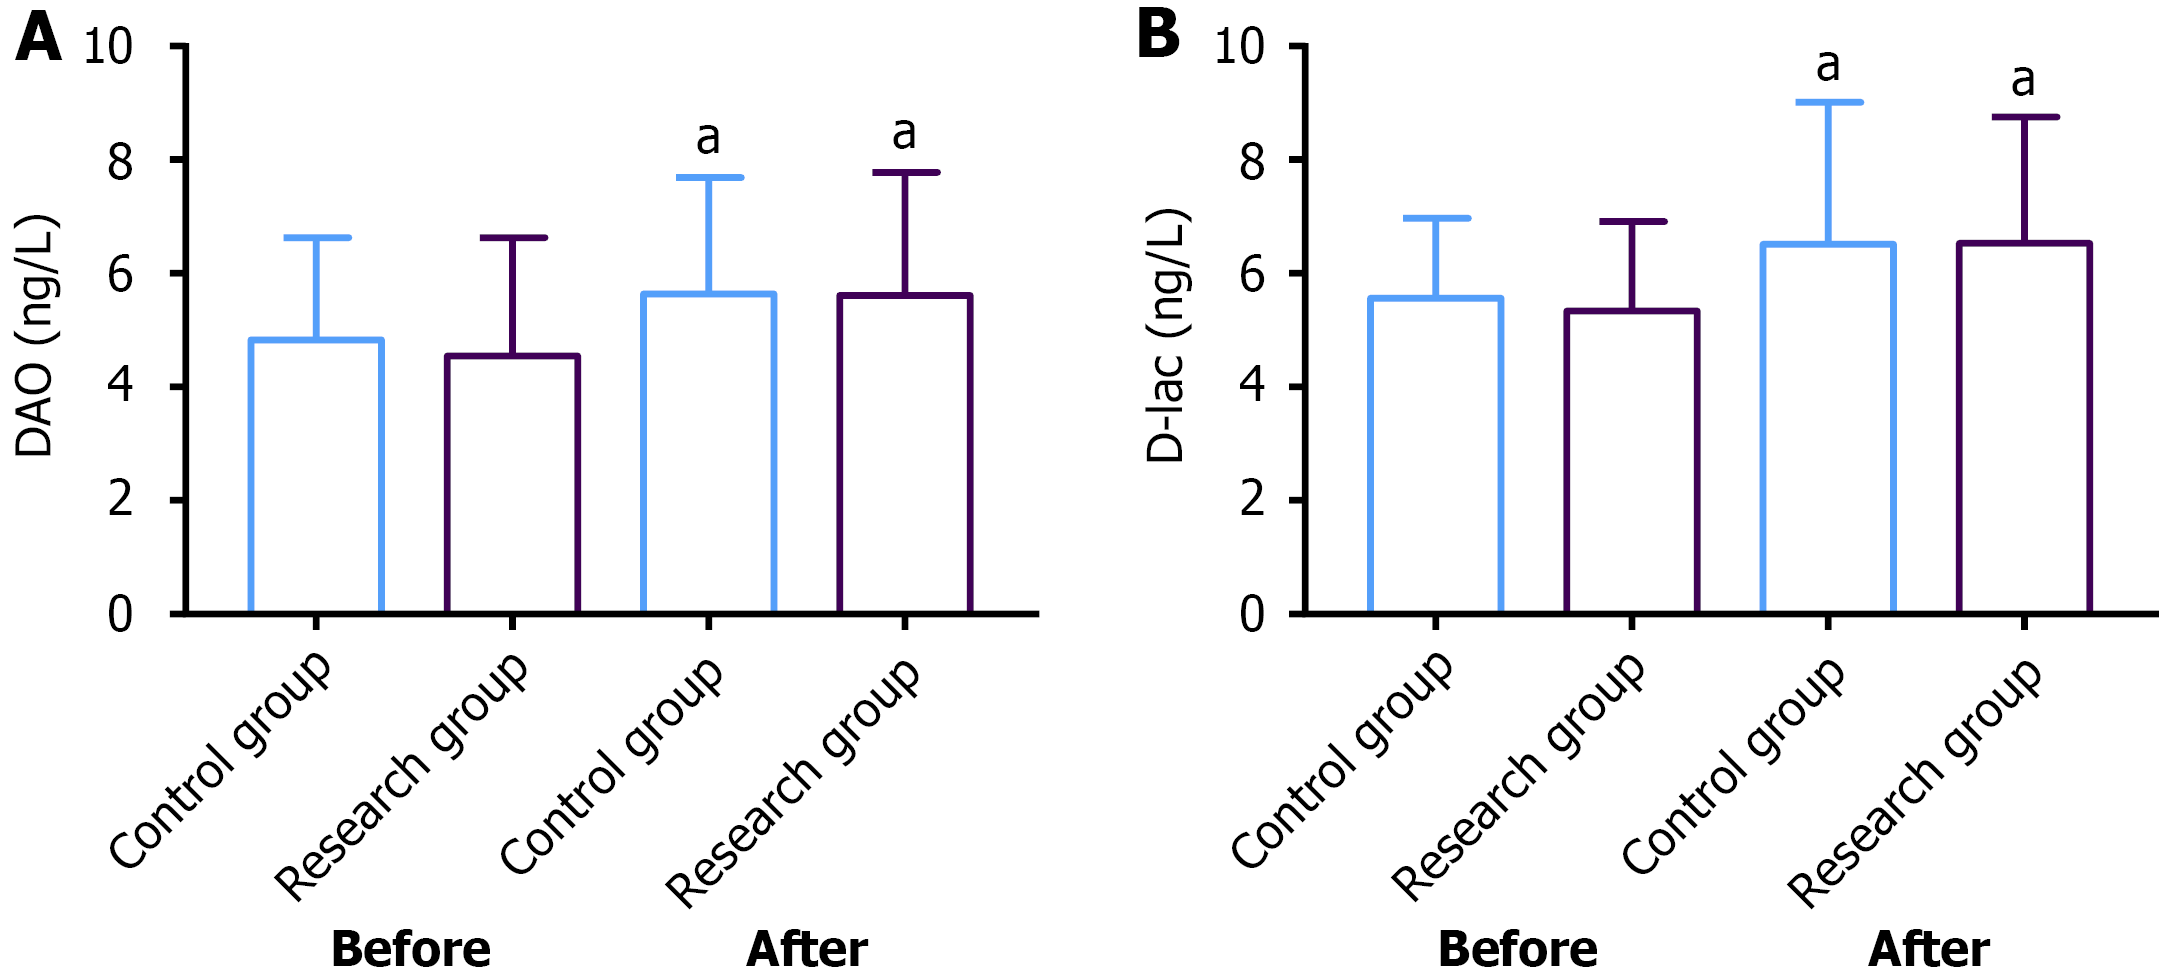
Figure 4 Intestinal barrier function in the two groups.
aP < 0.05, bP < 0.01 vs before treatment; cP < 0.05 vs the control group. A: Comparison of D-alanine oxidase between the two groups; B: Comparison of D-lactic acid between the two groups. DAO: D-alanine oxidase; D-lac: D-lactic acid.
- Citation: Li JQ, Huang ZF, Deng X, Xie ZM, Zhang WB, Li Y. Effects of modified ligation of intersphincteric fistula tract on intestinal barrier function in patients with transsphincteric anal fistula. World J Gastrointest Surg 2026; 18(11): 120547
- URL: https://www.wjgnet.com/1948-9366/full/v18/i11/120547.htm
- DOI: https://dx.doi.org/10.4240/wjgs.120547