Copyright
©The Author(s) 2025.
World J Gastrointest Surg. Aug 27, 2025; 17(8): 108600
Published online Aug 27, 2025. doi: 10.4240/wjgs.v17.i8.108600
Published online Aug 27, 2025. doi: 10.4240/wjgs.v17.i8.108600
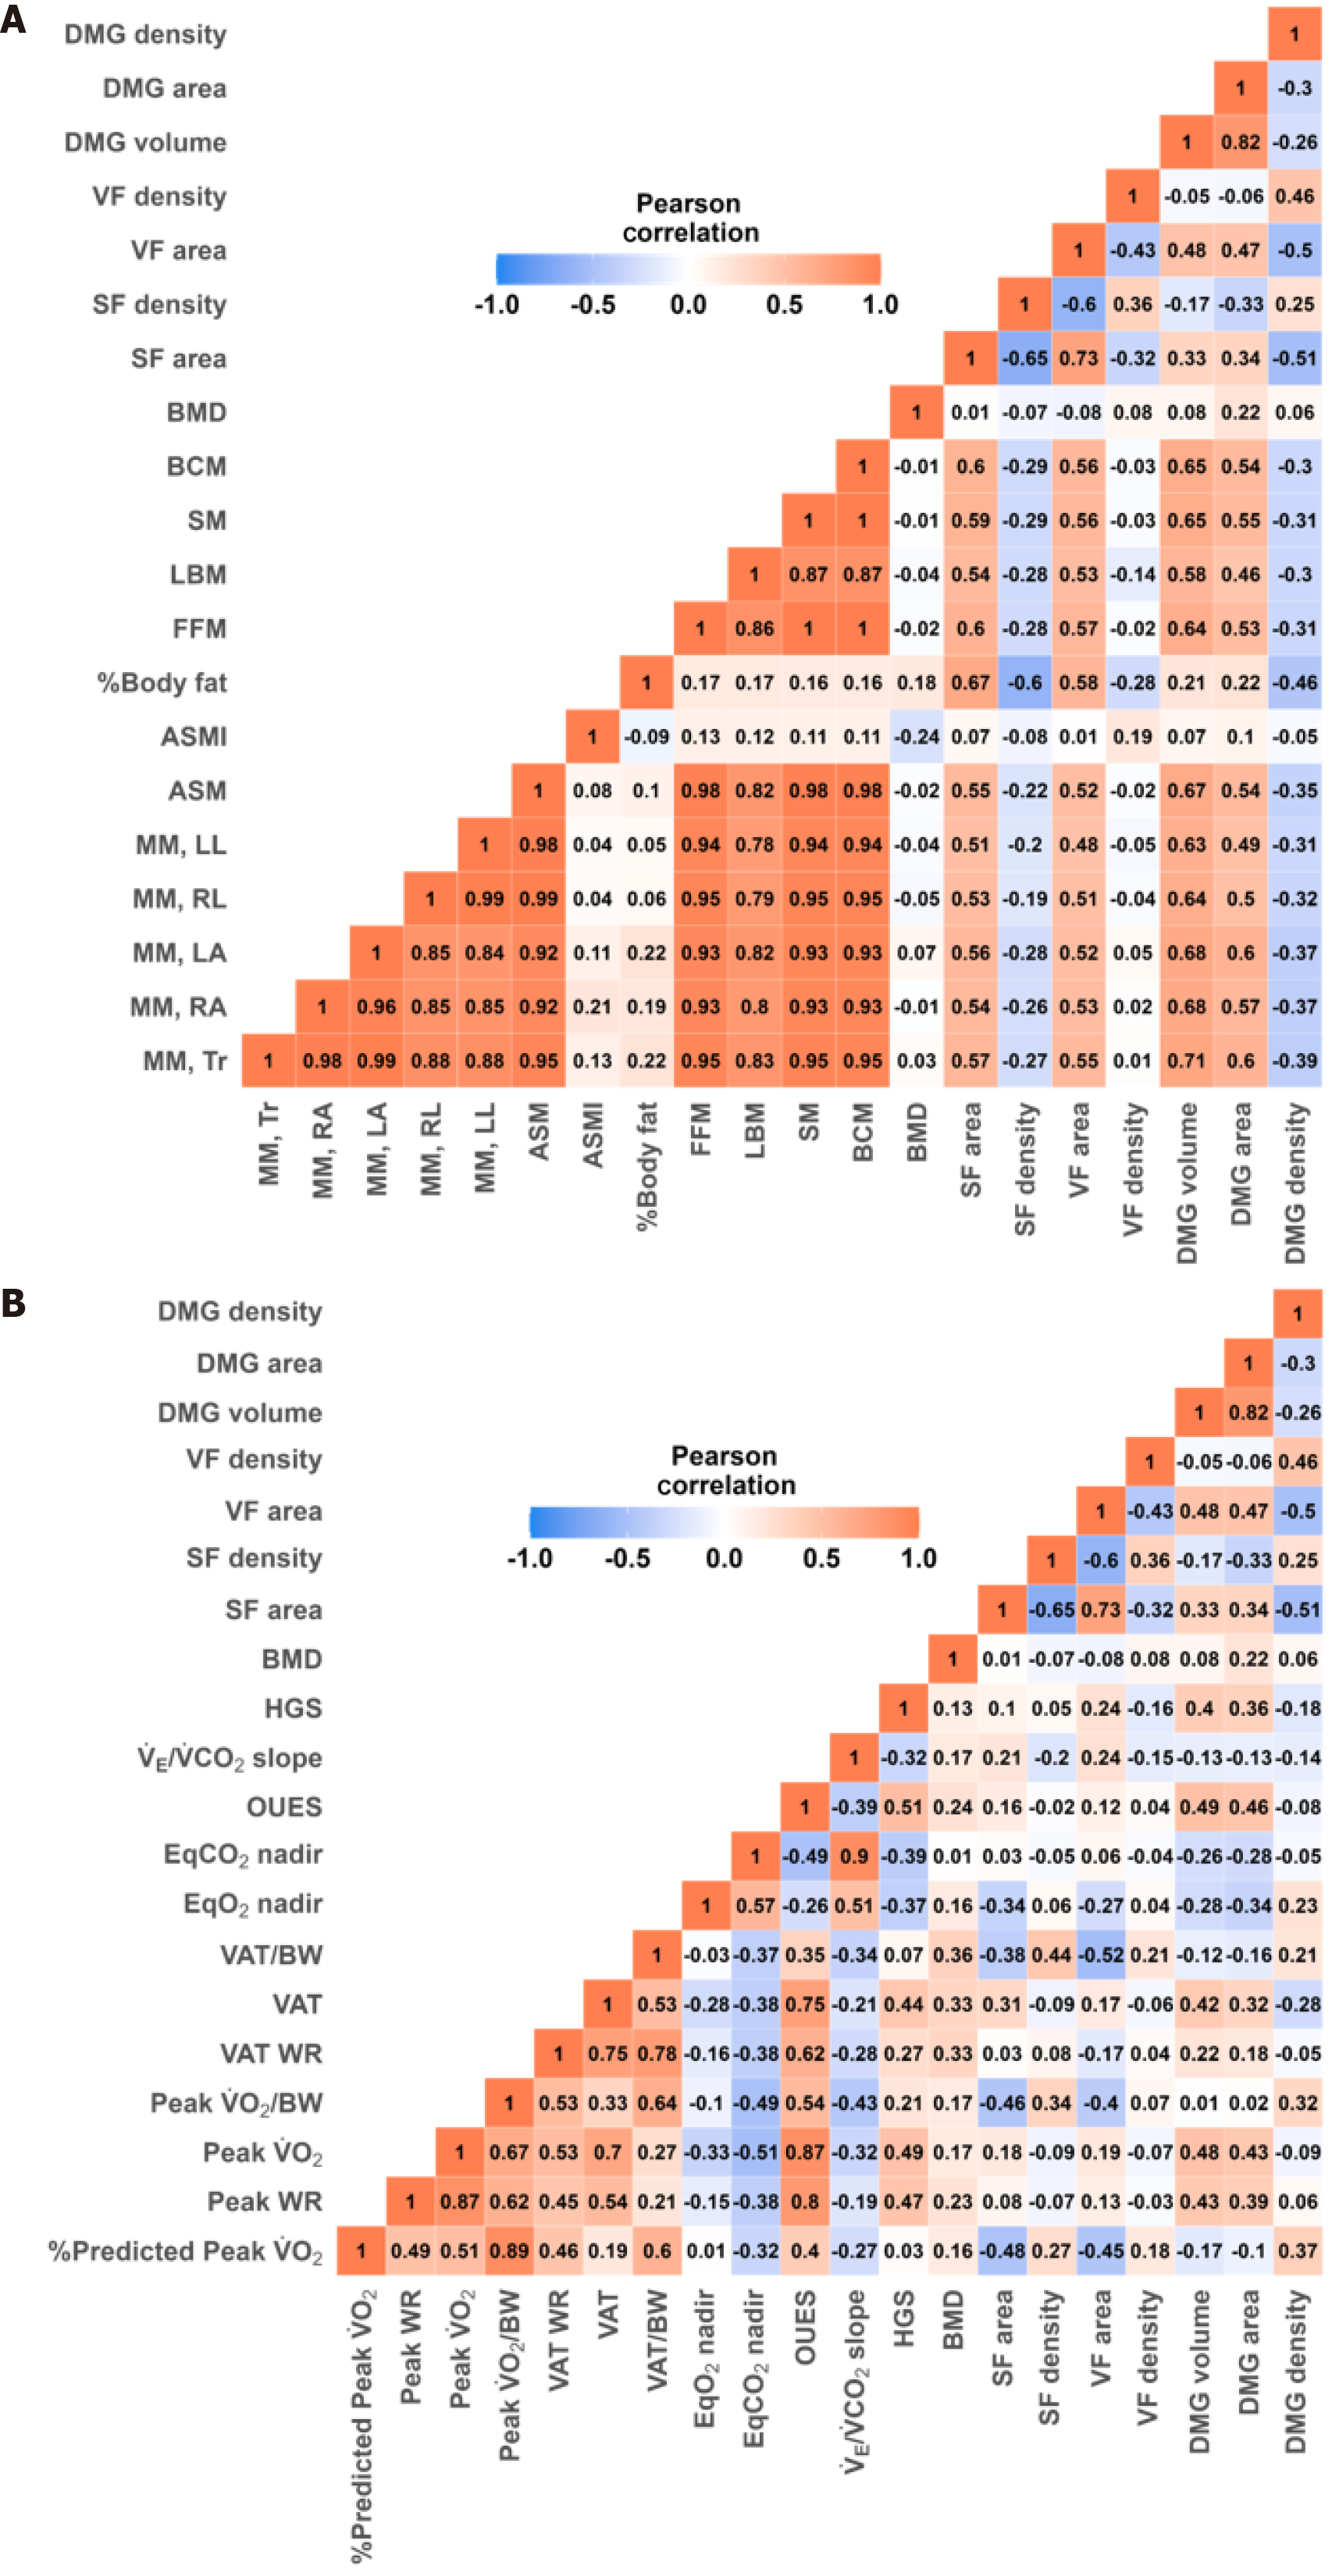
Figure 1 Heatmap of correlation matrix between morphomics.
A: Bioelectrical impedance analysis related body composition; B: Cardiopulmonary exercise testing and hand grip strength. DMG: Dorsal muscle group; BMD: Bone mineral density; SF: Subcutaneous fat; VF: Visceral fat; BCM: Body cell mass; SM: Skeletal muscle; LBM: Lean body mass; FFM: Fat free mass; ASM: Appendicular skeletal muscle; ASMI: Appendicular skeletal muscle index; LA: Left arm; LL: Left leg; MM: Muscle mass; RA: Right arm; RL: Right leg; TR: Trunk; HGS: Hand grip strength; OUES: Oxygen uptake efficiency slope; WR: Work rate; VAT: Ventilatory anaerobic threshold; BW: Body weight; EqO2: Ventilatory equivalent for O2; VO2: Oxygen consumption; EqCO2: Ventilatory equivalent for CO2.
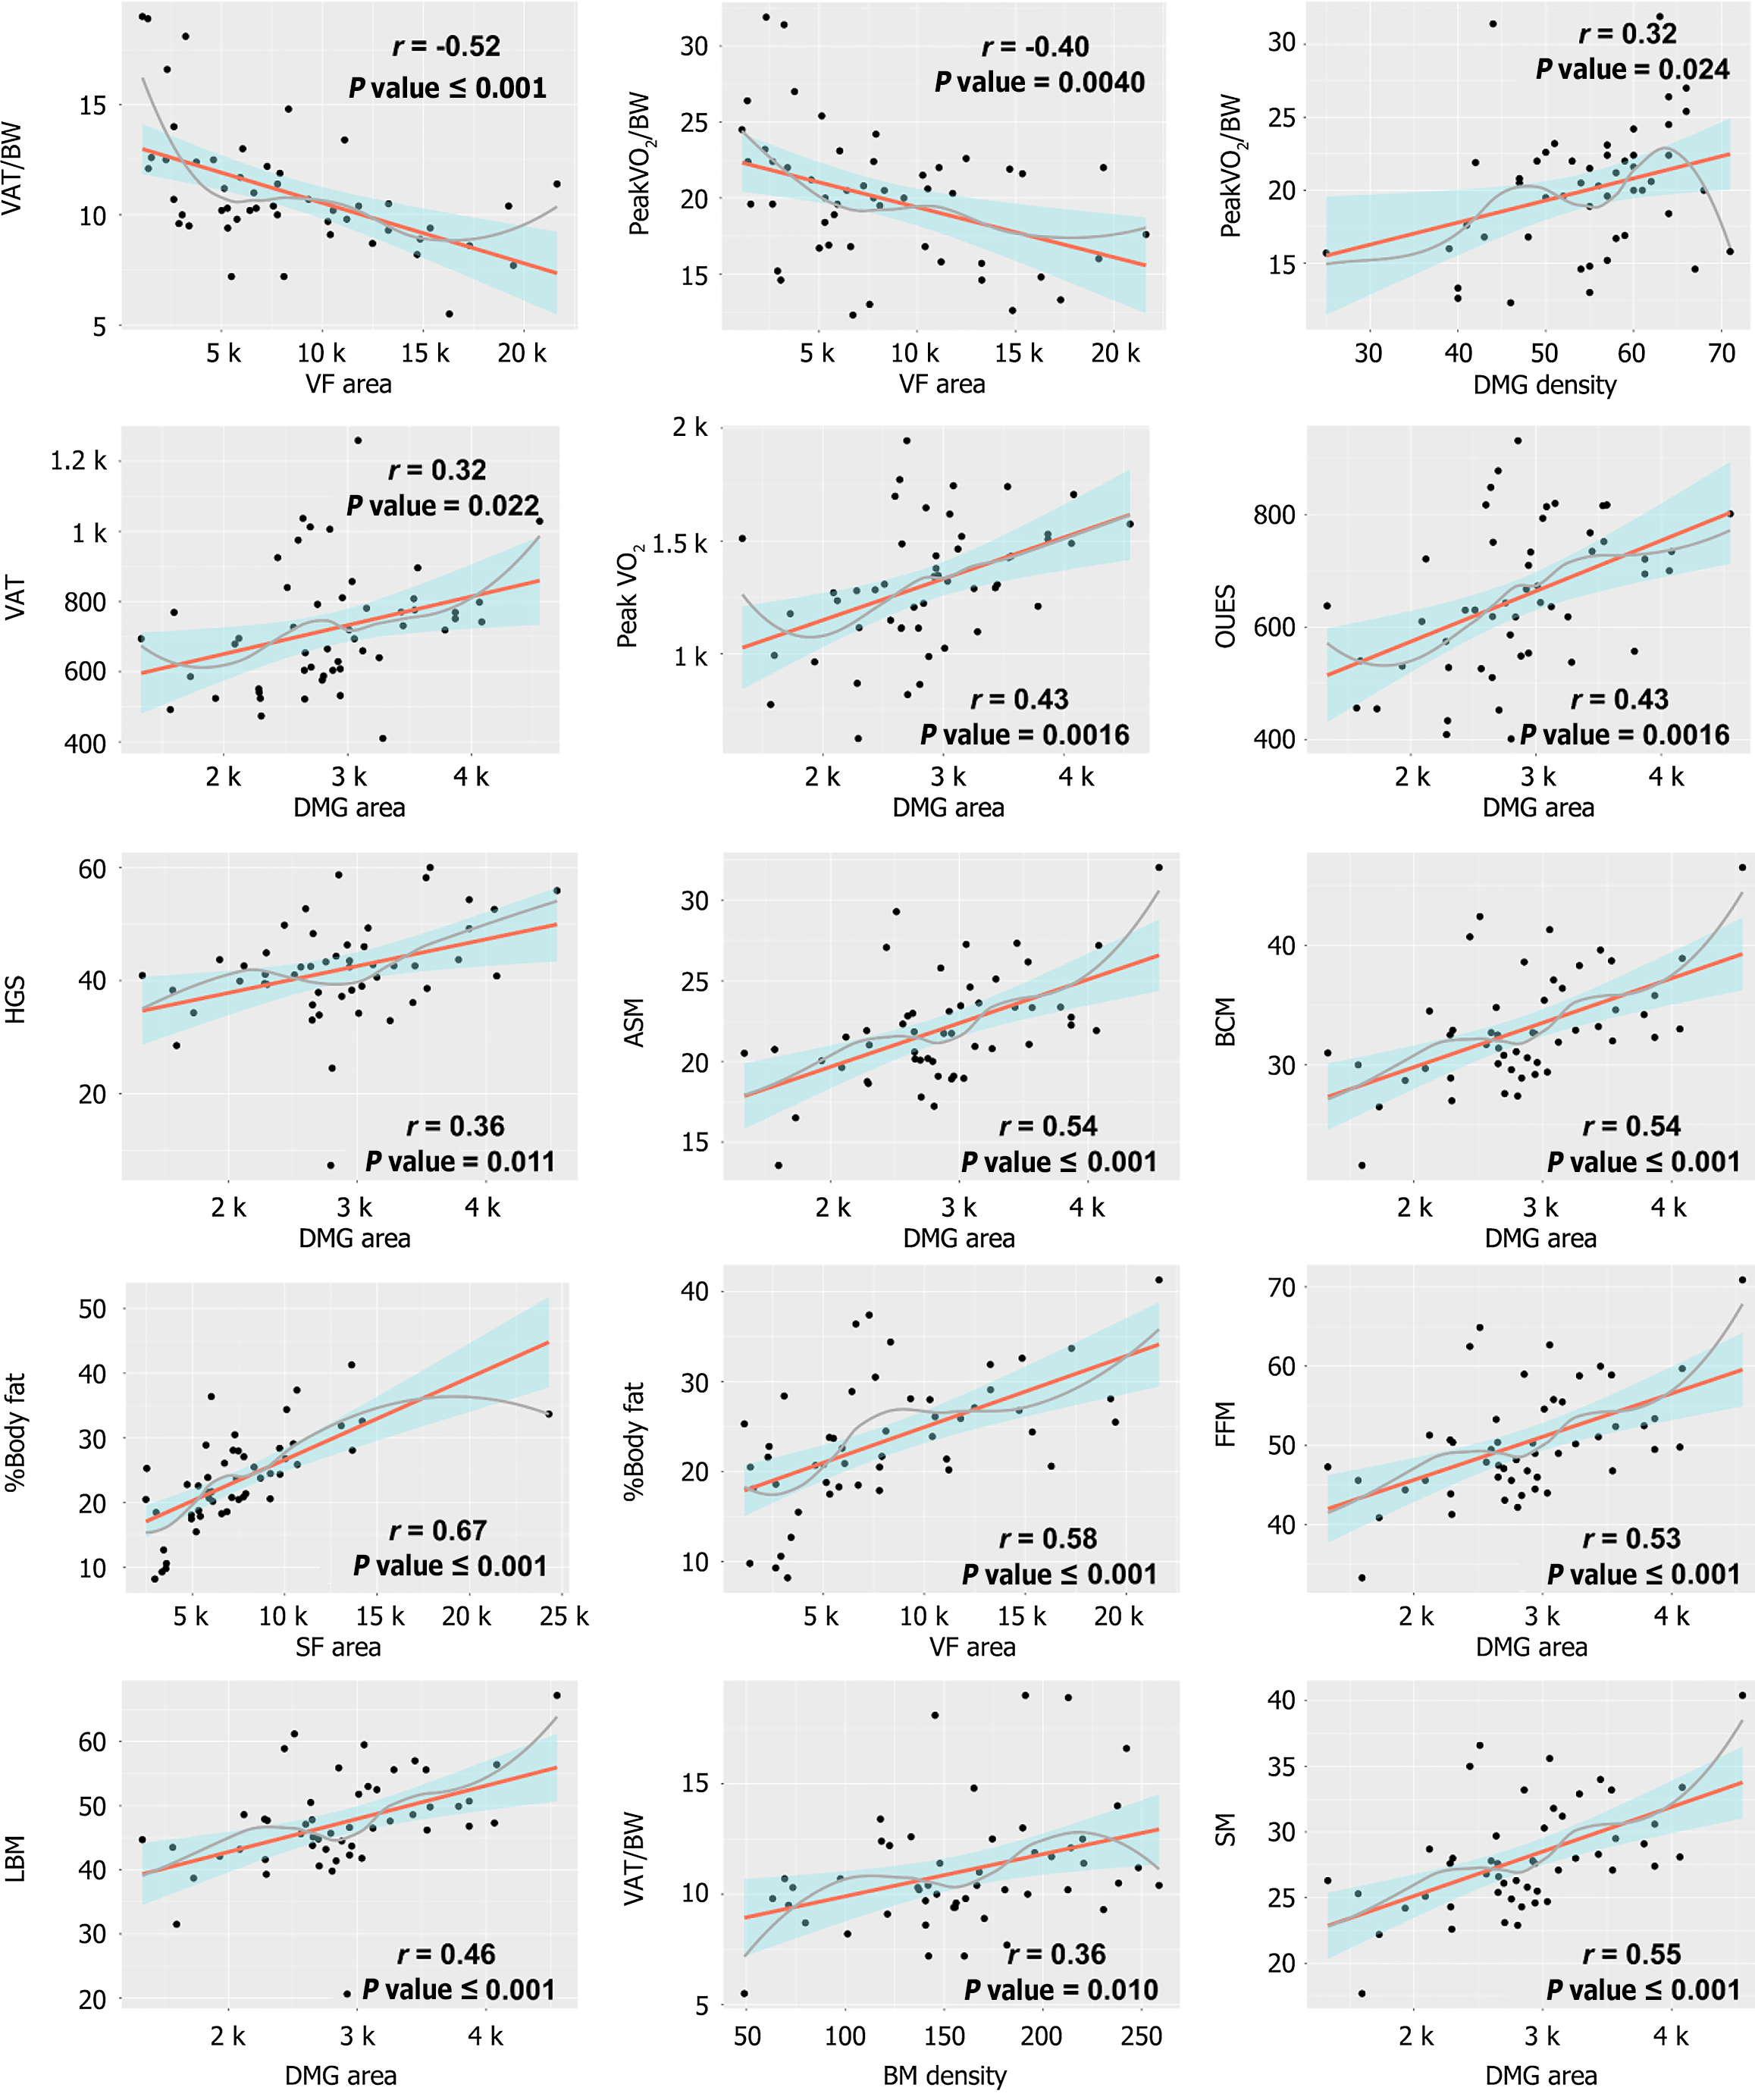
Figure 2 Scatterplots of selected parameters between morphomics and bioelectrical impedance analysis/ hand grip strength/ cardiopulmonary exercise testing (orange line: Linear regression; grey line: Locally estimated scatterplot smoothing curve; blue shading = 95%CI; n = 50).
DMG: Dorsal muscle group; BMD: Bone mineral density; SF: Subcutaneous fat; VF: Visceral fat; BW: Body weight; LBM: Lean body mass; FFM: Fat free mass; ASM: Appendicular skeletal muscle; VAT: Ventilatory anaerobic threshold; HGS: Hand grip strength; SM: Skeletal muscle; VO2: Oxygen consumption.
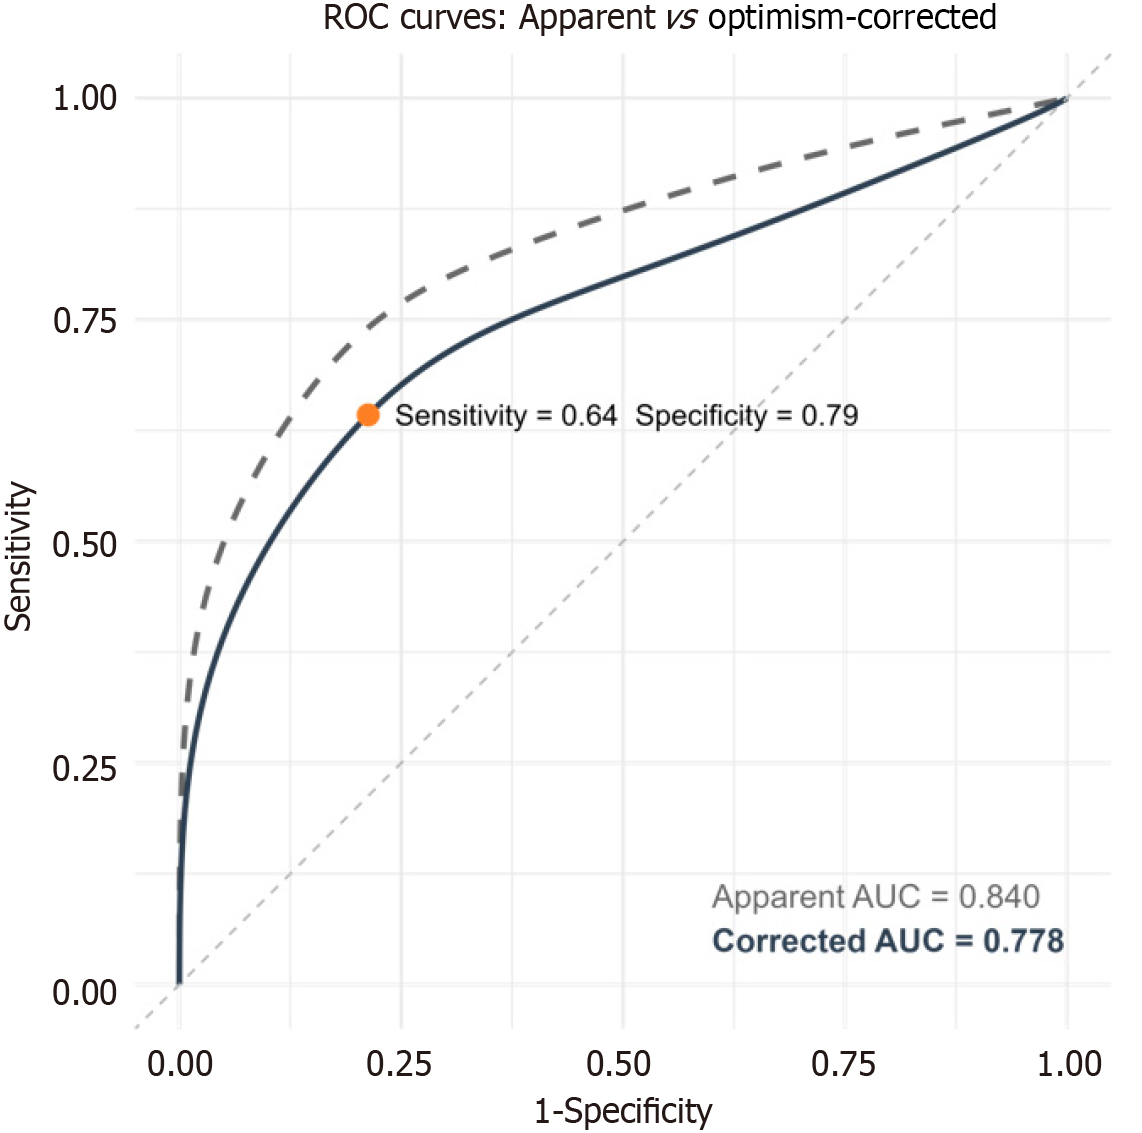
Figure 3 Receiver operator curve analysis for predicting patients with low cardiorespiratory fitness from the morphomics.
The area under the receiver operator curve curves (AUC) was 0.840, and optimism-corrected AUC was 0.778 under the setting of 1000 bootstrap resamples internal validation (95% confidence interval 0.628-0.0.882, P < 0.001). AUC: Area under the receiver operator curve; ROC: Receiver operator curve.
- Citation: Tseng WHS, Huang SC, Wang SC, Lin J, Zhang P, Liu YC, Chao YK, Chiu CH. Morphomics in esophageal cancer: Validation and association with muscular and cardiorespiratory fitness. World J Gastrointest Surg 2025; 17(8): 108600
- URL: https://www.wjgnet.com/1948-9366/full/v17/i8/108600.htm
- DOI: https://dx.doi.org/10.4240/wjgs.v17.i8.108600


