Copyright
©The Author(s) 2025.
World J Gastrointest Surg. Jun 27, 2025; 17(6): 106517
Published online Jun 27, 2025. doi: 10.4240/wjgs.v17.i6.106517
Published online Jun 27, 2025. doi: 10.4240/wjgs.v17.i6.106517
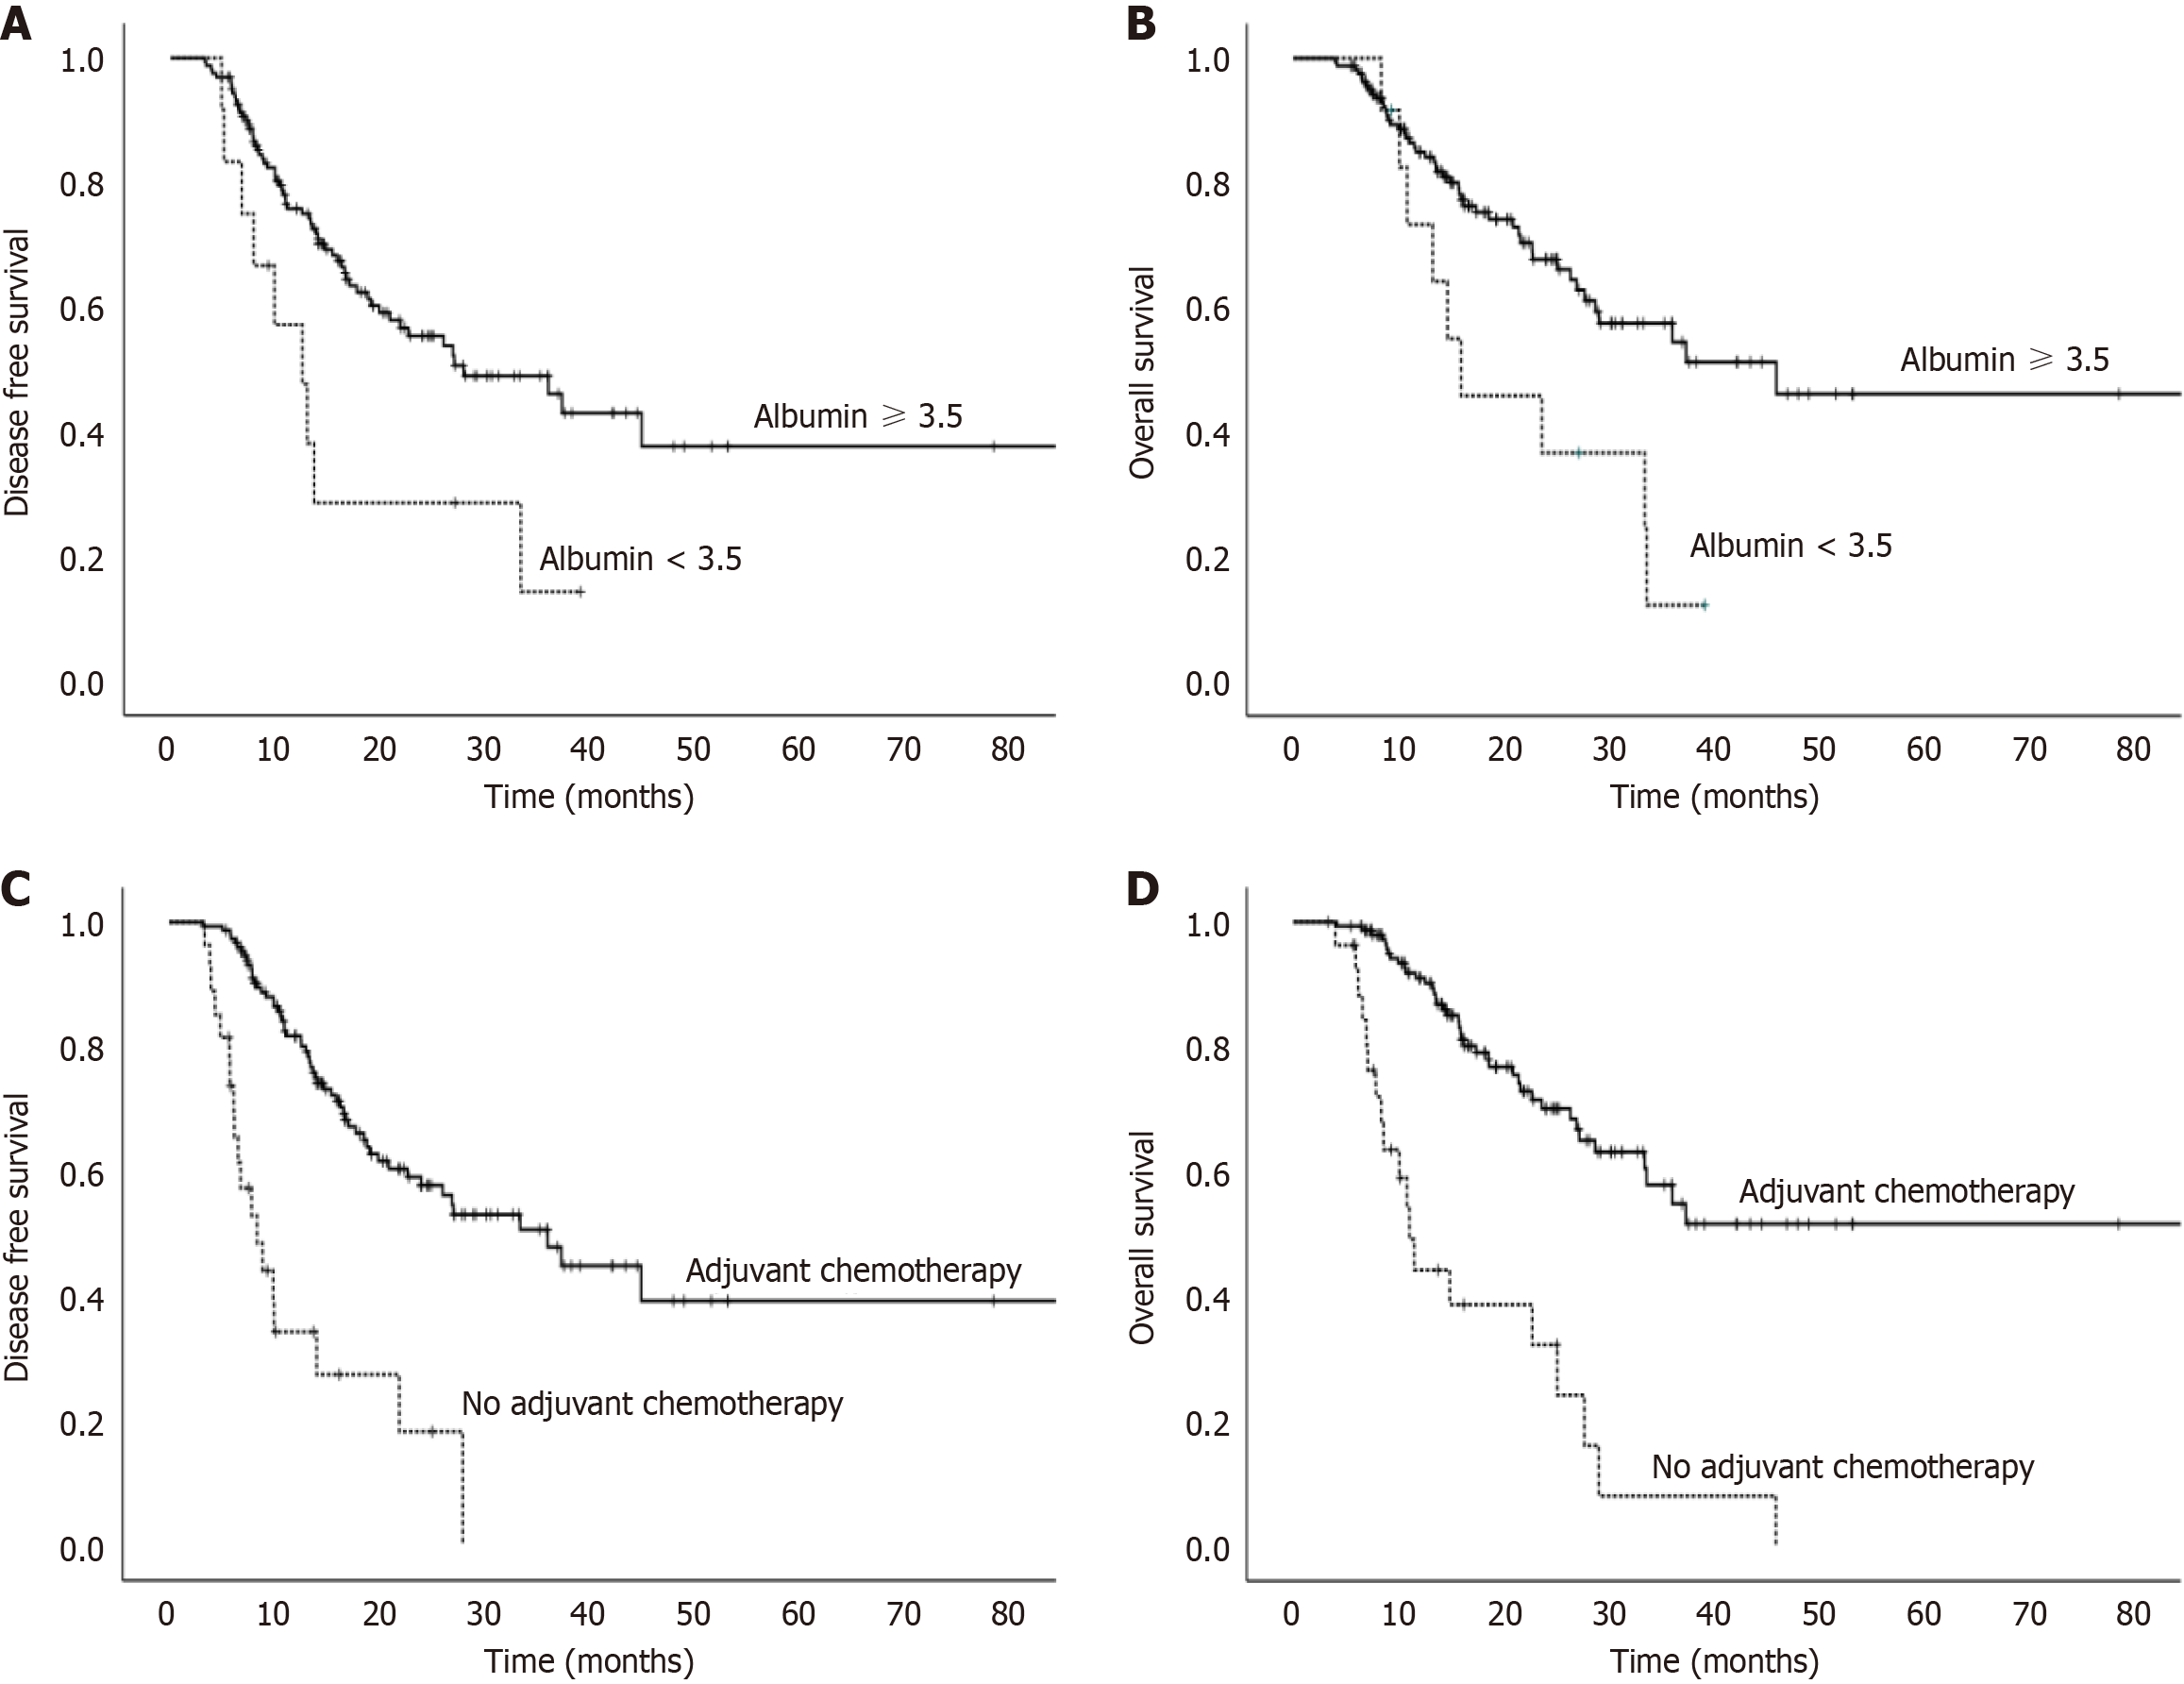
Figure 1 The survival rate of groups of patients.
A: Disease-free survival graph in patients with albumin levels < 3.5 vs ≥ 3.5 g/dL; B: Overall survival graph in patients with albumin levels < 3.5 vs ≥ 3.5 g/dL; C: Disease-free survival graph in patients with and without adjuvant chemotherapy; D: Overall survival graph in patients with and without adjuvant chemotherapy.
- Citation: Bulut N, Erdem GU, Kapagan T, Erol VB, Sahin T, Yakin M, Bayramgil A, Dülgar Ö. Prognostic impact of histopathological features and serum inflammatory markers in patients with gastric cancer undergoing neoadjuvant therapy. World J Gastrointest Surg 2025; 17(6): 106517
- URL: https://www.wjgnet.com/1948-9366/full/v17/i6/106517.htm
- DOI: https://dx.doi.org/10.4240/wjgs.v17.i6.106517


