Copyright
©The Author(s) 2025.
World J Gastrointest Surg. Jun 27, 2025; 17(6): 105073
Published online Jun 27, 2025. doi: 10.4240/wjgs.v17.i6.105073
Published online Jun 27, 2025. doi: 10.4240/wjgs.v17.i6.105073
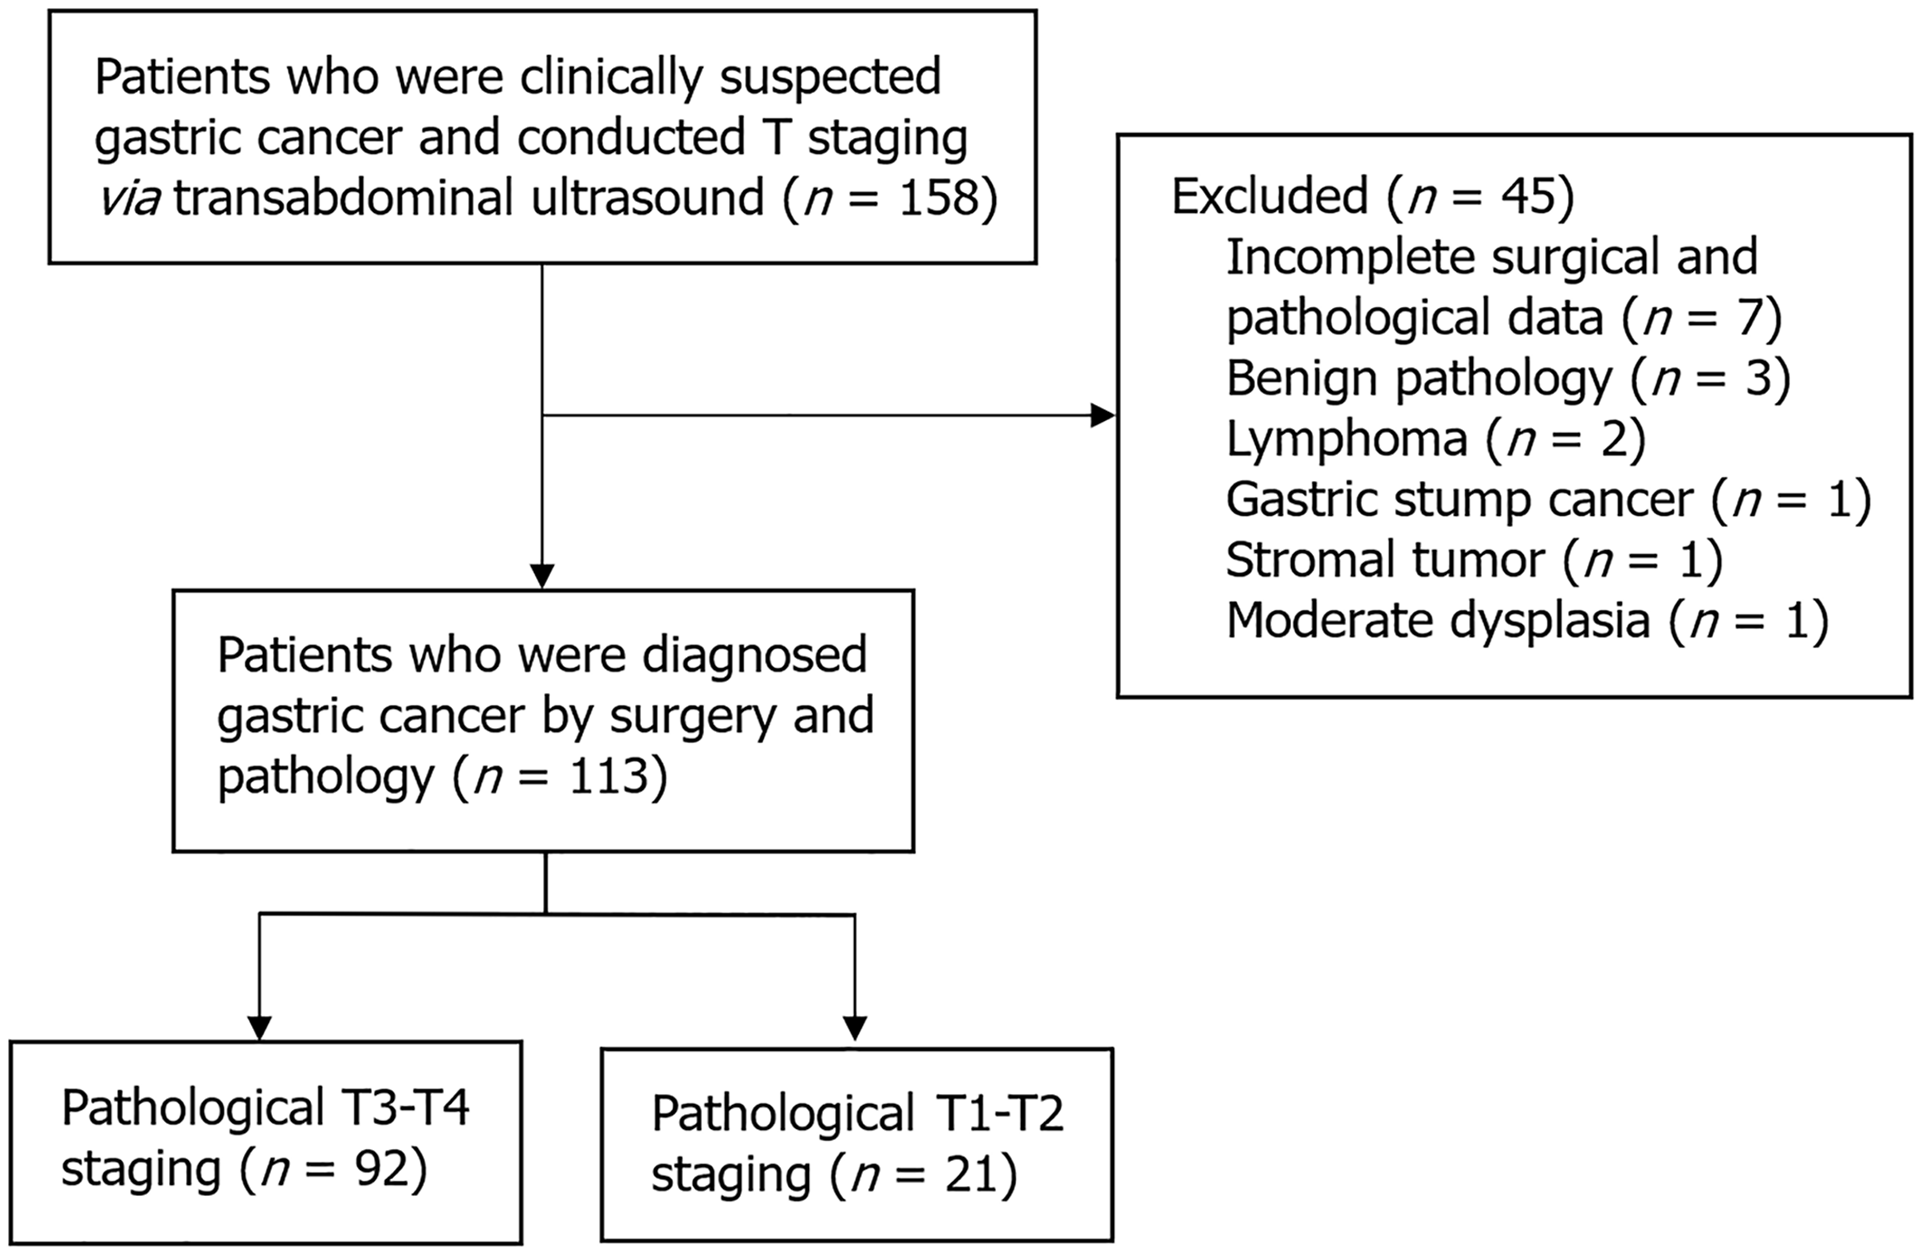
Figure 1 Flow chart of patient inclusion.
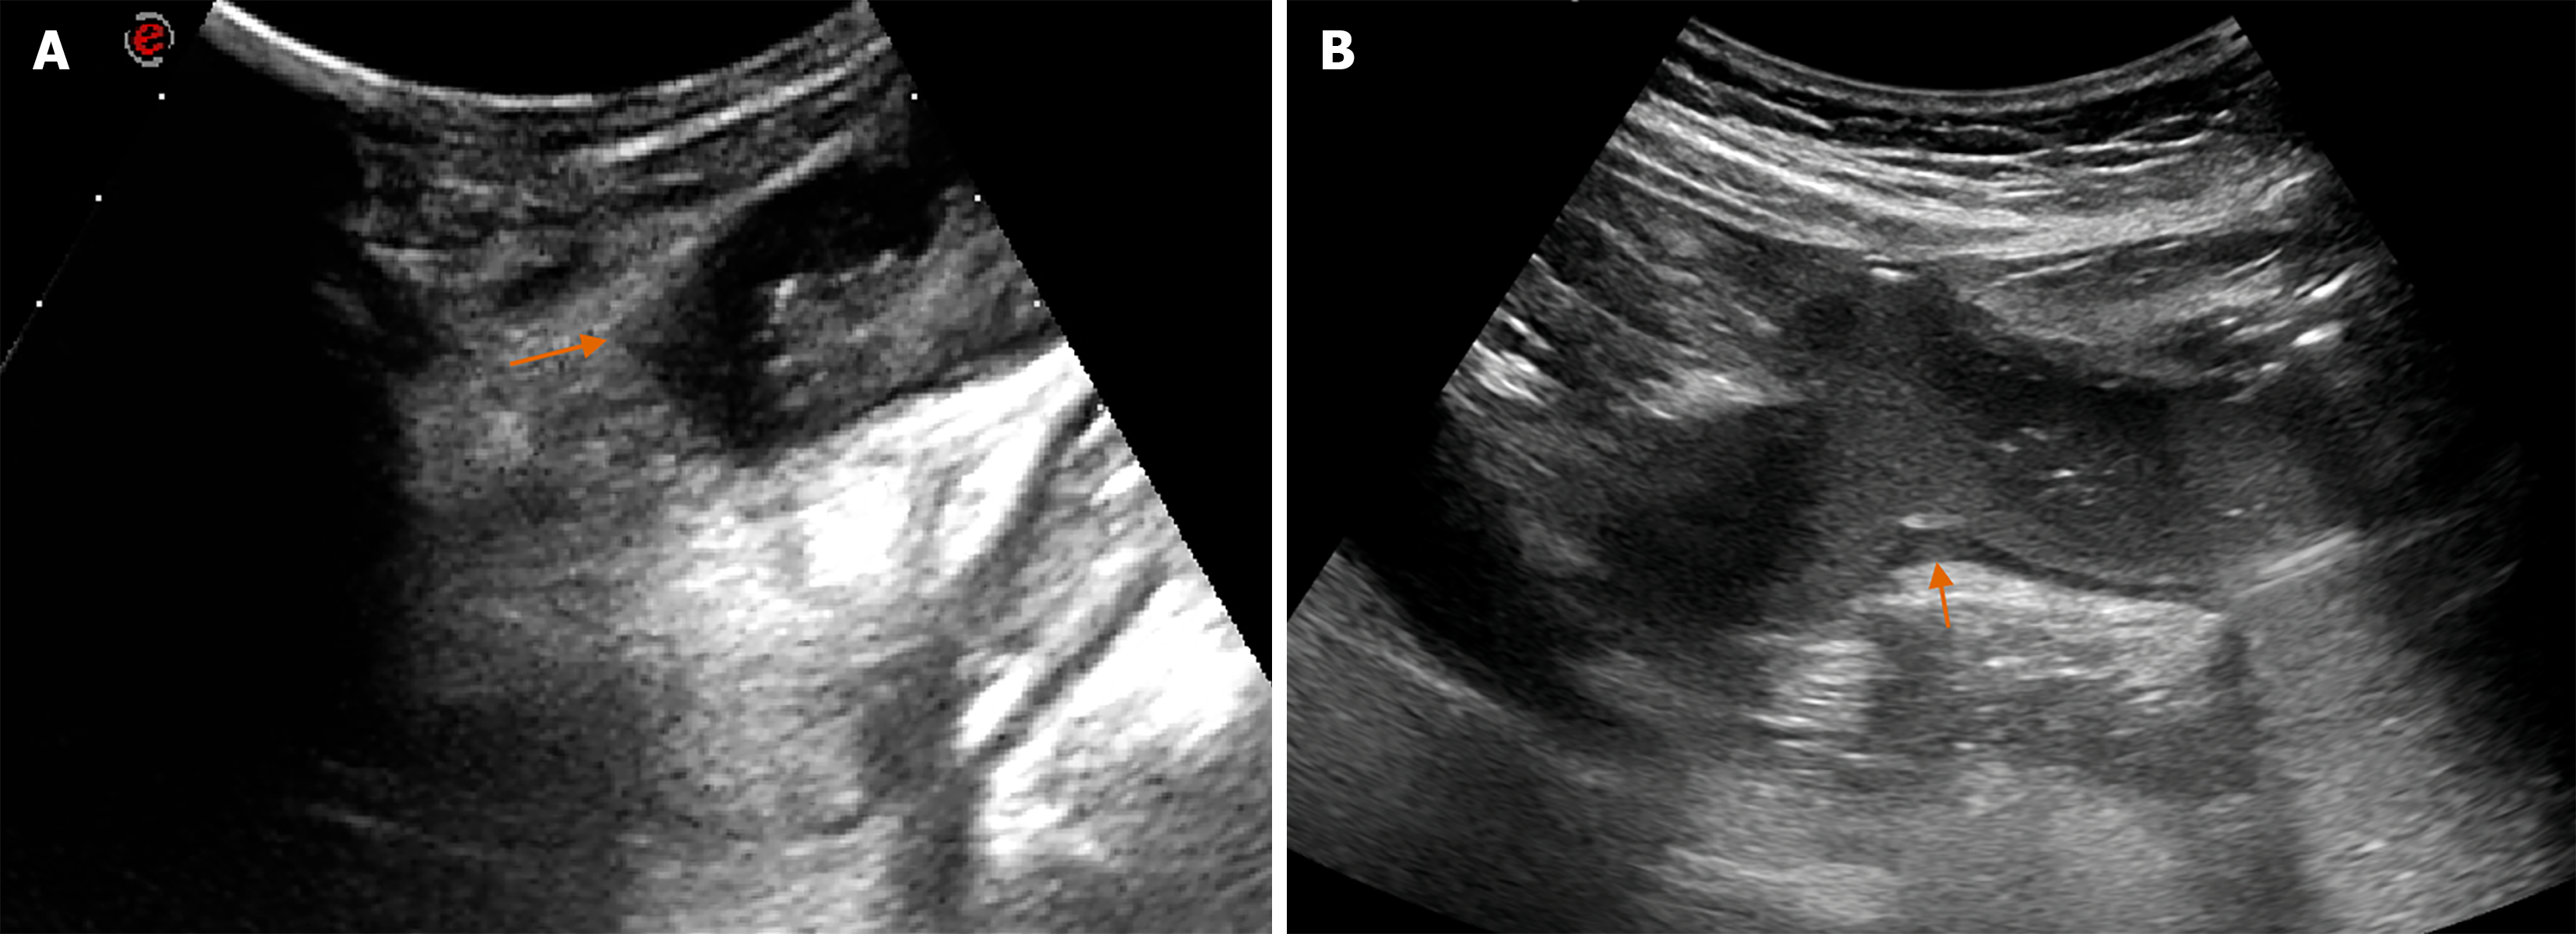
Figure 2 Imaging features of lesions with and without angle sign on transabdominal ultrasound.
A: T4a staging of gastric cancer (GC) lesion with an angle sign, which showed that hypoechoic intrinsic muscular layer protruded outward to form an angle (red arrow); B: T2 staging of GC lesion without an angle sign.
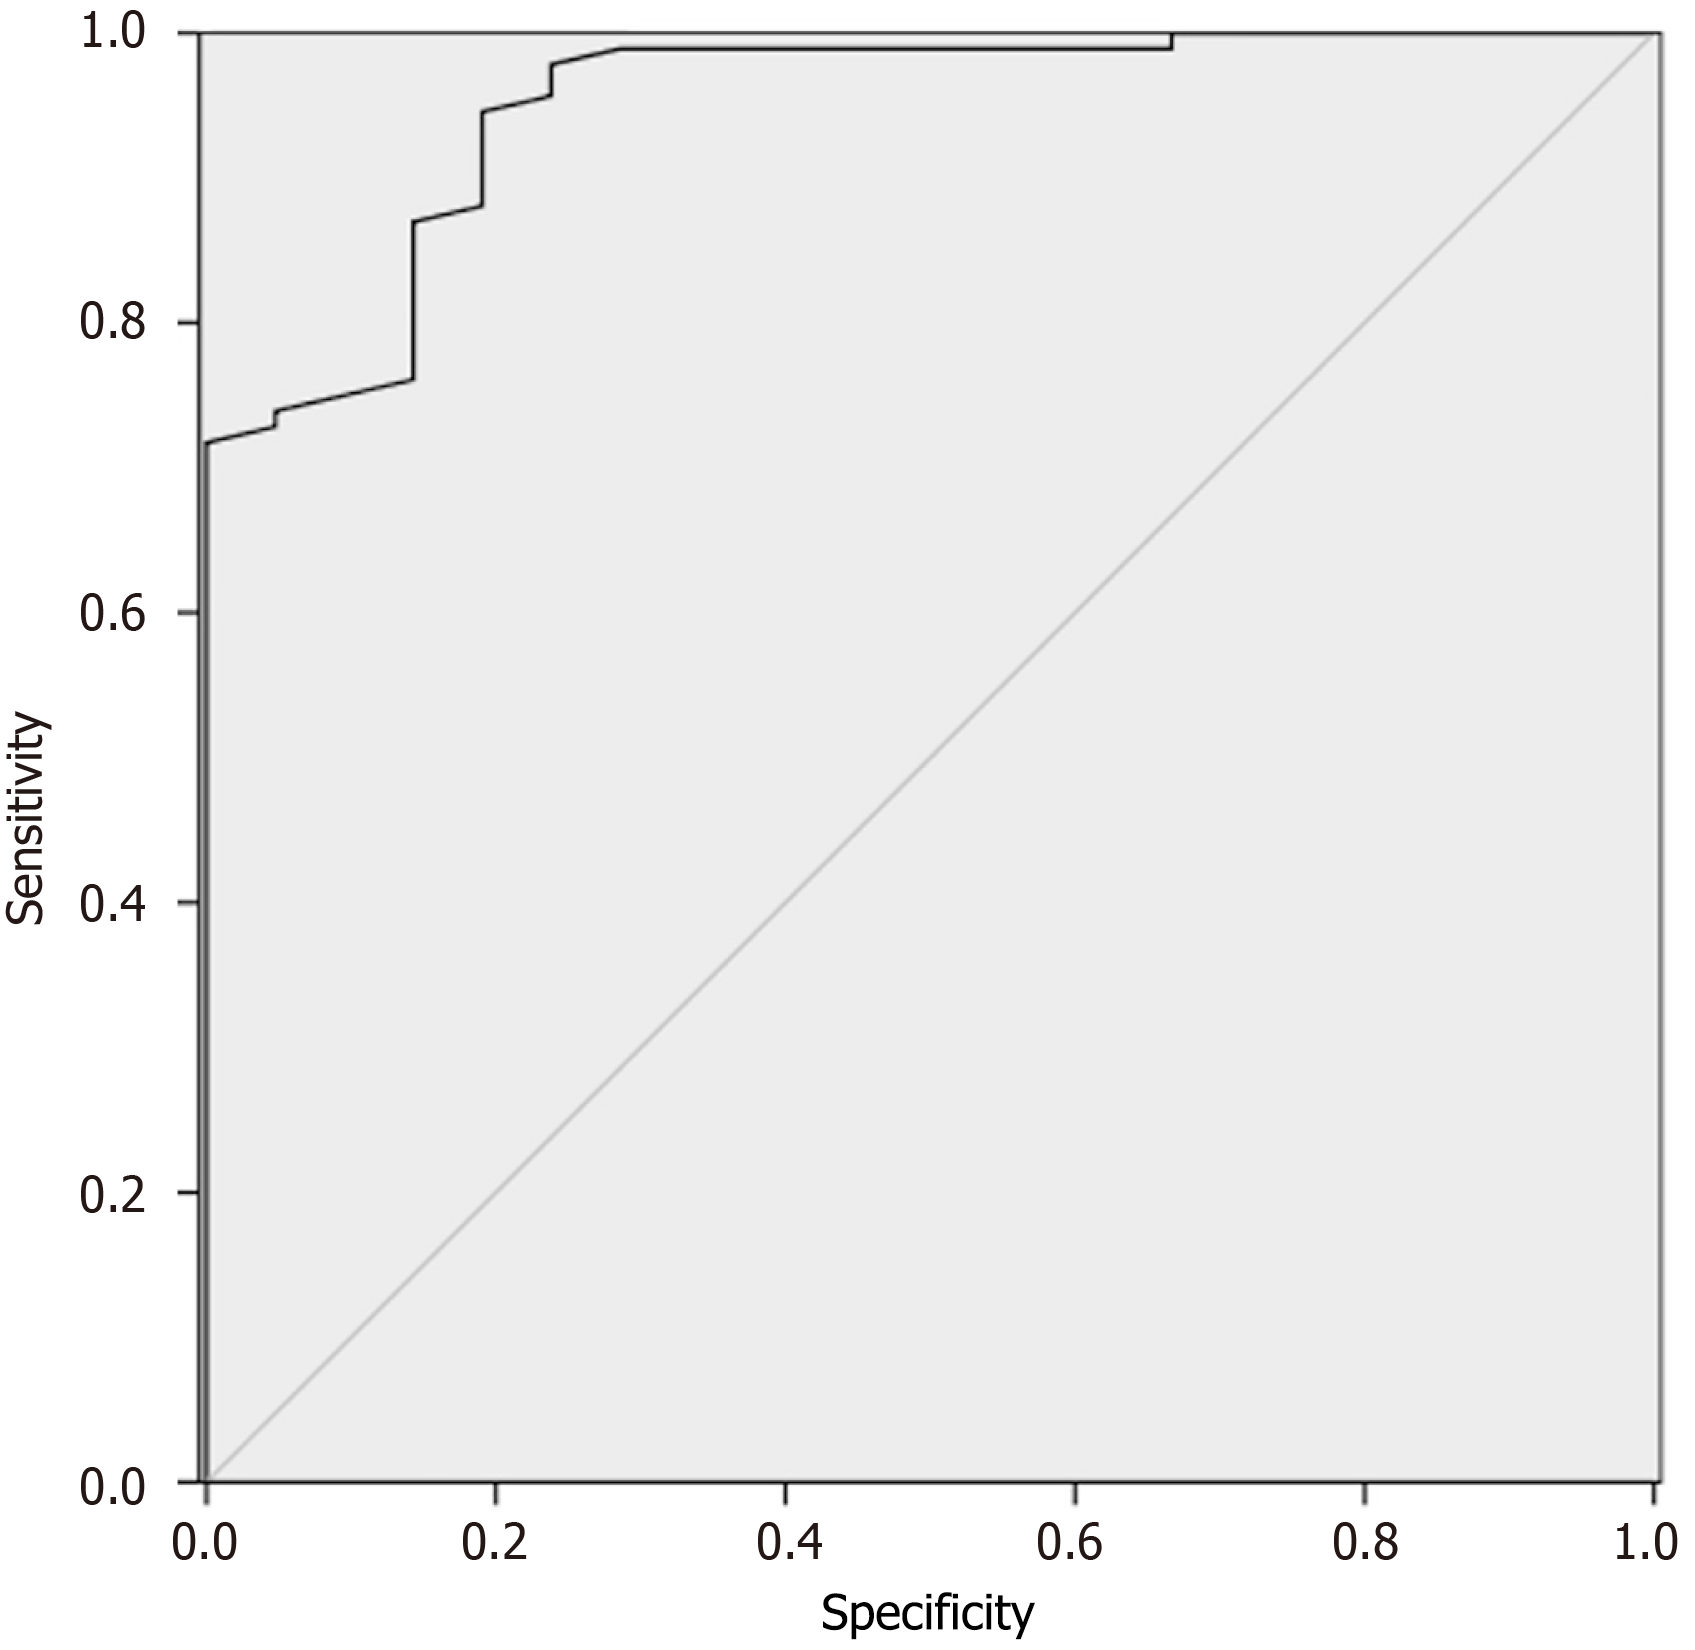
Figure 3 Receiver operating characteristic curve analysis of predictive value of the multivariate logistic regression model.
The area under the curve was 0.950.
Figure 4 The manifestations of T4a staging lesion on transabdominal ultrasound, gross specimen, and pathological section.
A: An angle sign on ultrasound showed the significantly thickened gastric wall (red arrow) and serrated structure (red dotted line) in the gastric angle; B: Gross specimen showed the serrated structure (red dotted line) in the gastric angle; C: Pathological section (× 400) showed that tumor cells invaded the serosa, which was T4a staging.
- Citation: Zhong MY, Jian GL, Ye JY, Liu QX, Huang WJ, Zhen CJ. Clinical characteristics and transabdominal ultrasound features that associated with T3-T4 staging in gastric cancer: A retrospective study. World J Gastrointest Surg 2025; 17(6): 105073
- URL: https://www.wjgnet.com/1948-9366/full/v17/i6/105073.htm
- DOI: https://dx.doi.org/10.4240/wjgs.v17.i6.105073


