Copyright
©The Author(s) 2025.
World J Gastrointest Surg. Jun 27, 2025; 17(6): 104325
Published online Jun 27, 2025. doi: 10.4240/wjgs.v17.i6.104325
Published online Jun 27, 2025. doi: 10.4240/wjgs.v17.i6.104325
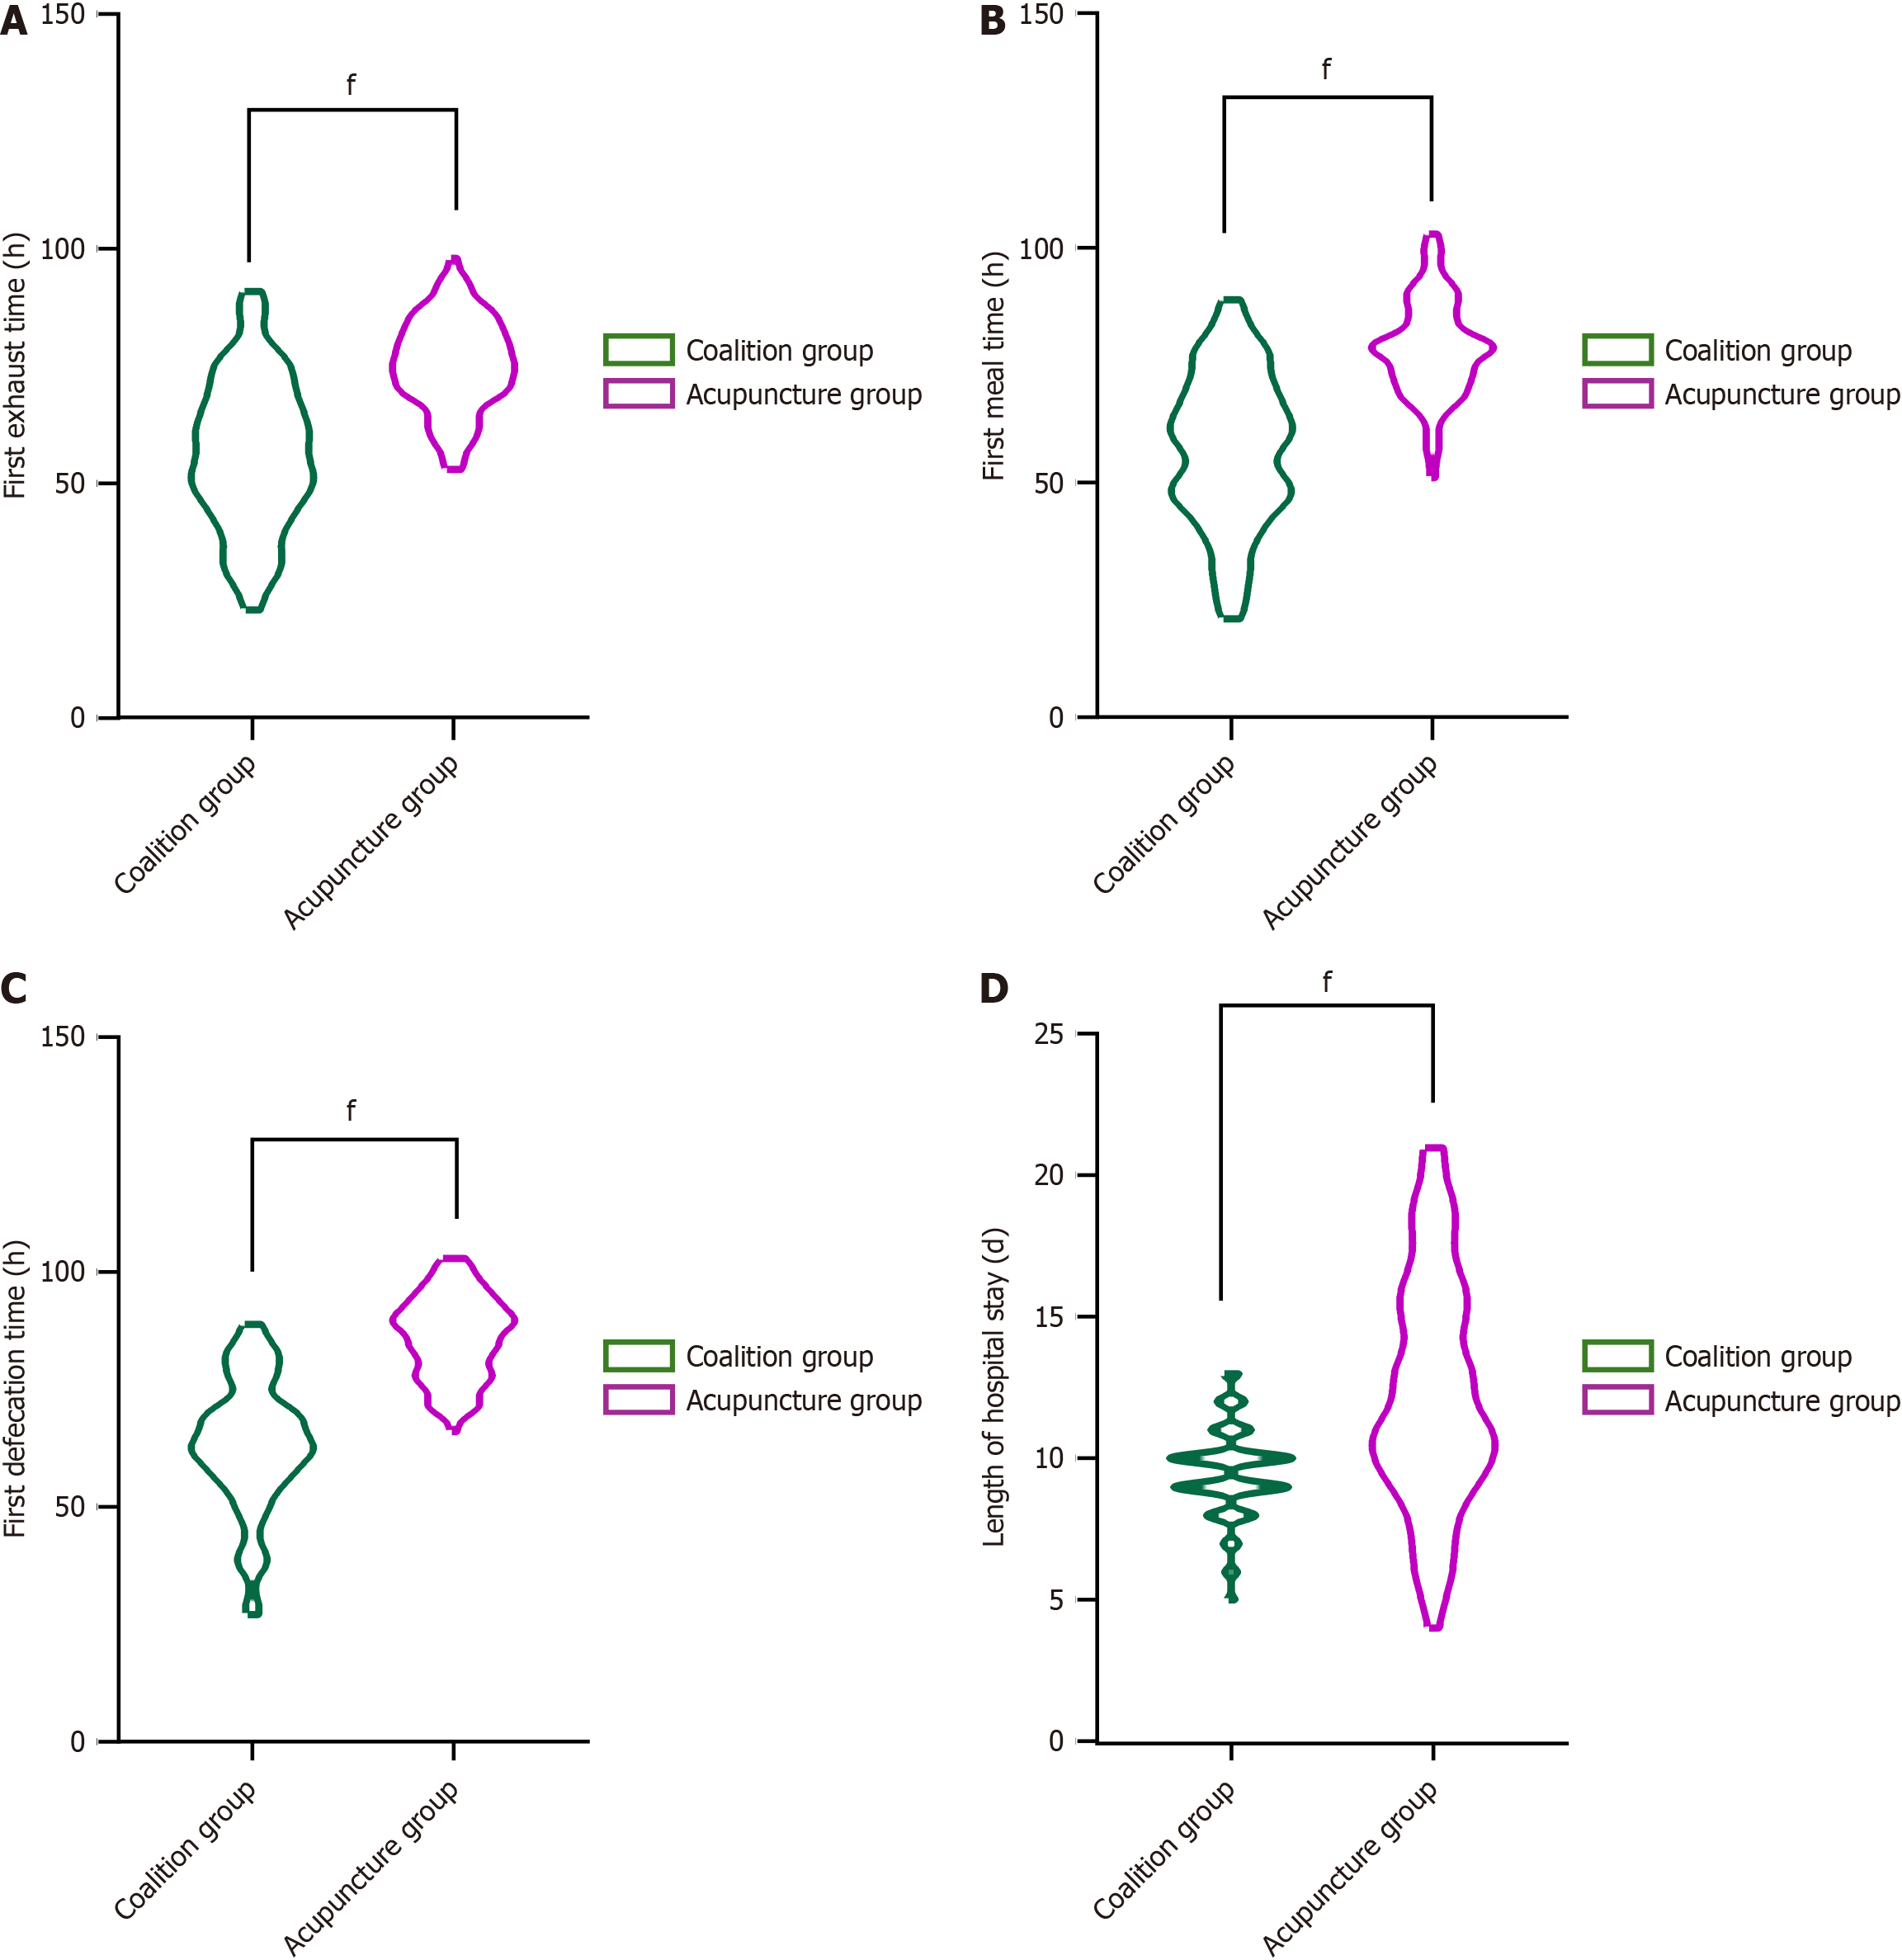
Figure 1 Recovery of gastrointestinal function in the two groups post-treatment.
A: Time of first exhaust; B: Time of first feeding; C: Time of first defecation; D: Length of hospital stay. fP < 0.000001.
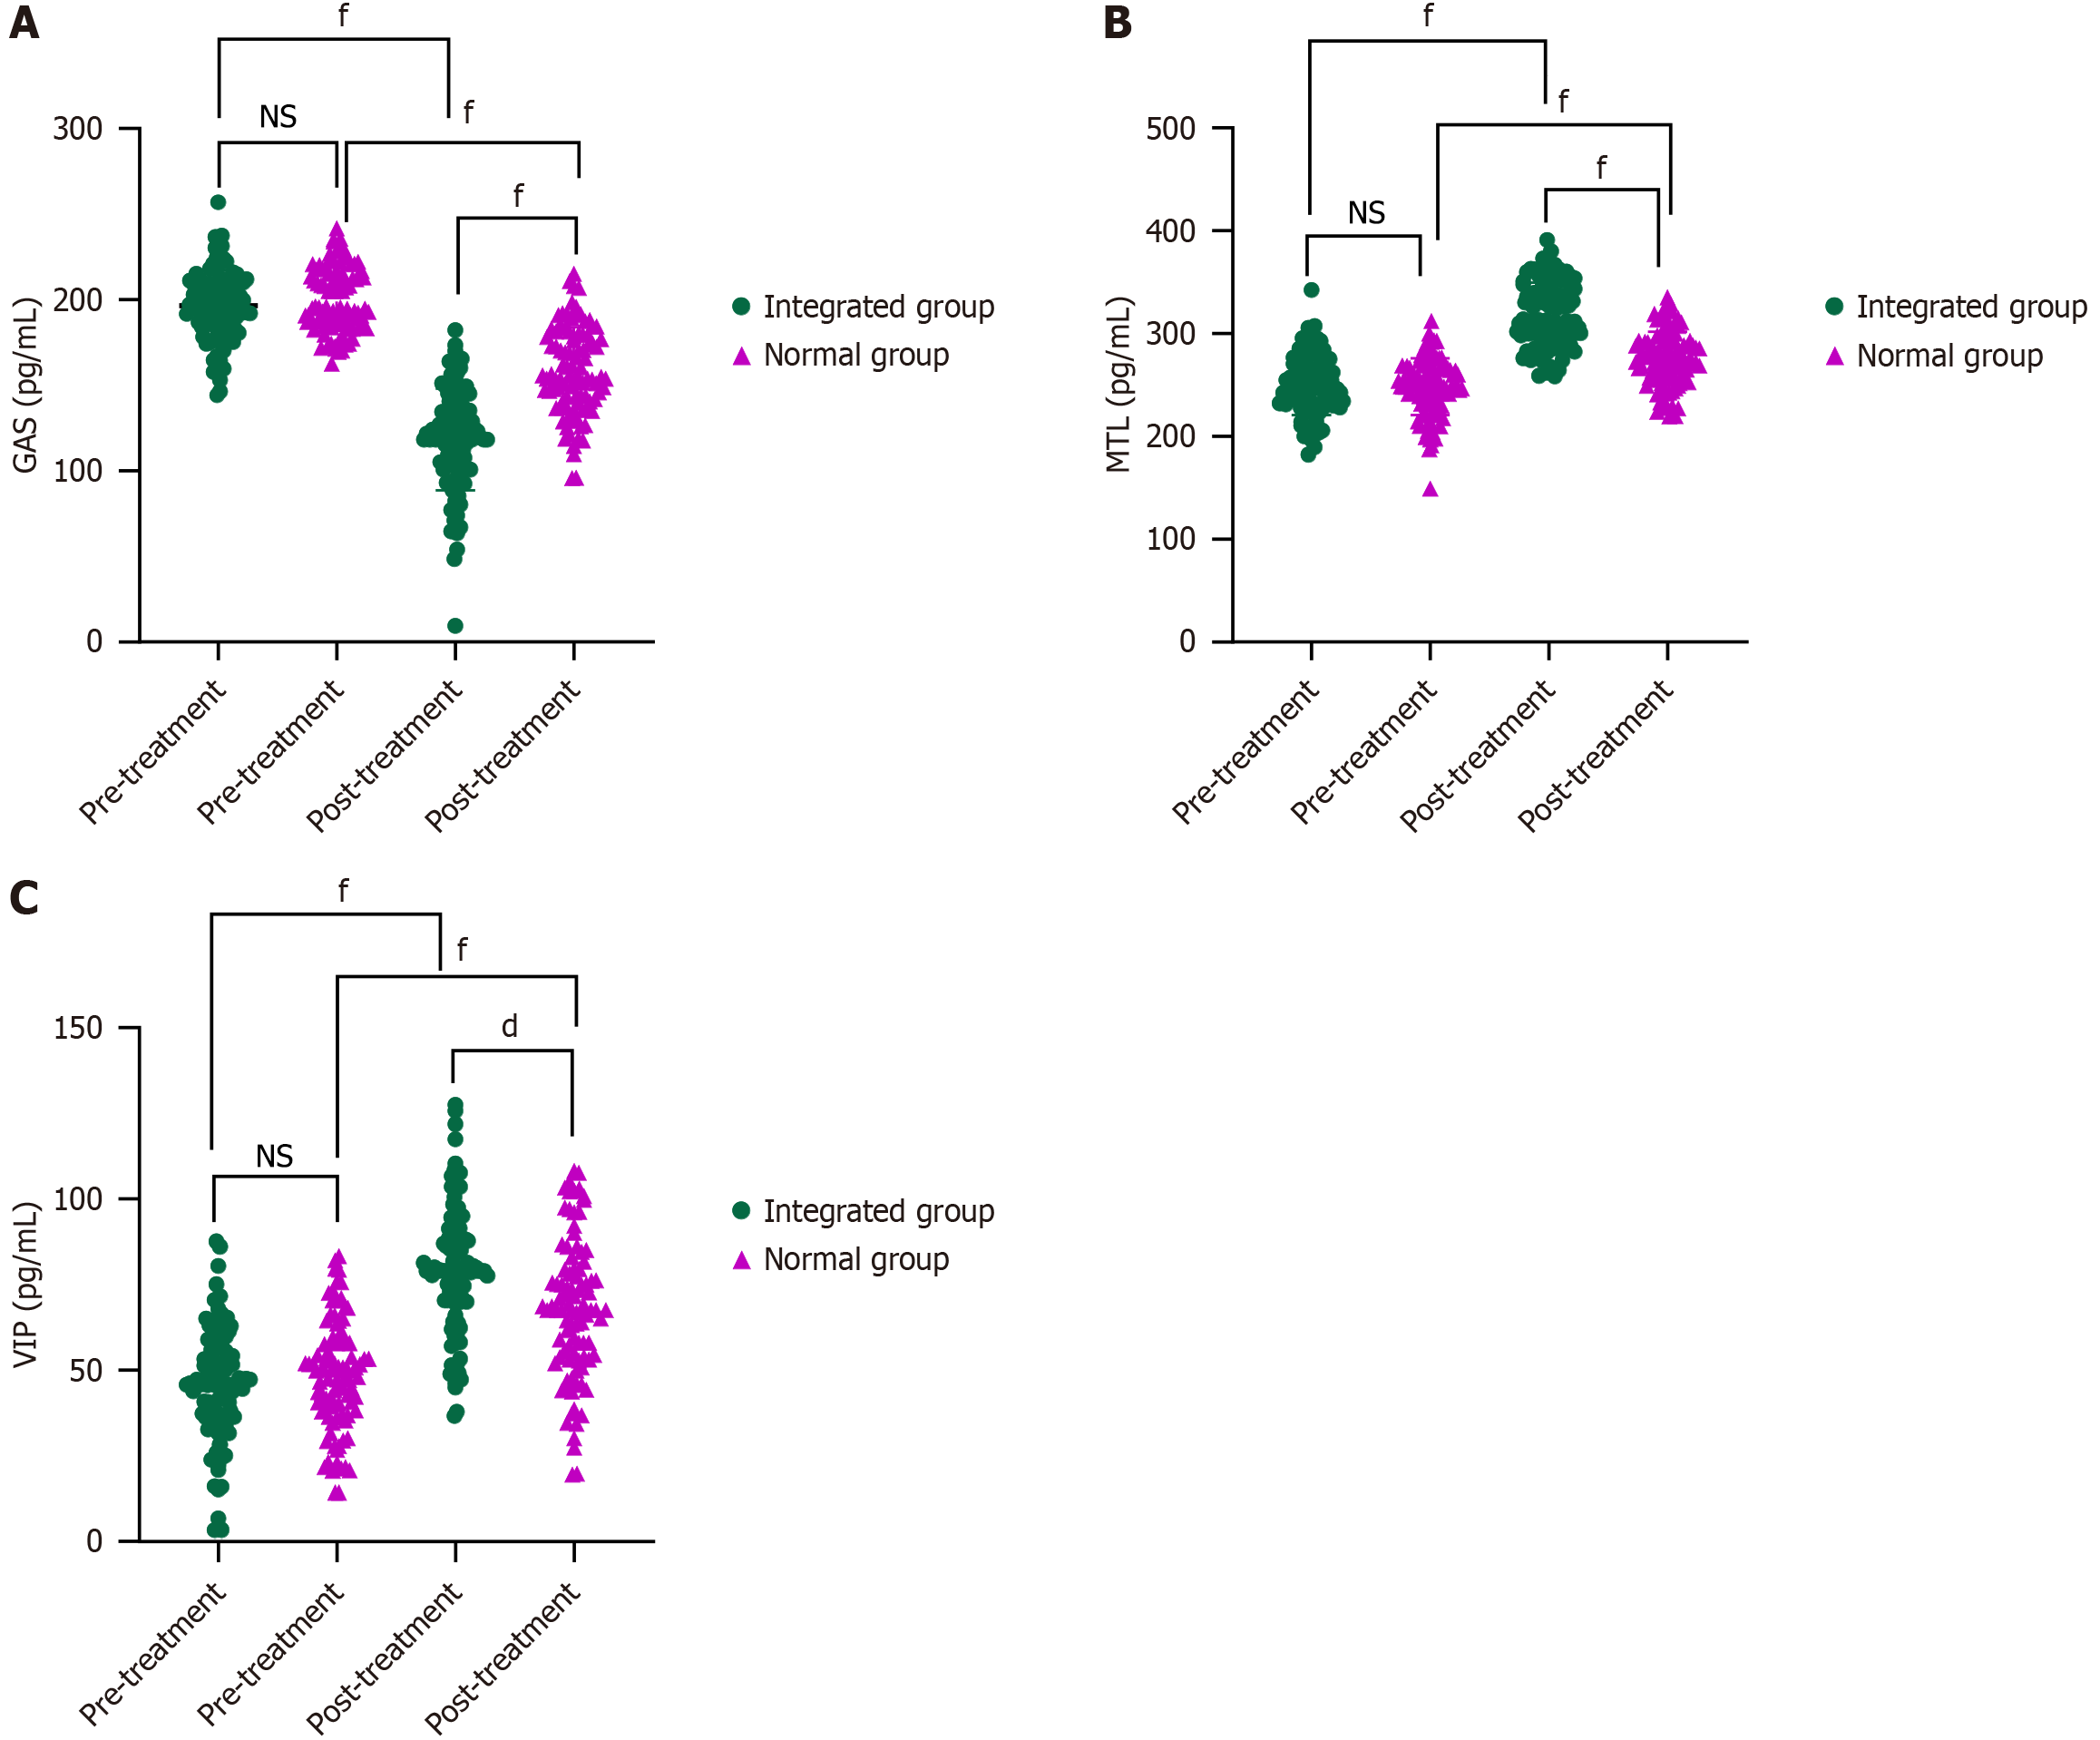
Figure 2 Comparison of gastrointestinal hormone levels between the two groups.
A: Comparison of gastrin (GAS) between the two groups; B: Comparison of motilin (MTL) between the two groups; C: Vasoactive intestinal peptide (VIP) comparison between the two groups. NS: Not significant. dP < 0.0001; fP < 0.000001.
- Citation: Liang C, Qiu FX, Zhang XC, Hu QL. Effects of gastrointestinal motility therapy combined with acupuncture on gastrointestinal function in patients after laparoscopic radical surgery. World J Gastrointest Surg 2025; 17(6): 104325
- URL: https://www.wjgnet.com/1948-9366/full/v17/i6/104325.htm
- DOI: https://dx.doi.org/10.4240/wjgs.v17.i6.104325


