Copyright
©The Author(s) 2024.
World J Gastrointest Surg. Apr 27, 2024; 16(4): 1165-1175
Published online Apr 27, 2024. doi: 10.4240/wjgs.v16.i4.1165
Published online Apr 27, 2024. doi: 10.4240/wjgs.v16.i4.1165
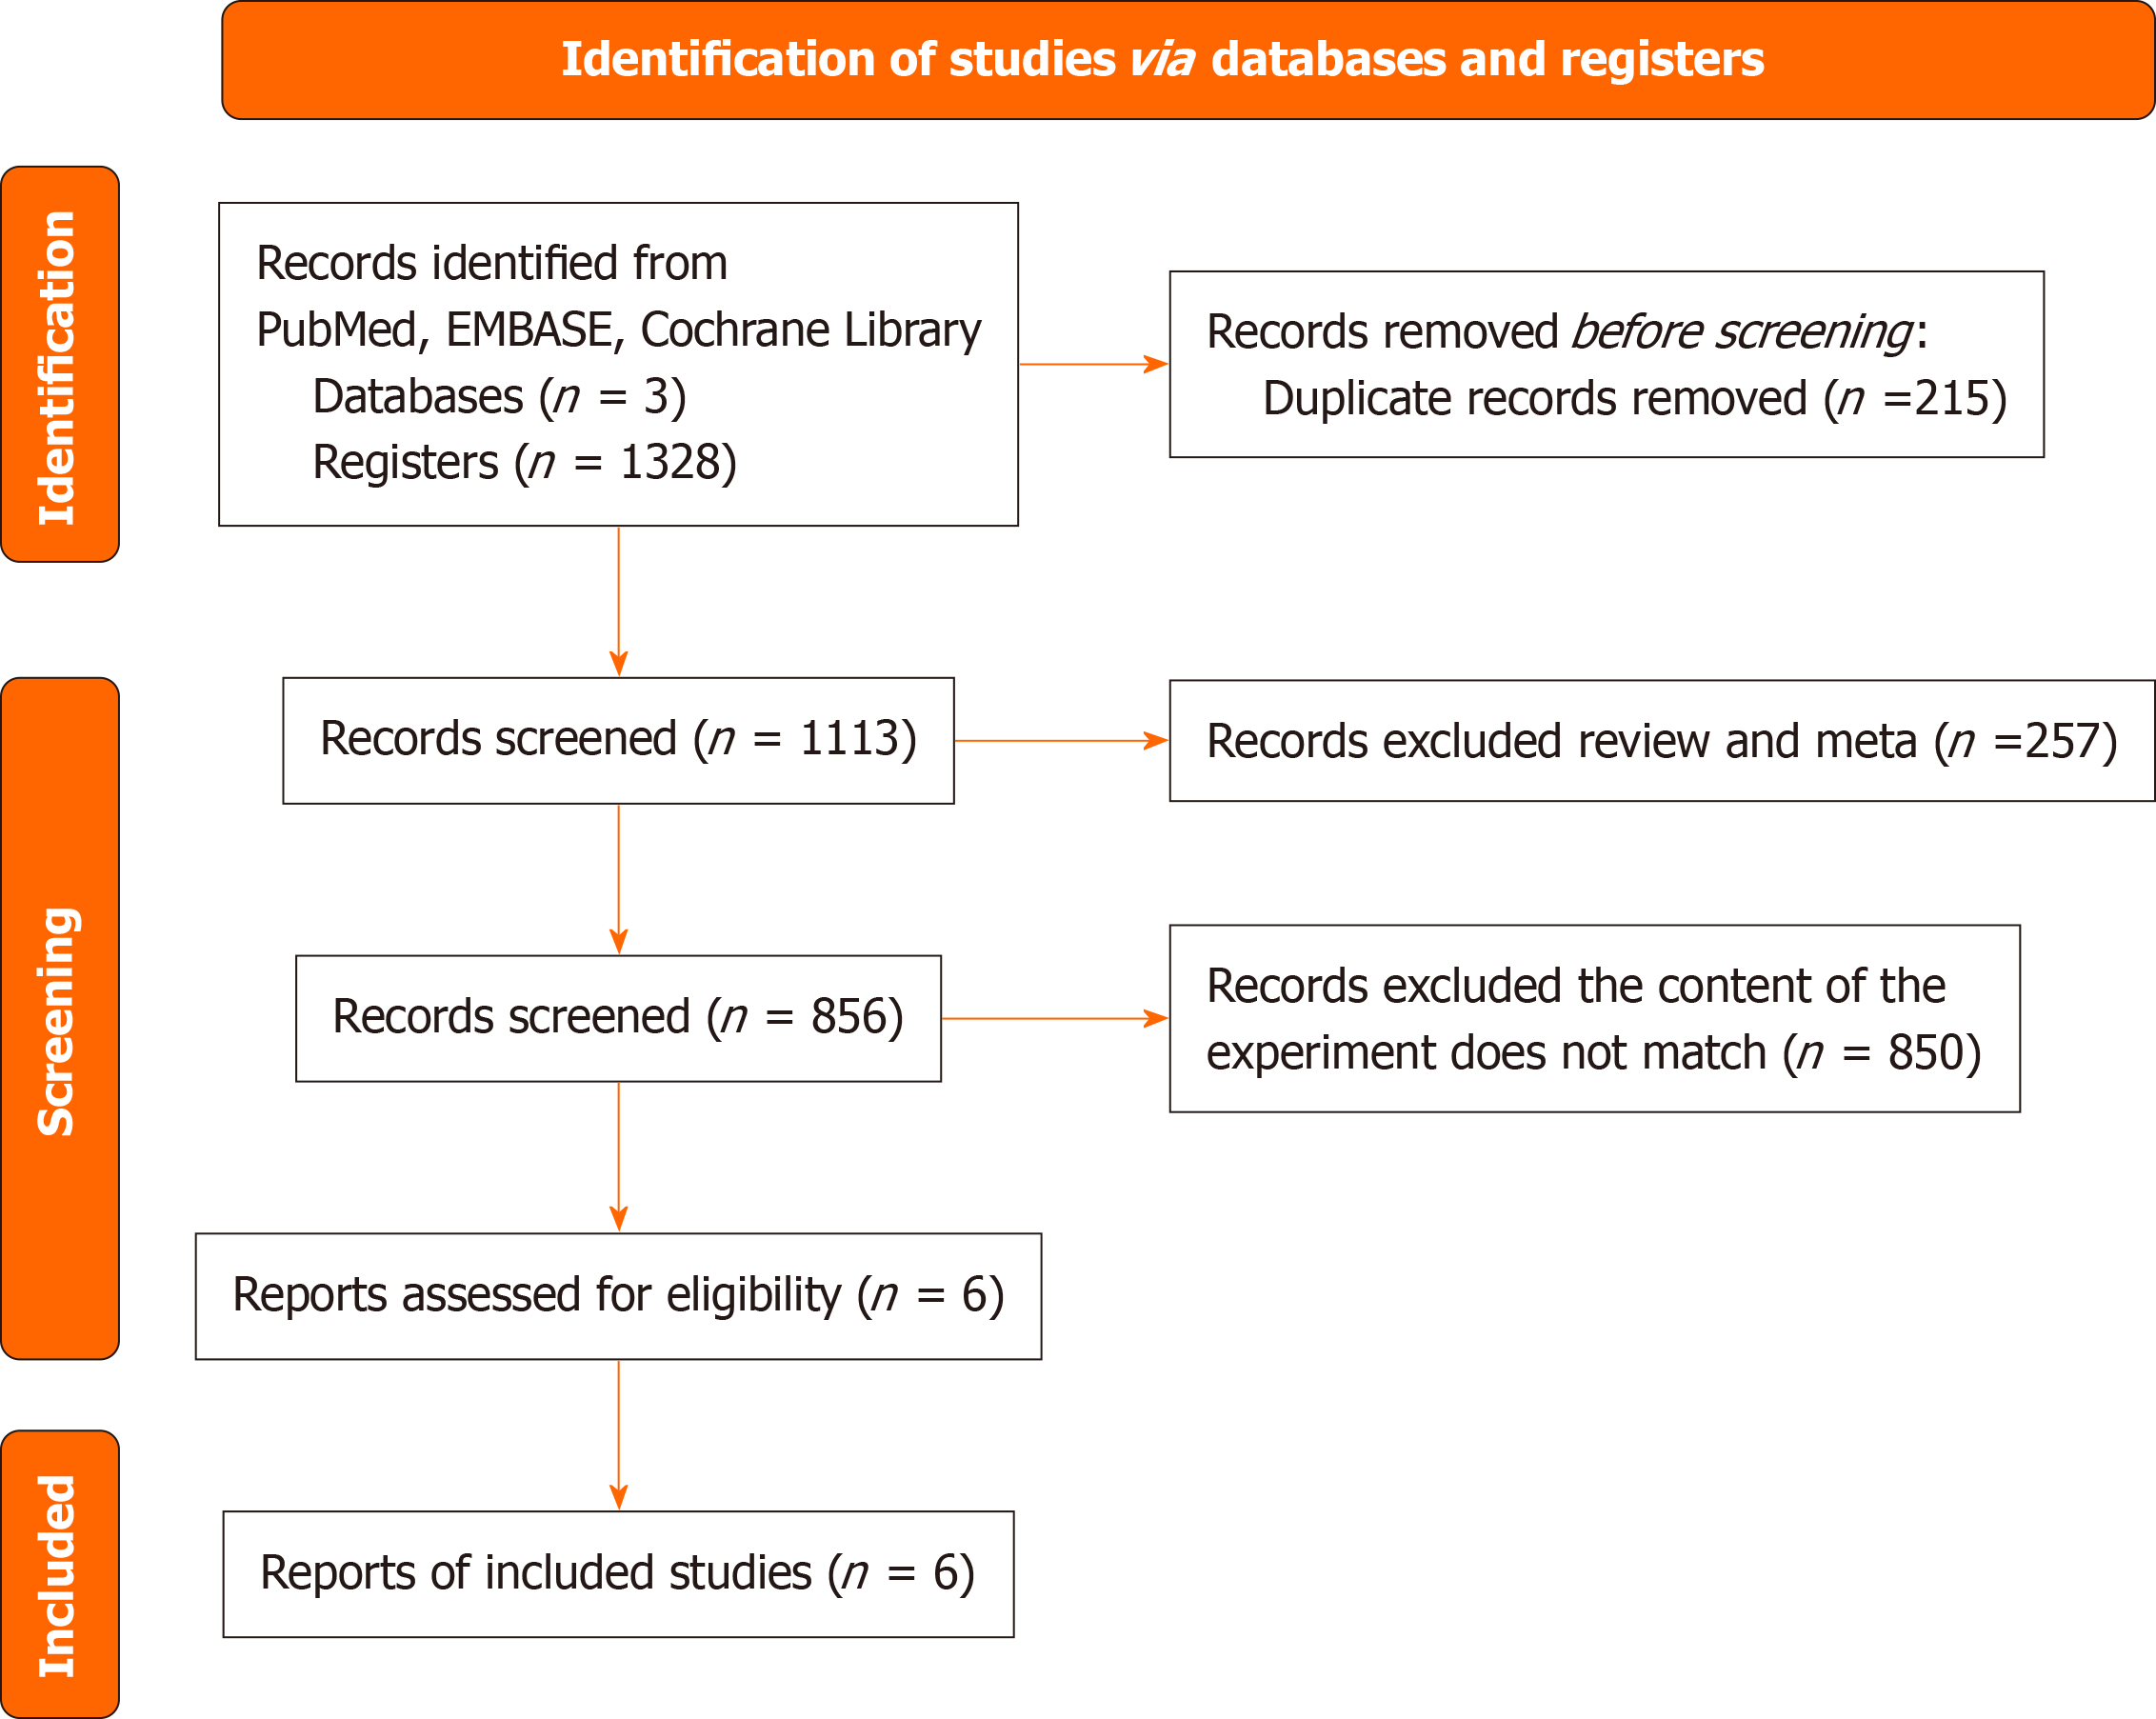
Figure 1 PRISMA flow diagram.
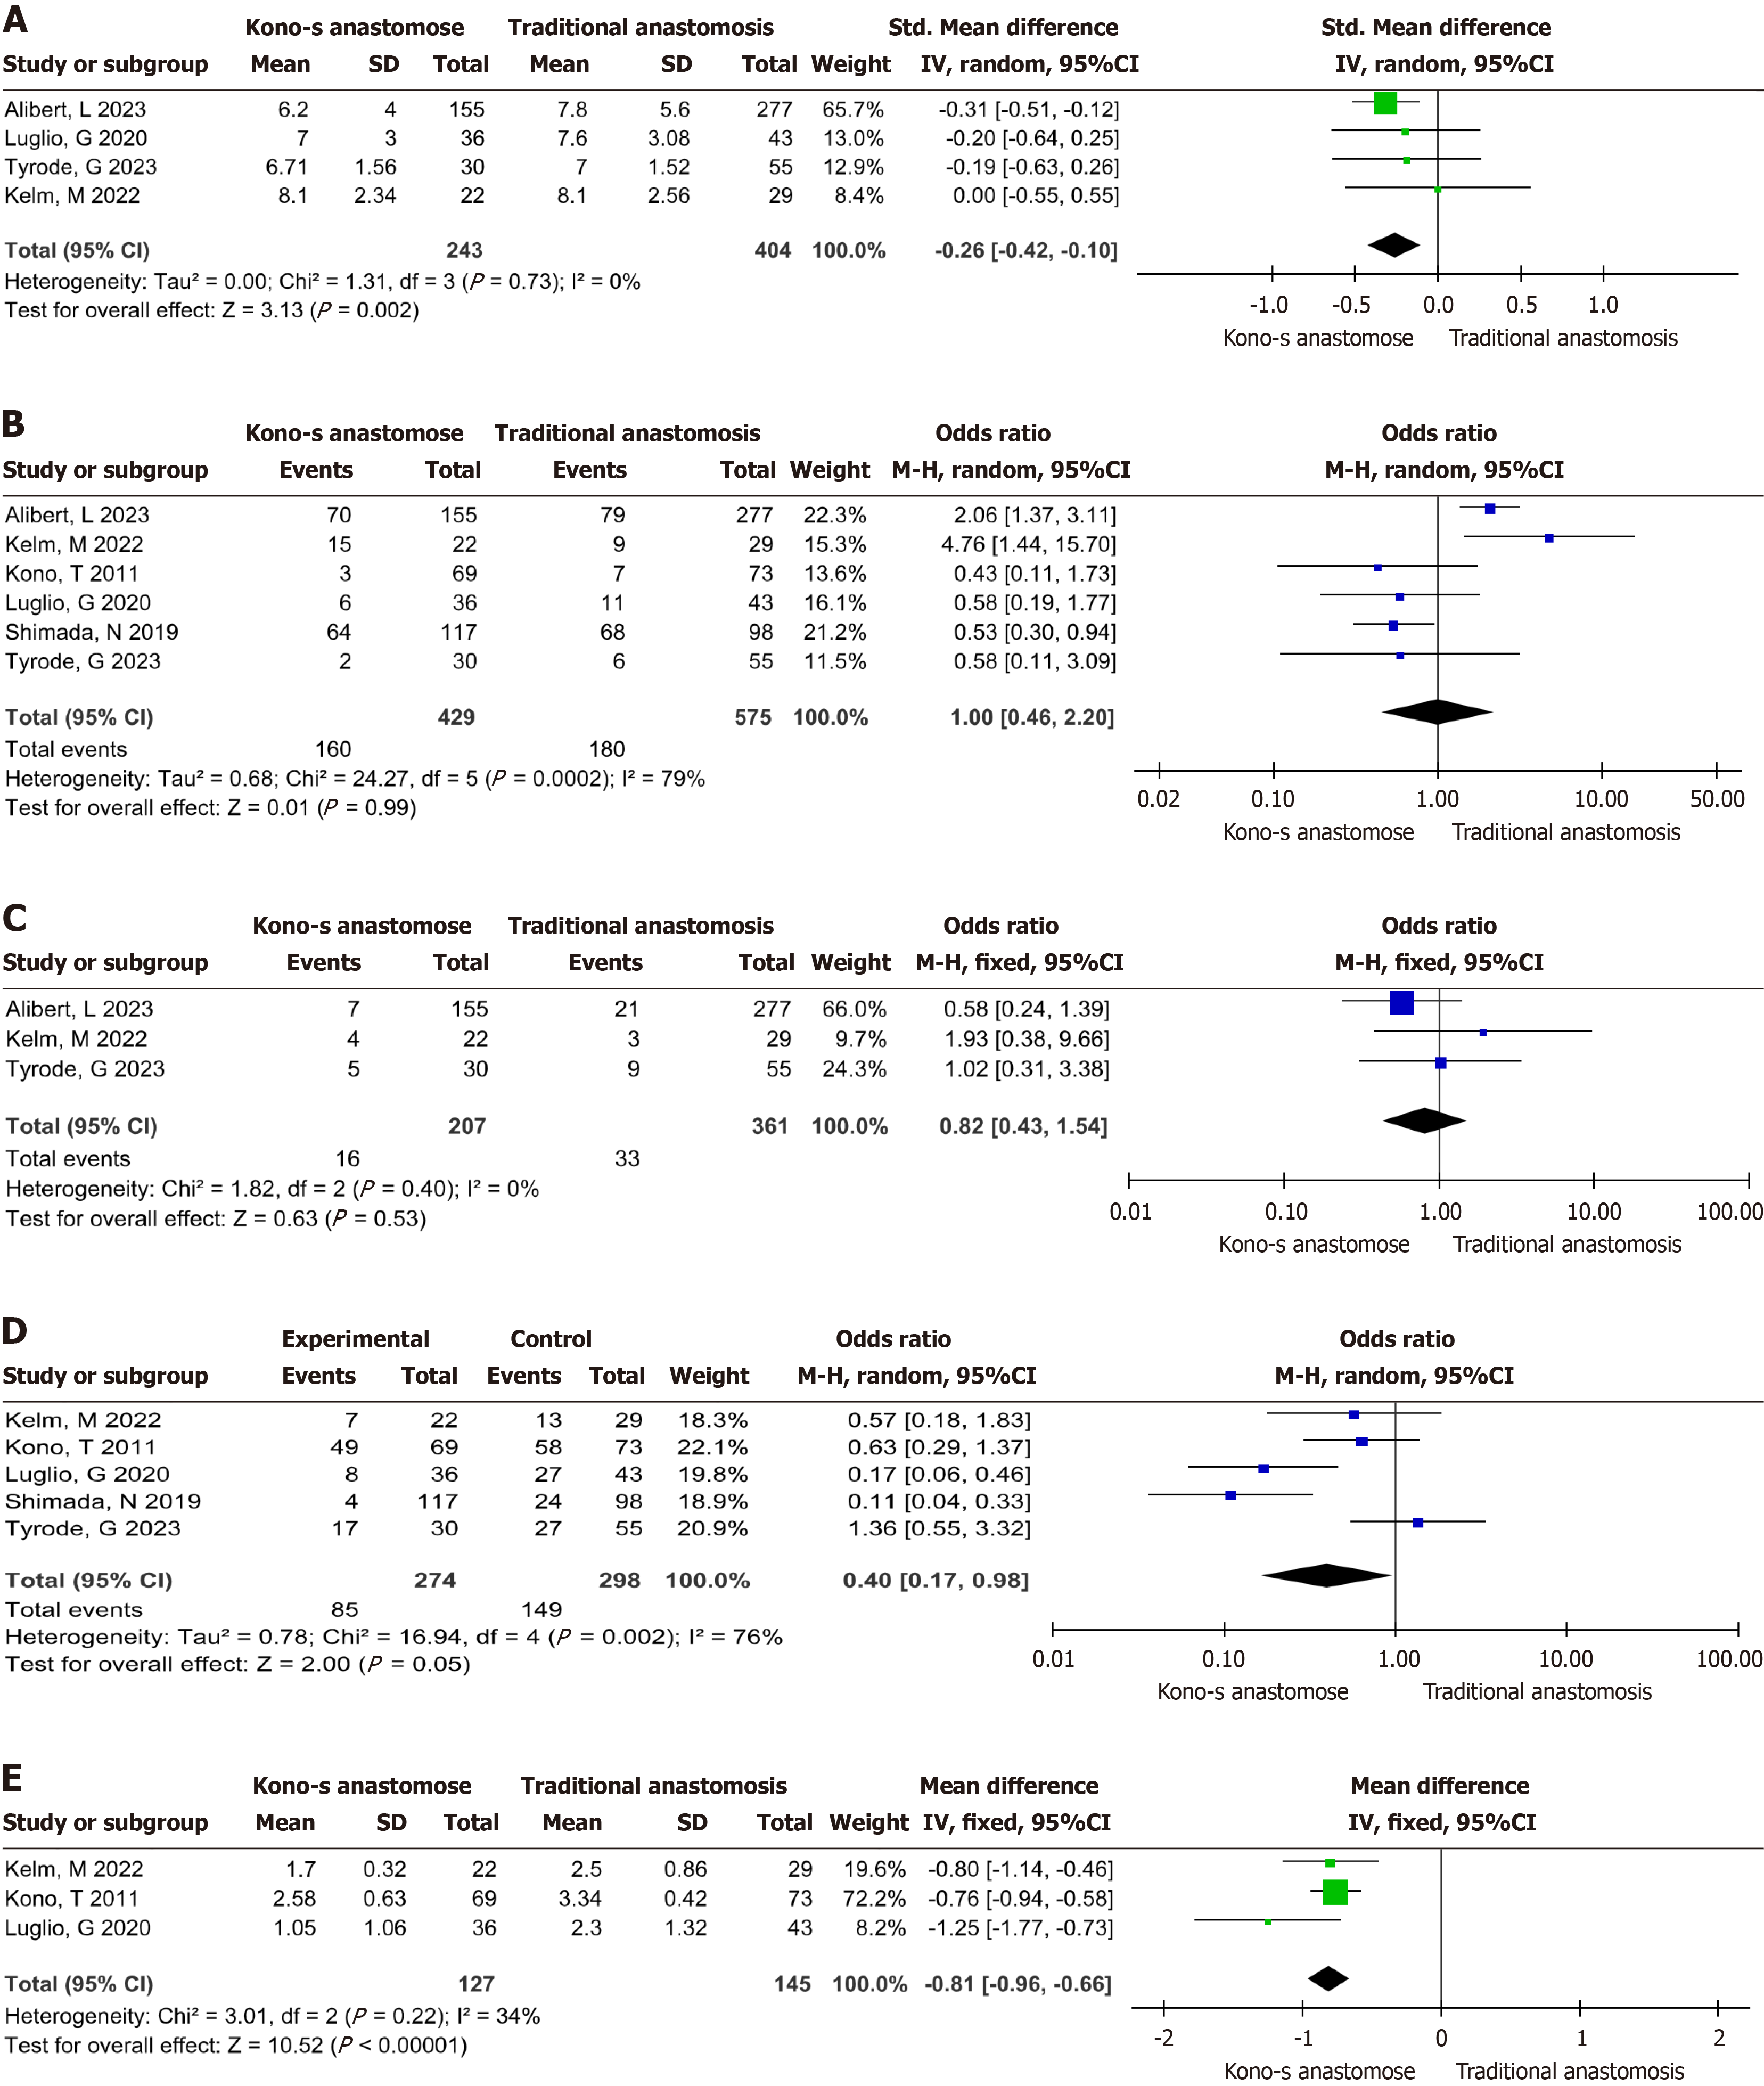
Figure 2 Meta-analysis forest plot.
A: Hospital stay; B: Total incidence of postoperative complications; C: Proportion of Clavien-Dindo greater than IIIa; D: Total postoperative recurrence rate; E: Rutgeerts score.
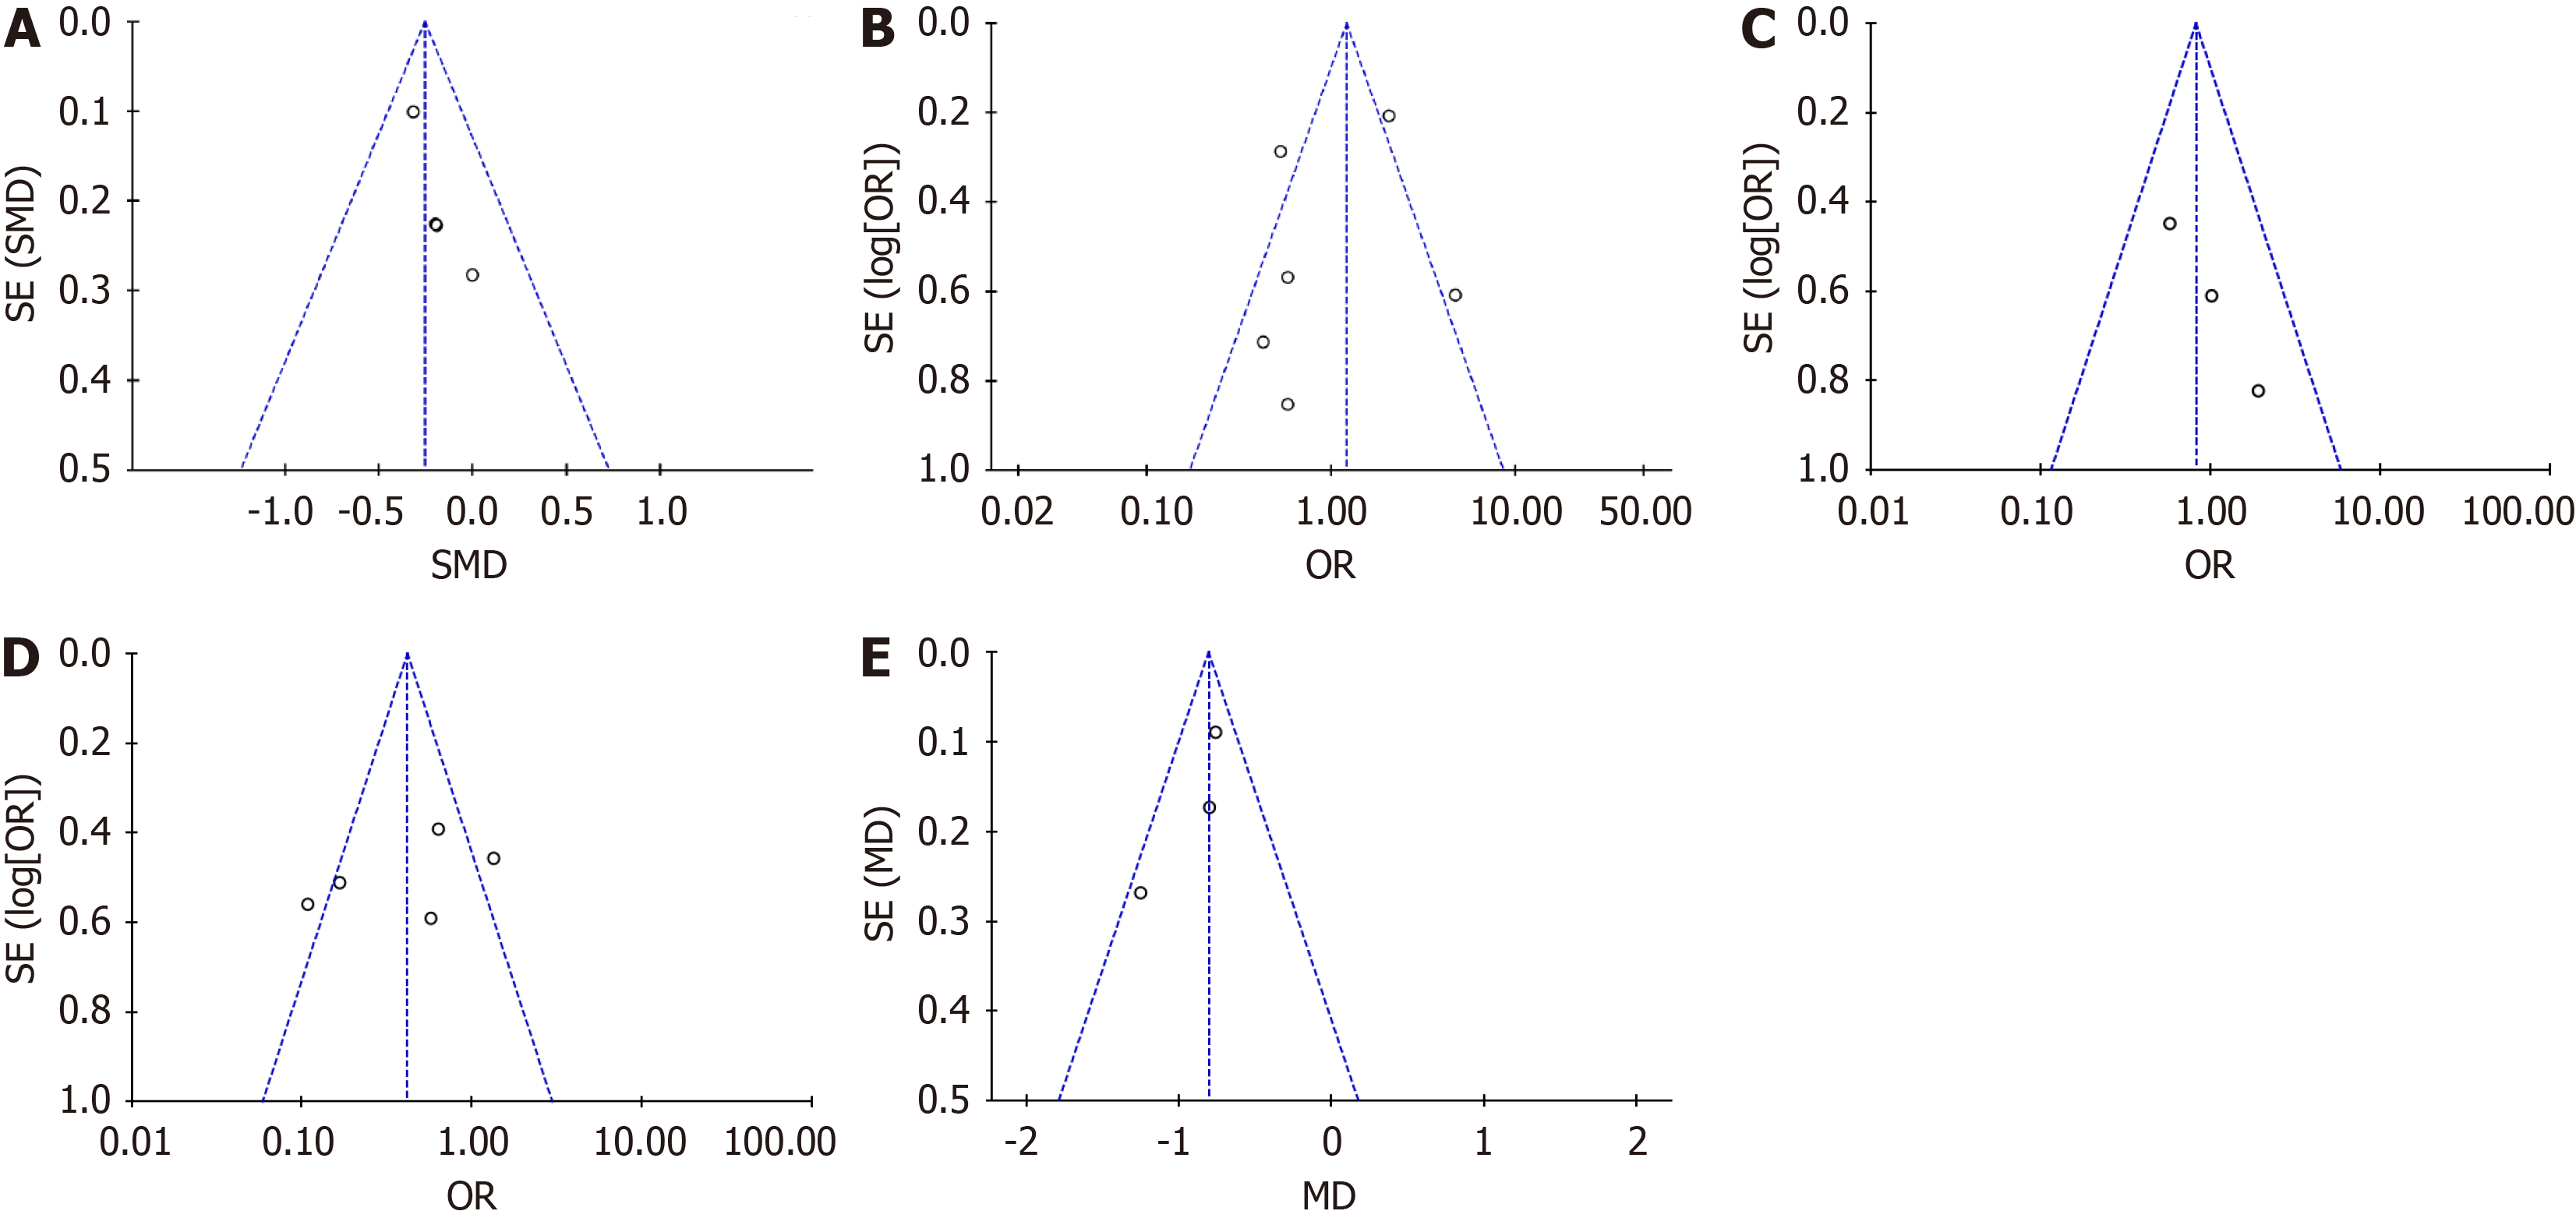
Figure 3 Literature publication bias evaluation chart.
A: Hospital stay; B: Total incidence of postoperative complications; C: Proportion of Clavien-Dindo greater than IIIa; D: Total postoperative recurrence rate; E: Rutgeerts score.
- Citation: Wang ZZ, Zhao CH, Shen H, Dai GP. Impact of different anastomosis methods on post-recurrence after intestinal resection for Crohn's disease: A meta-analysis. World J Gastrointest Surg 2024; 16(4): 1165-1175
- URL: https://www.wjgnet.com/1948-9366/full/v16/i4/1165.htm
- DOI: https://dx.doi.org/10.4240/wjgs.v16.i4.1165


