Copyright
©The Author(s) 2024.
World J Gastrointest Surg. Mar 27, 2024; 16(3): 759-767
Published online Mar 27, 2024. doi: 10.4240/wjgs.v16.i3.759
Published online Mar 27, 2024. doi: 10.4240/wjgs.v16.i3.759
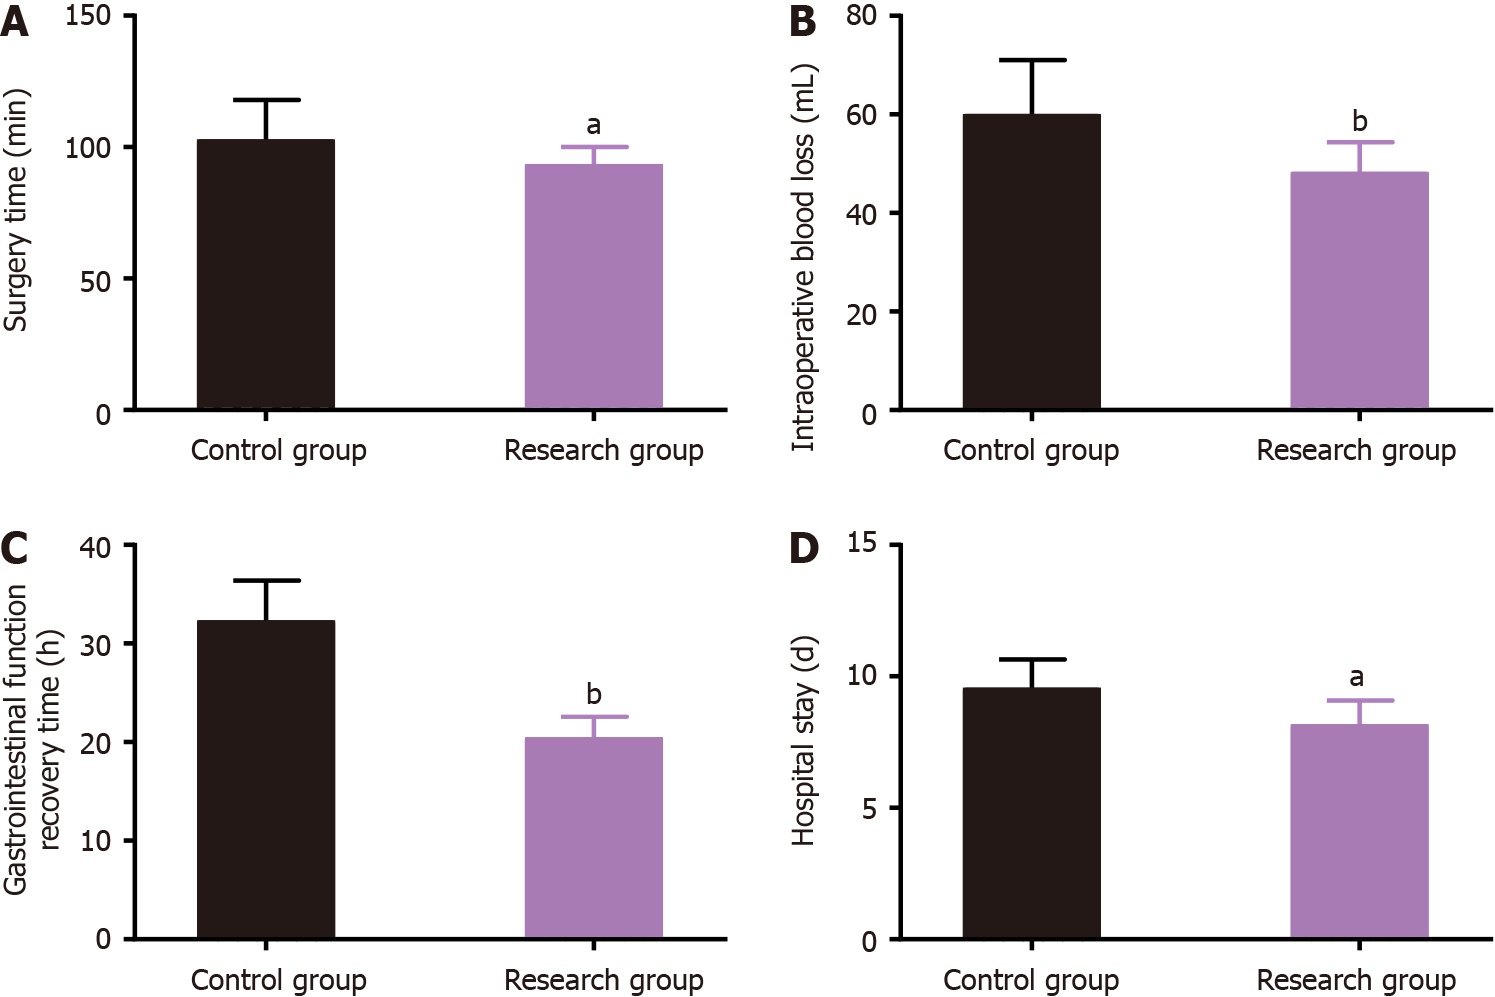
Figure 1 Surgical indices of the two groups.
A: Comparison of surgical times; B: Comparison of intraoperative blood loss volumes; C: Comparison of gastrointestinal function recovery times; D: Comparison of lengths of hospital stay. aP < 0.05 and bP < 0.01 vs the control group.
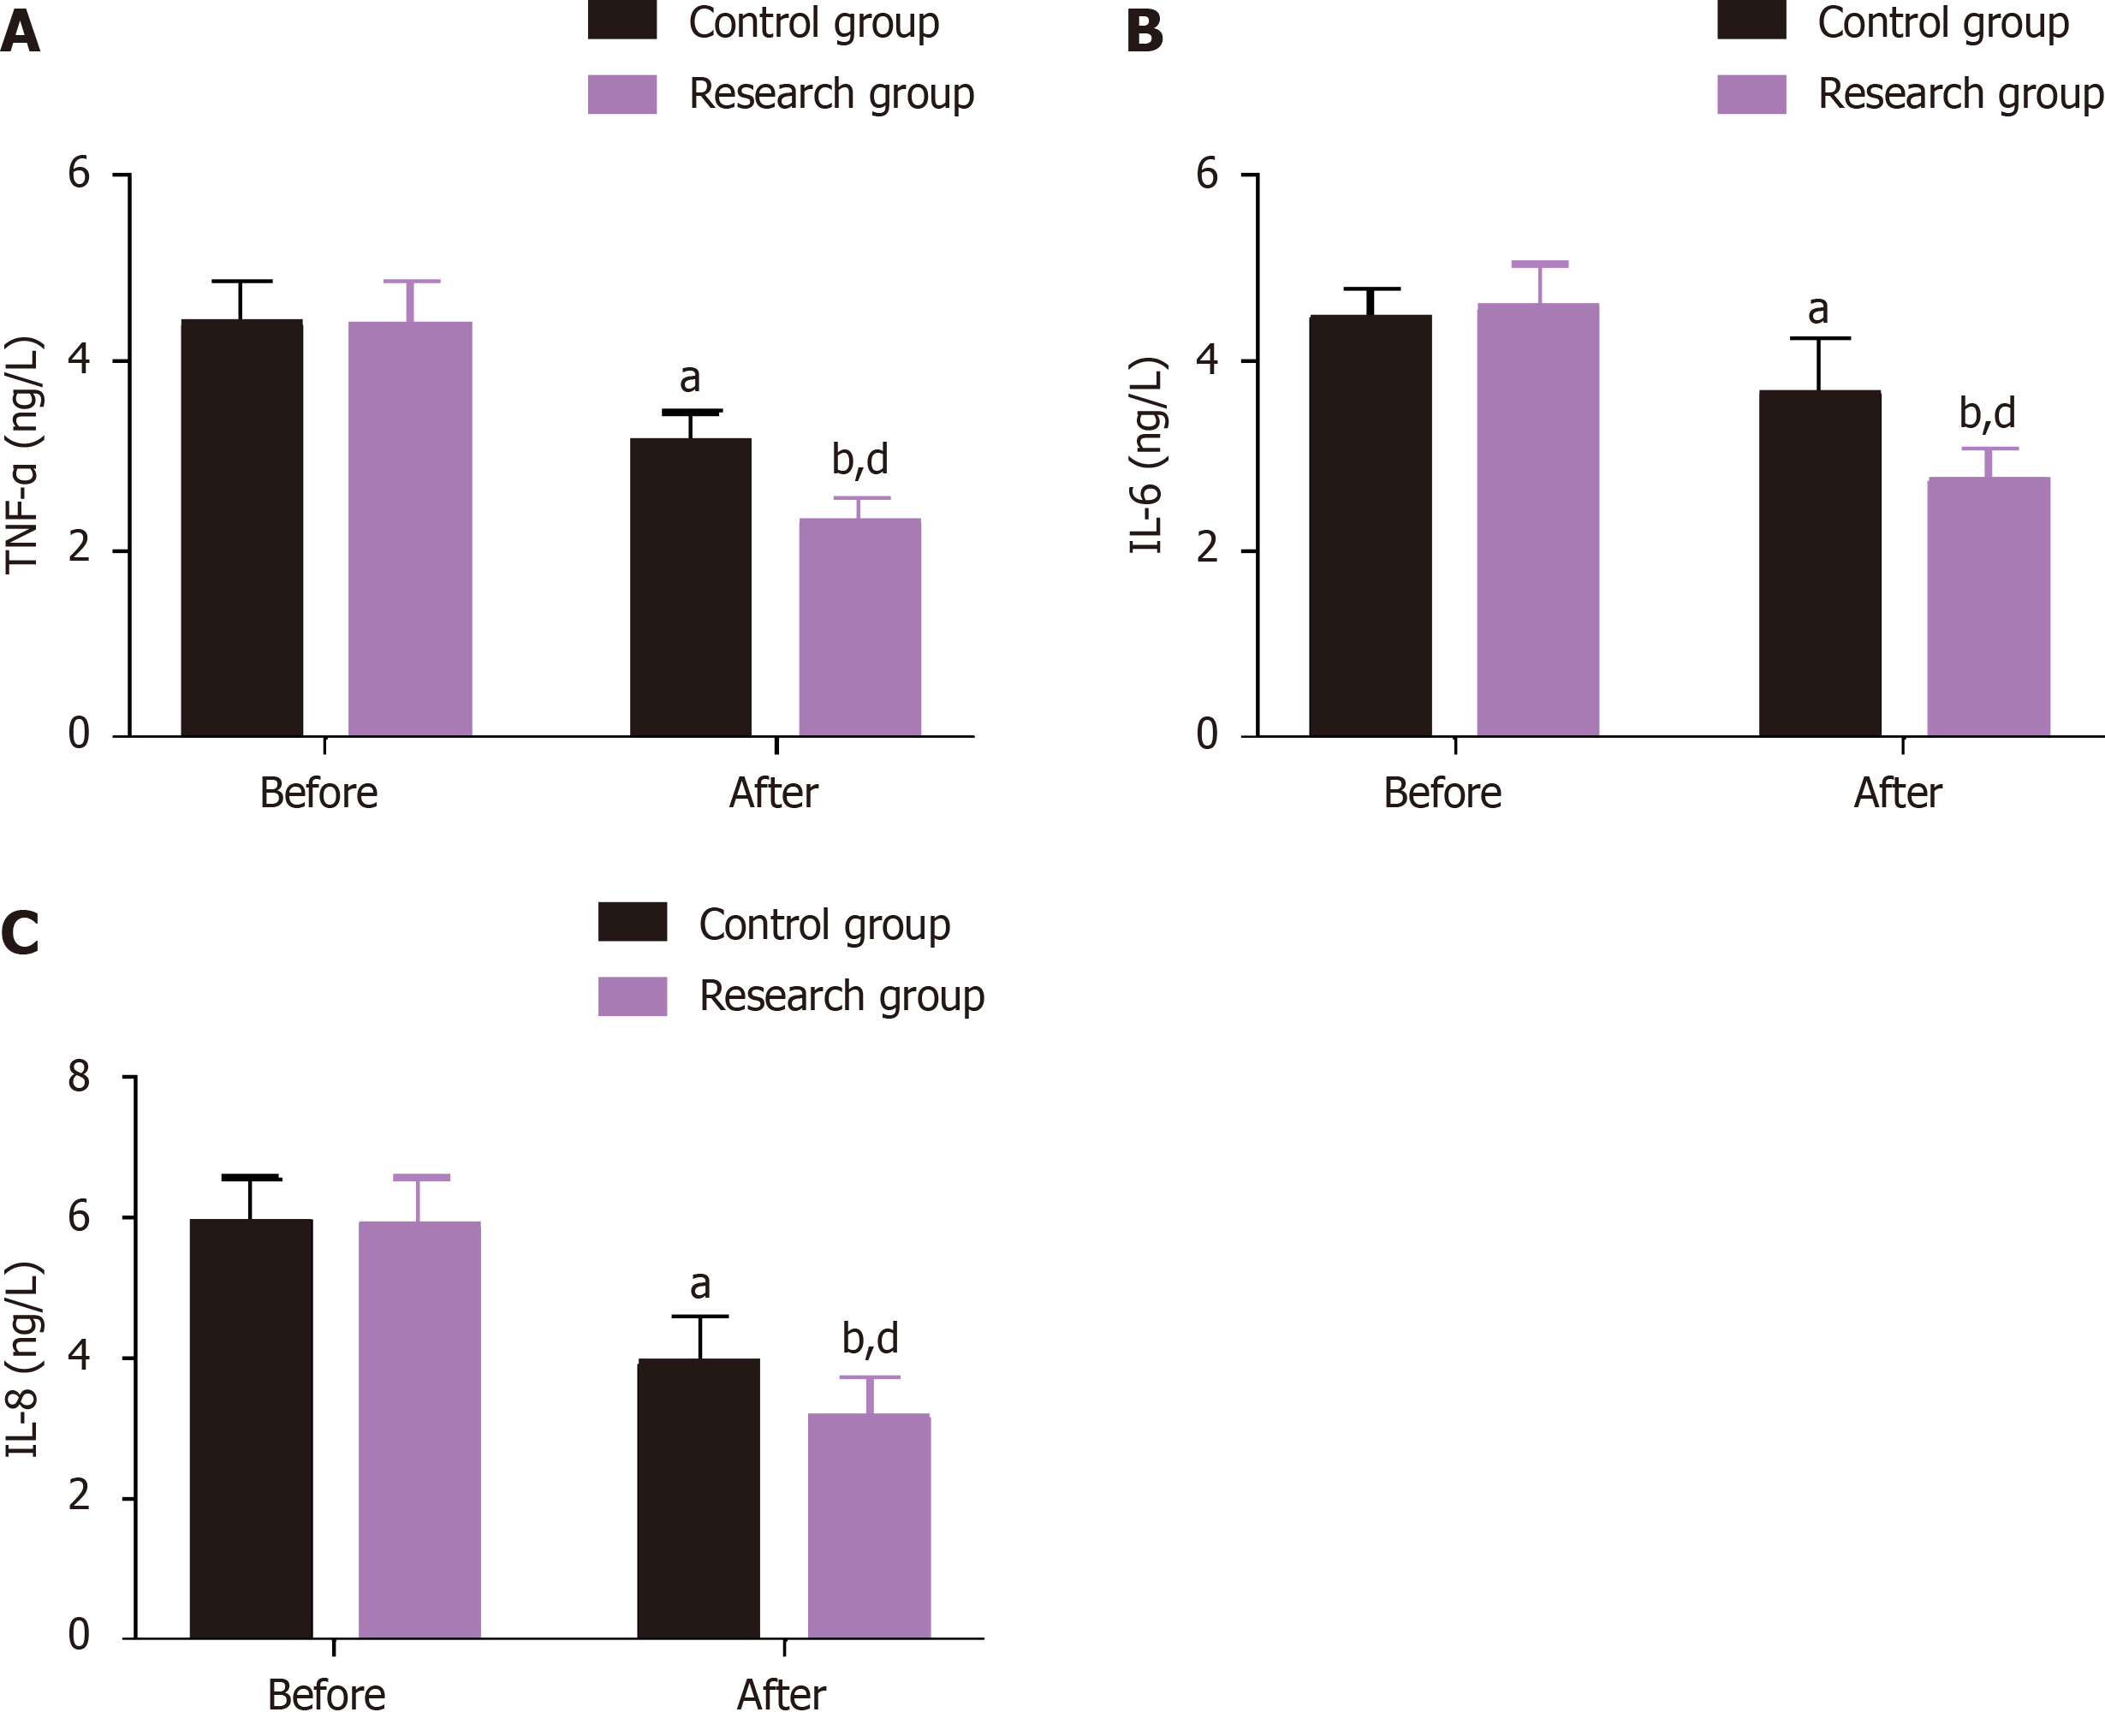
Figure 2 Serum inflammatory marker levels in the two groups.
A: Changes in tumor necrosis factor-α before and after treatment; B: Changes in interleukin (IL)-6 before and after treatment; C: Changes in IL-8 Levels before and after treatment in the two groups. aP < 0.05 and bP < 0.01 vs before treatment; dP < 0.05 vs control group. TNF-α: Tumor necrosis factor-α, IL-6: Interleukin-6.
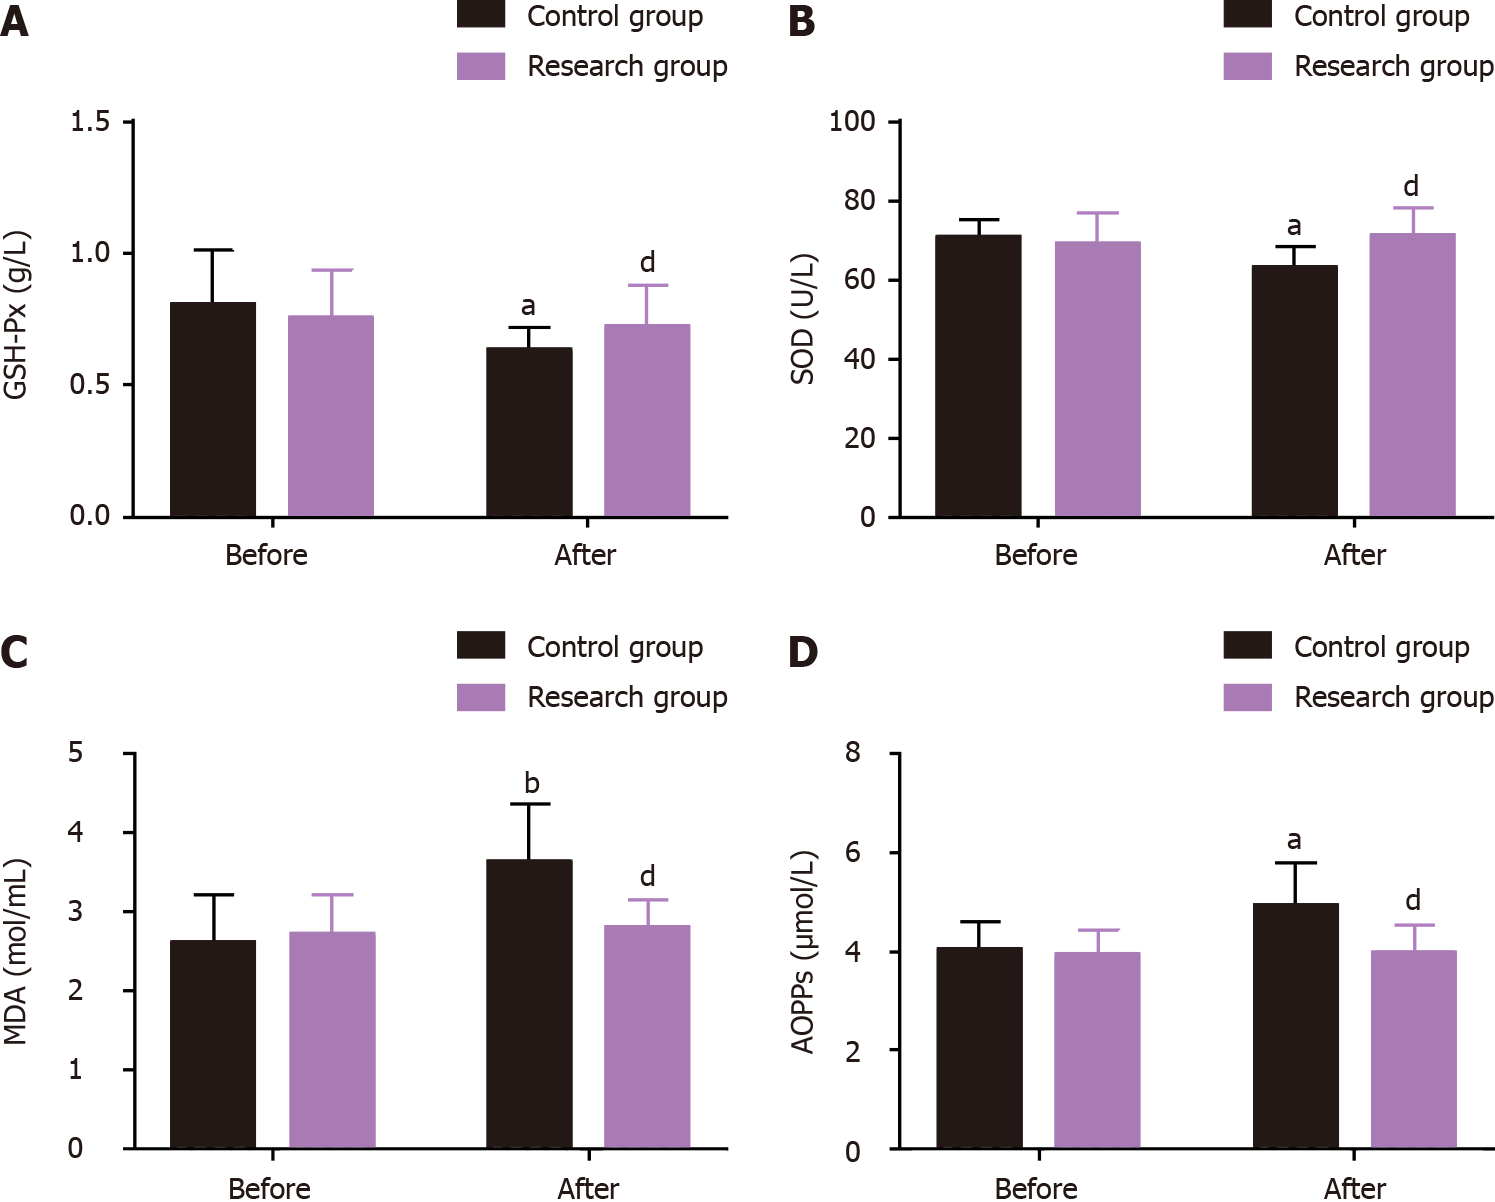
Figure 3 Oxidative stress indices of the two groups.
A: Changes in glutathione peroxidase in the two groups before and after treatment; B: Changes in superoxide dismutase activity in the two groups before and after treatment; C: Changes in malondialdehyde levels before and after treatment in the two groups; D: Changes in the advanced protein oxidation products concentration before and after treatment in the two groups. aP < 0.05 and bP < 0.01 vs before treatment; dP < 0.05 vs control group. GSH-Px: Glutathione peroxidase; SOD: Superoxide dismutase; MDA: Malondialdehyde; AOPPs: Advanced protein oxidation products.
- Citation: Wang W, Xia H, Dai B. Comparison of the clinical effects of dual-modality endoscopy and traditional laparotomy for the treatment of intra- and extrahepatic bile duct stones. World J Gastrointest Surg 2024; 16(3): 759-767
- URL: https://www.wjgnet.com/1948-9366/full/v16/i3/759.htm
- DOI: https://dx.doi.org/10.4240/wjgs.v16.i3.759


