Copyright
©The Author(s) 2024.
World J Gastrointest Surg. Feb 27, 2024; 16(2): 318-330
Published online Feb 27, 2024. doi: 10.4240/wjgs.v16.i2.318
Published online Feb 27, 2024. doi: 10.4240/wjgs.v16.i2.318
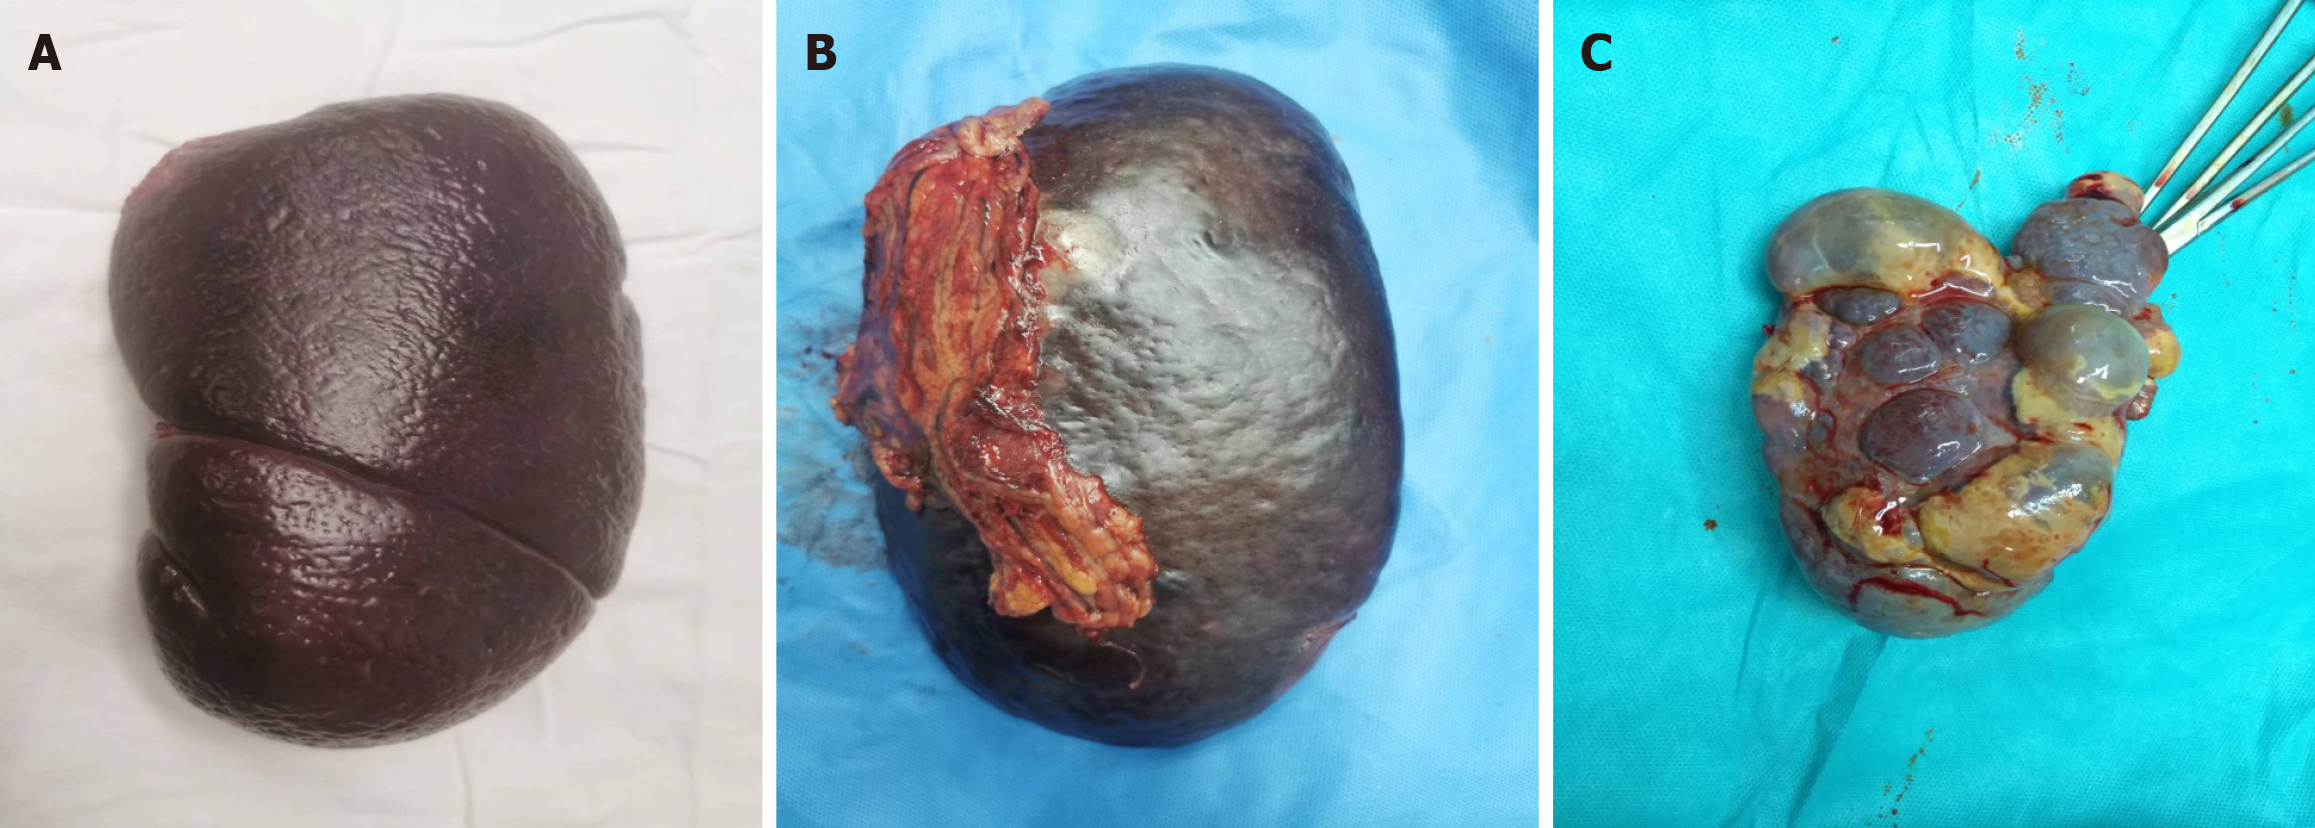
Figure 1 Situation of the spleen with/without partial splenic embolization.
A: Splenomegaly without partial splenic embolization (PSE); B: Adhesion between spleen and omentum with preoperative PSE; C: Splenic infarction with preoperative PSE.
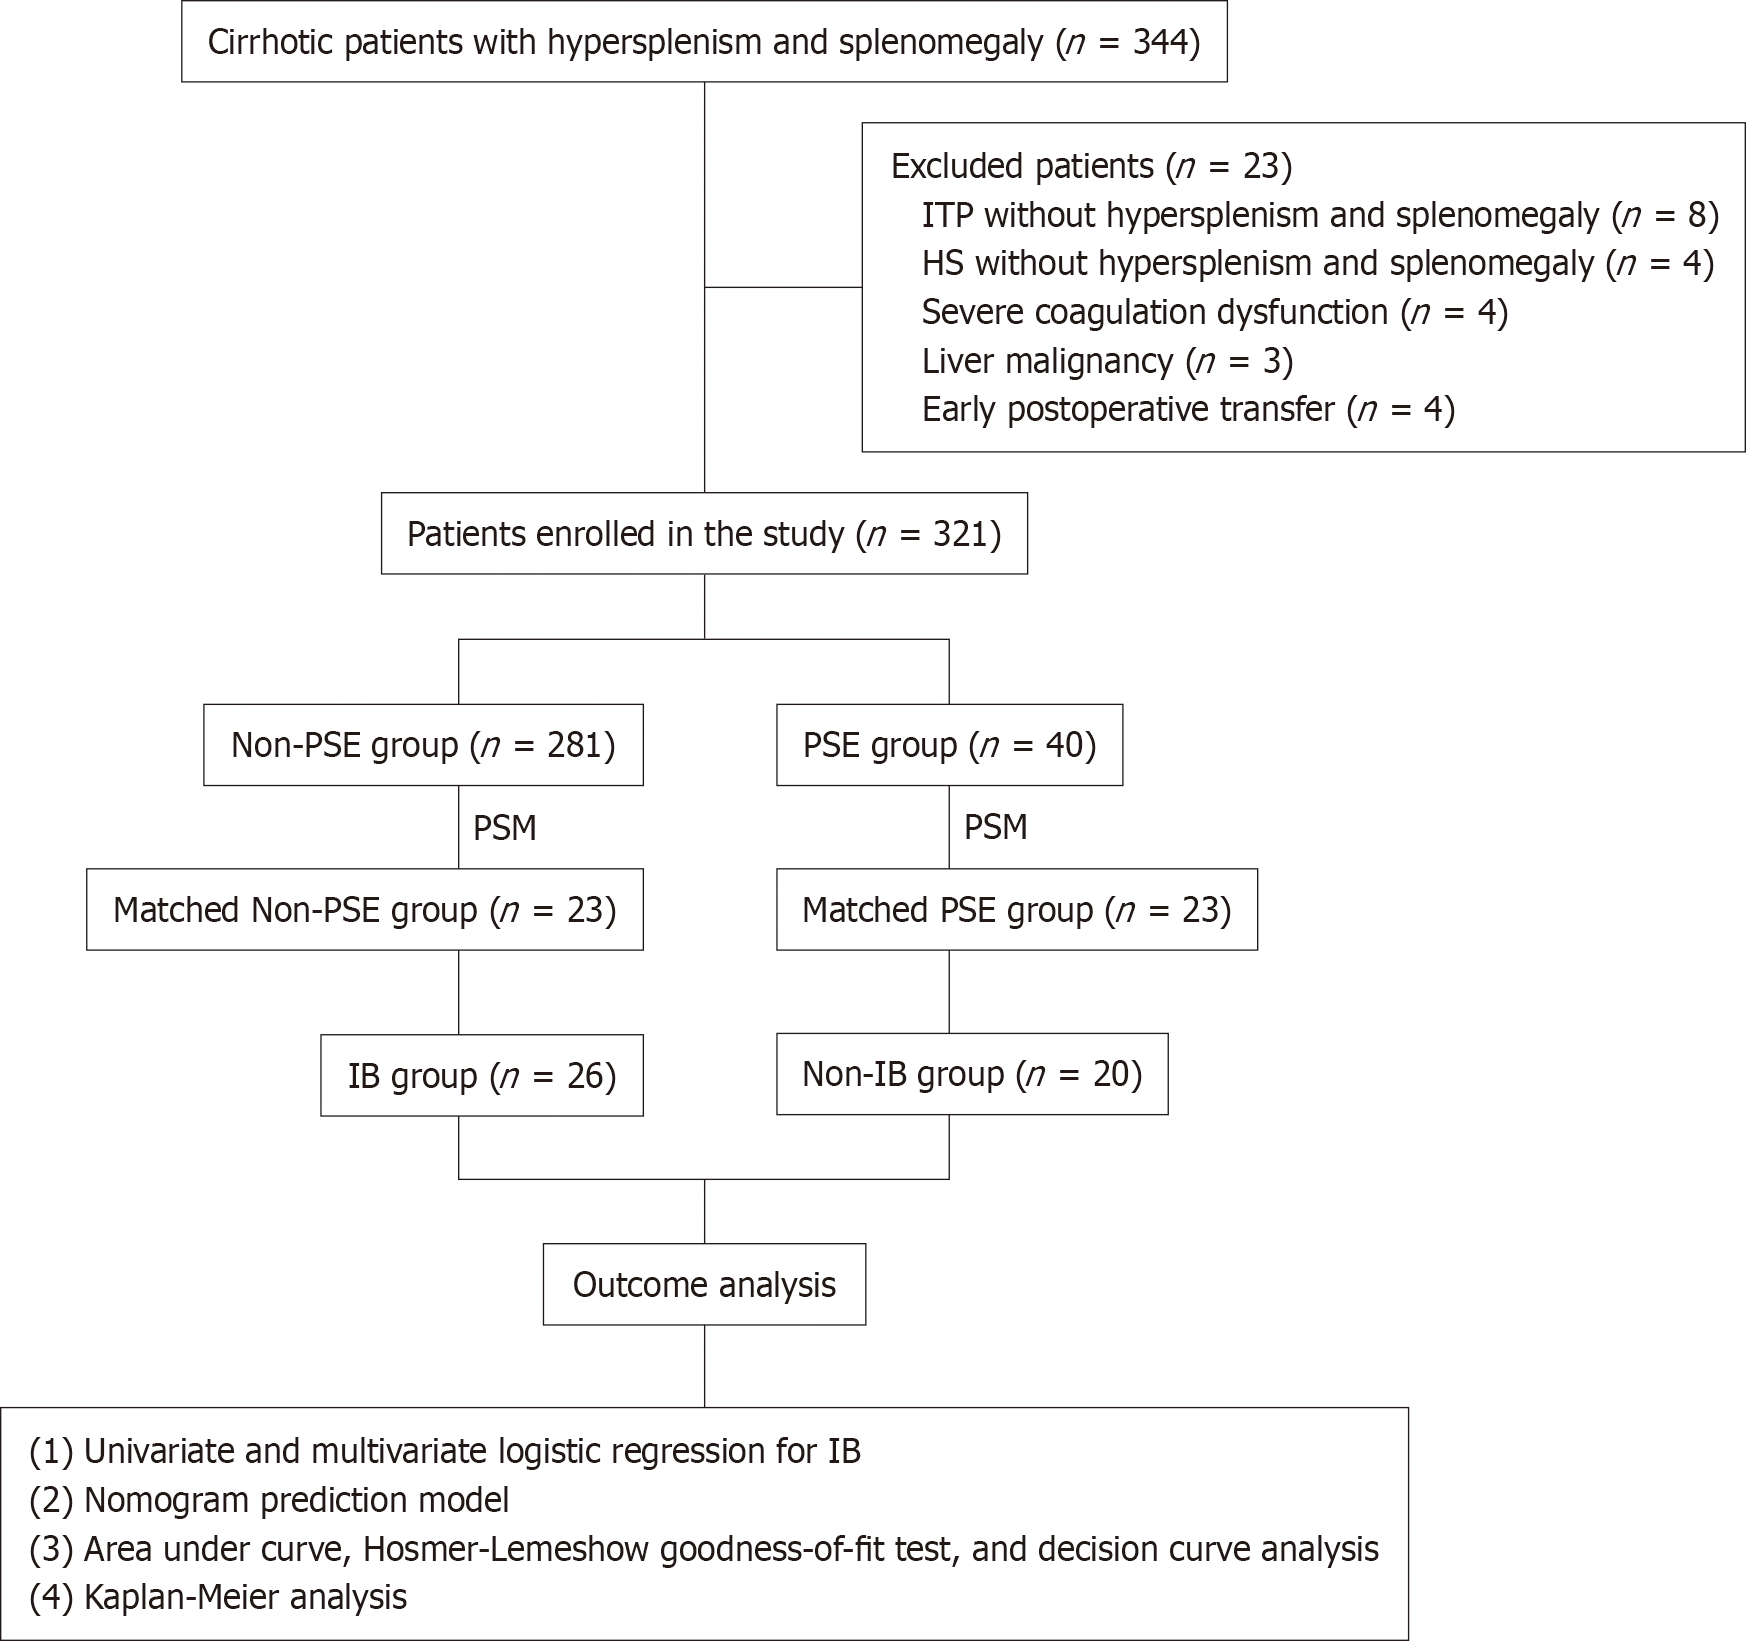
Figure 2 Classification and flow diagram of the study population.
HS: Hereditary spherocytosis; IB: Intraoperative bleeding; ITP: Idiopathic thrombocytopenic purpura; PSE: Partial splenic embolization; PSM: Propensity score matching.
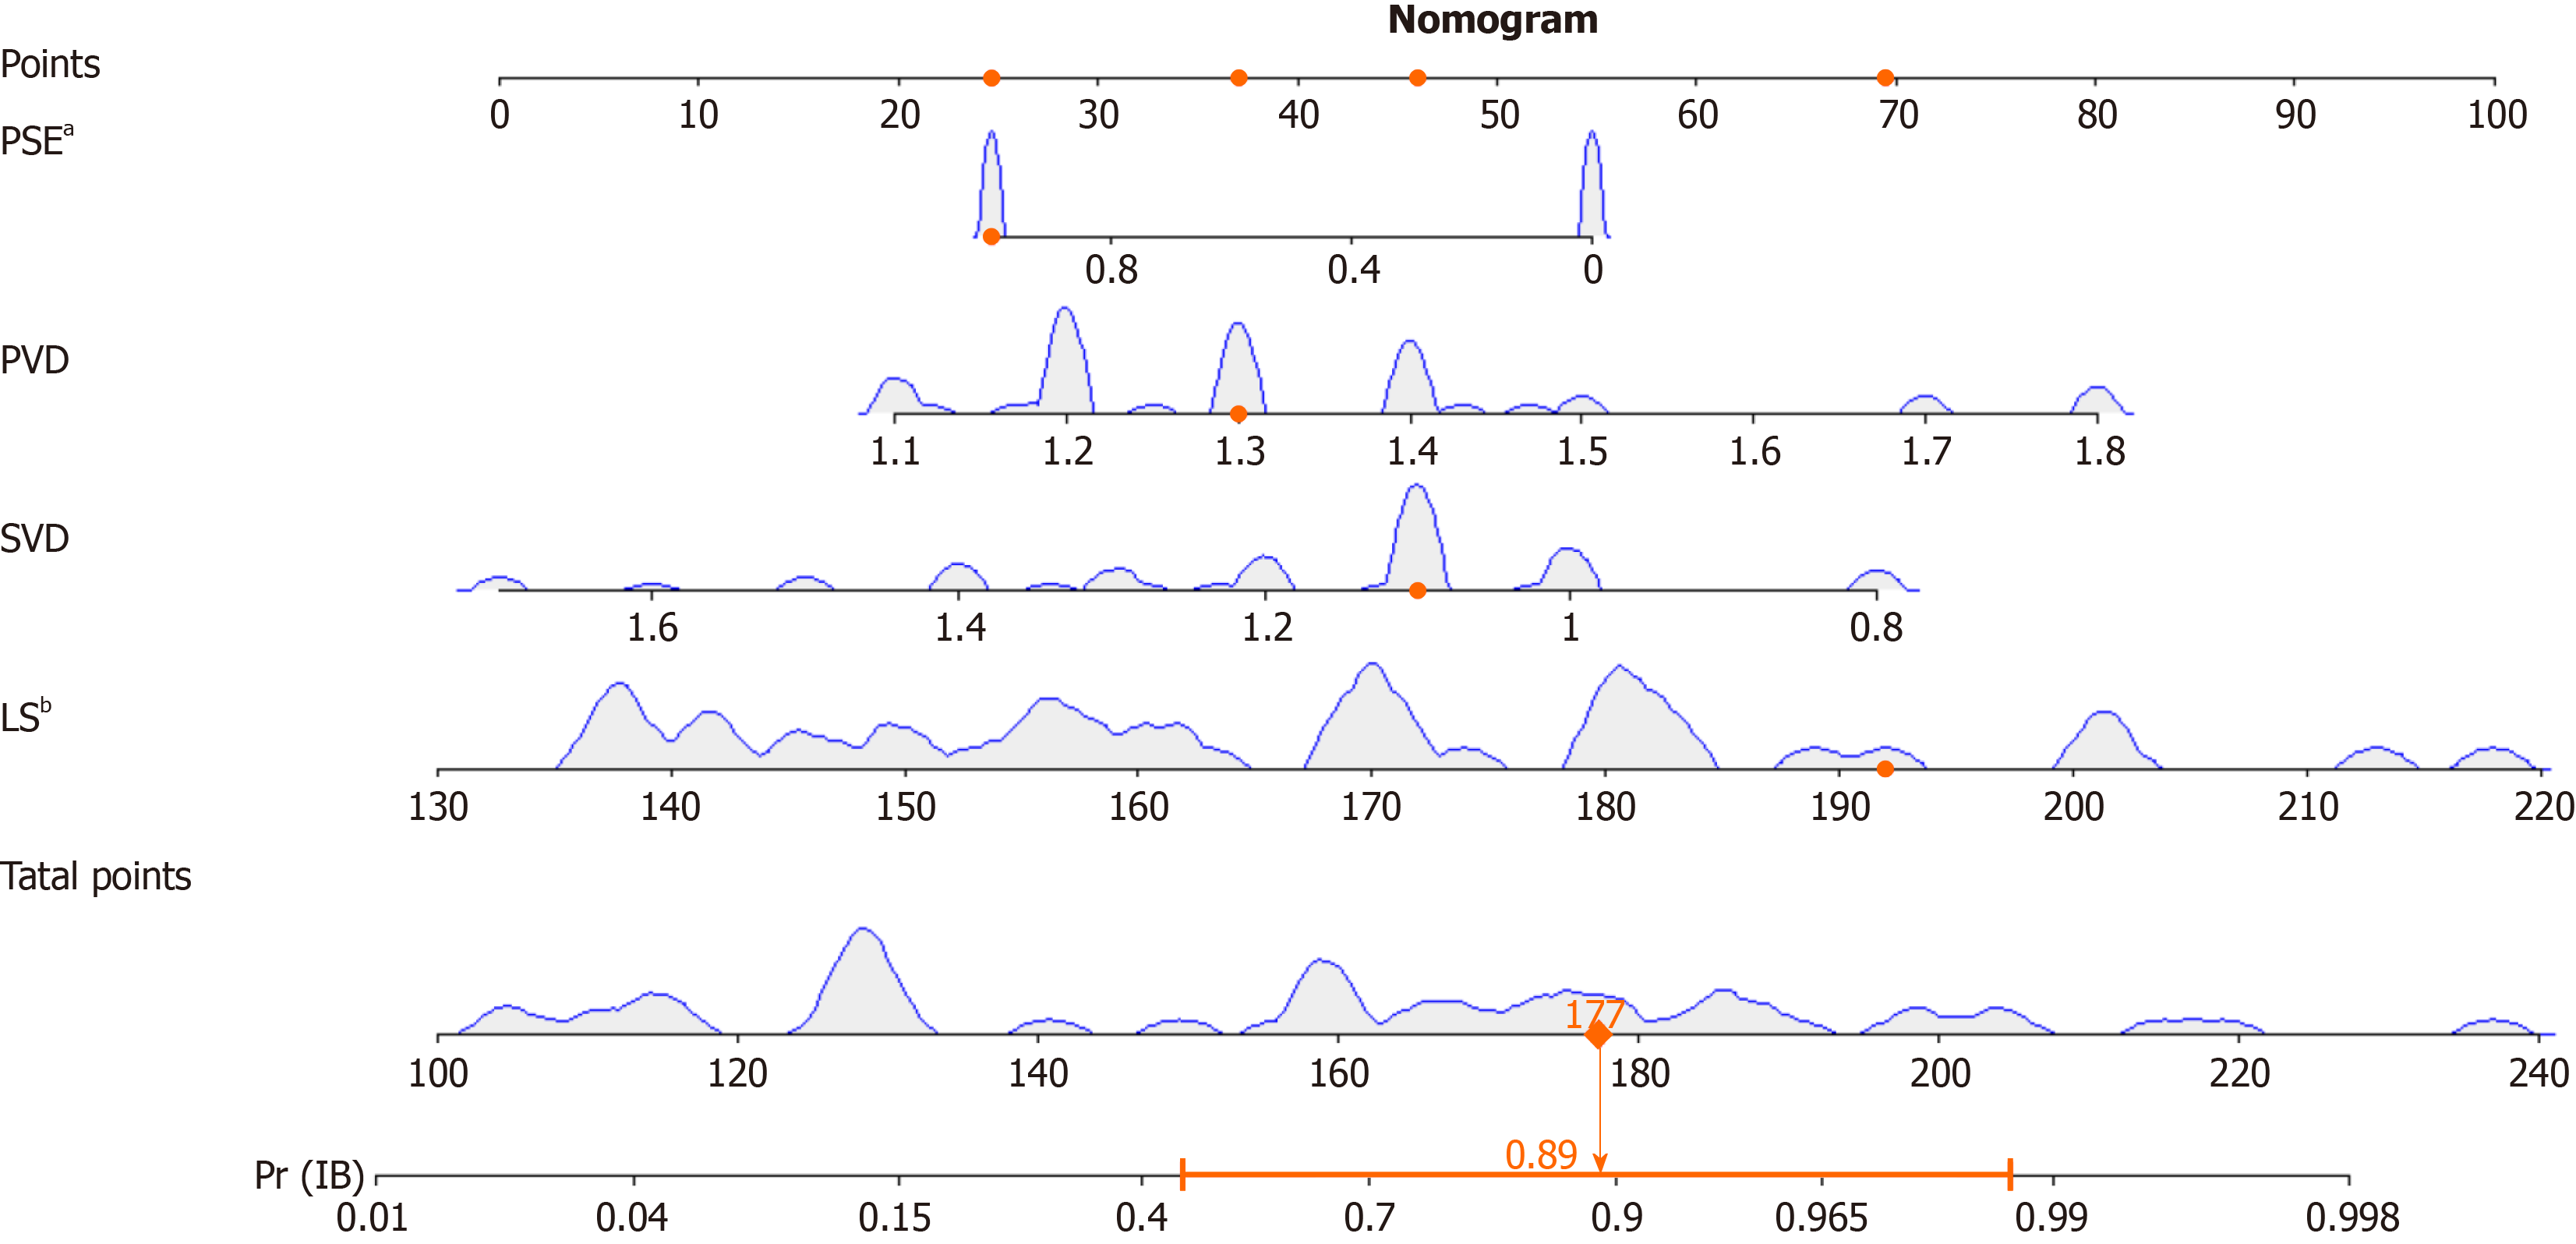
Figure 3 Nomogram predictive model for the risk of intraoperative bleeding in patients with cirrhosis and hypersplenism.
The nomogram gives every predictive variable a score on the point scale. A total score was calculated by summing the points from each variable, marking the estimated probability of intraoperative bleeding occurrence in included patients. aP < 0.05. bP < 0.01. LS: Length of the spleen; PSE: Partial splenic embolization; PVD: Portal vein diameter; SVD: Splenic vein diameter.
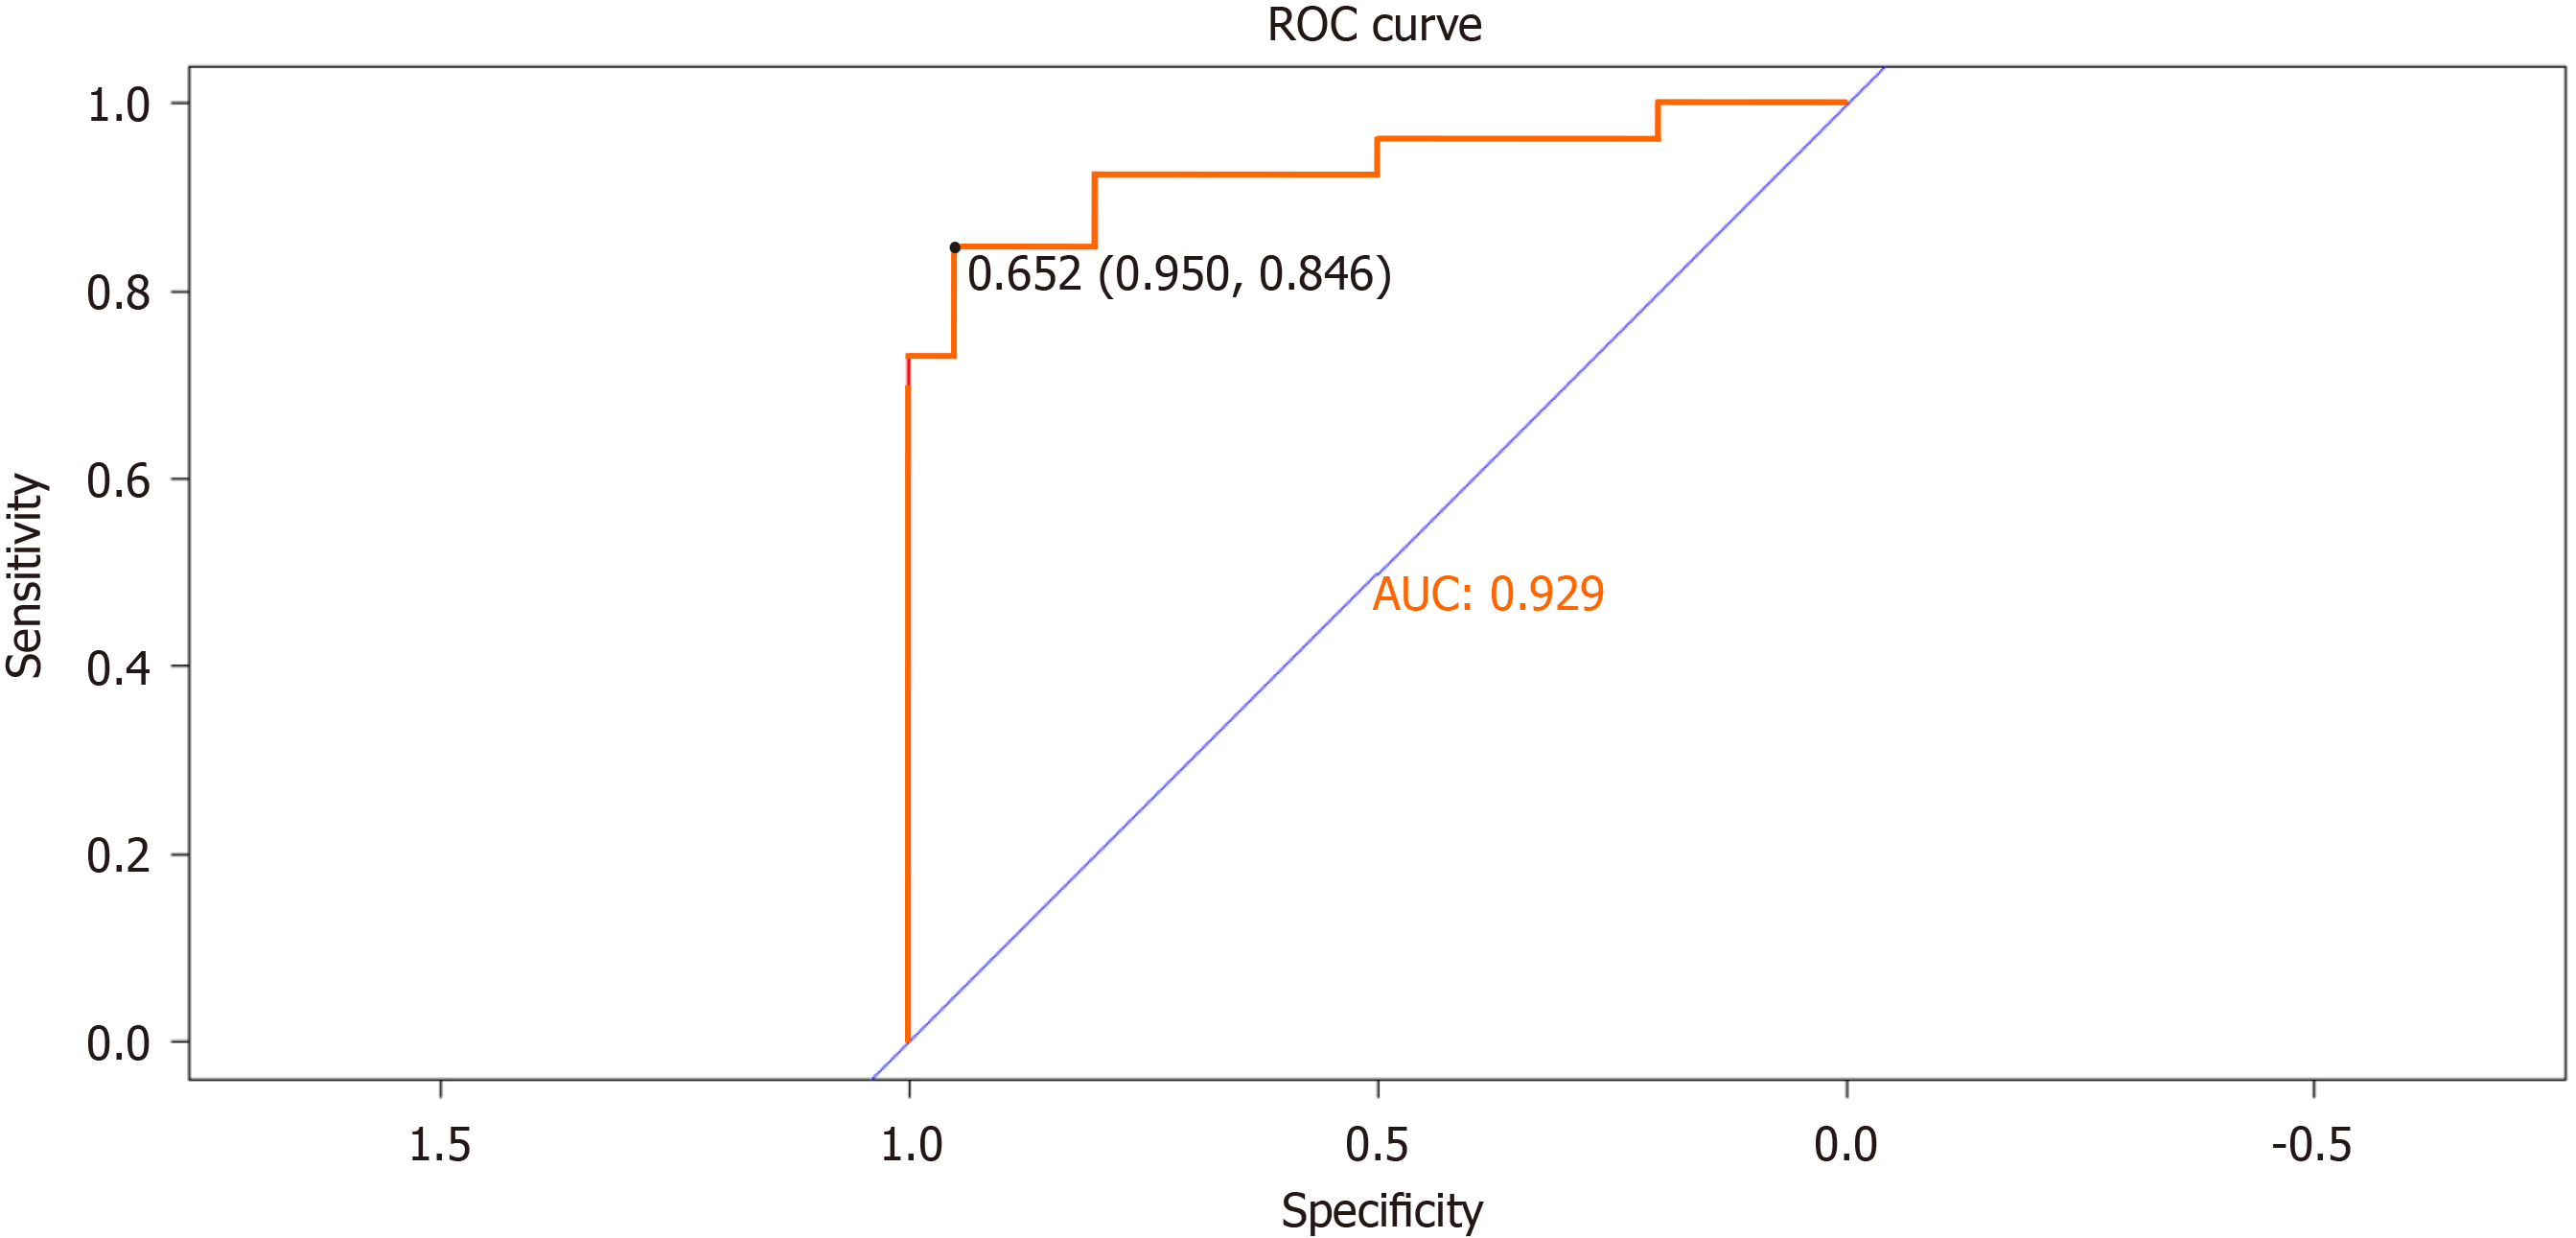
Figure 4 Discrimination of receiver operating characteristic curve curves of the nomogram model.
AUC: Area under curve; ROC: Receiver operating characteristic curve.
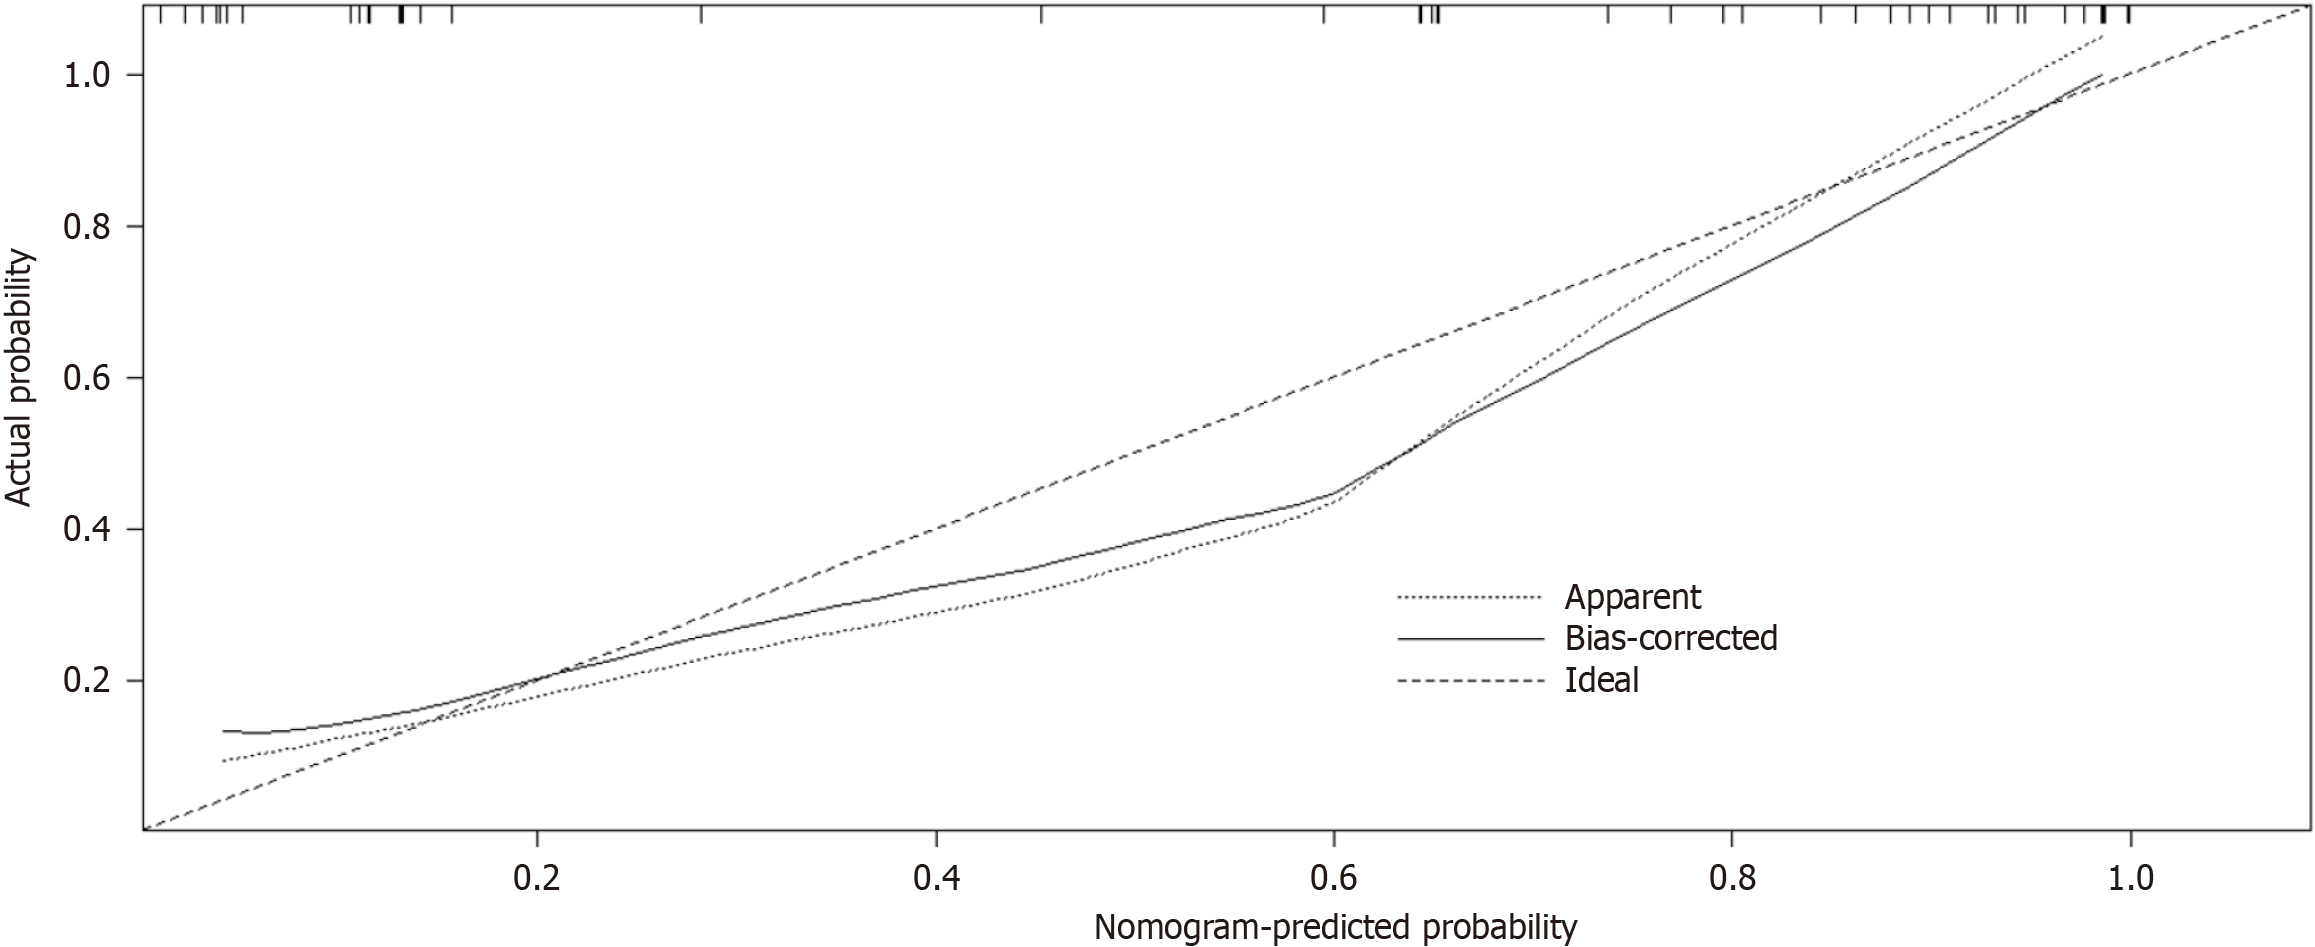
Figure 5 Nomogram calibration curve to predict the risk of intraoperative bleeding in in patients with cirrhosis and hypersplenism based on Hosmer-Lemeshow goodness-of-fit test.
X-axis represents the probability of nomogram prediction of intraoperative bleeding (IB), and Y-axis represents the actual incidence of IB.
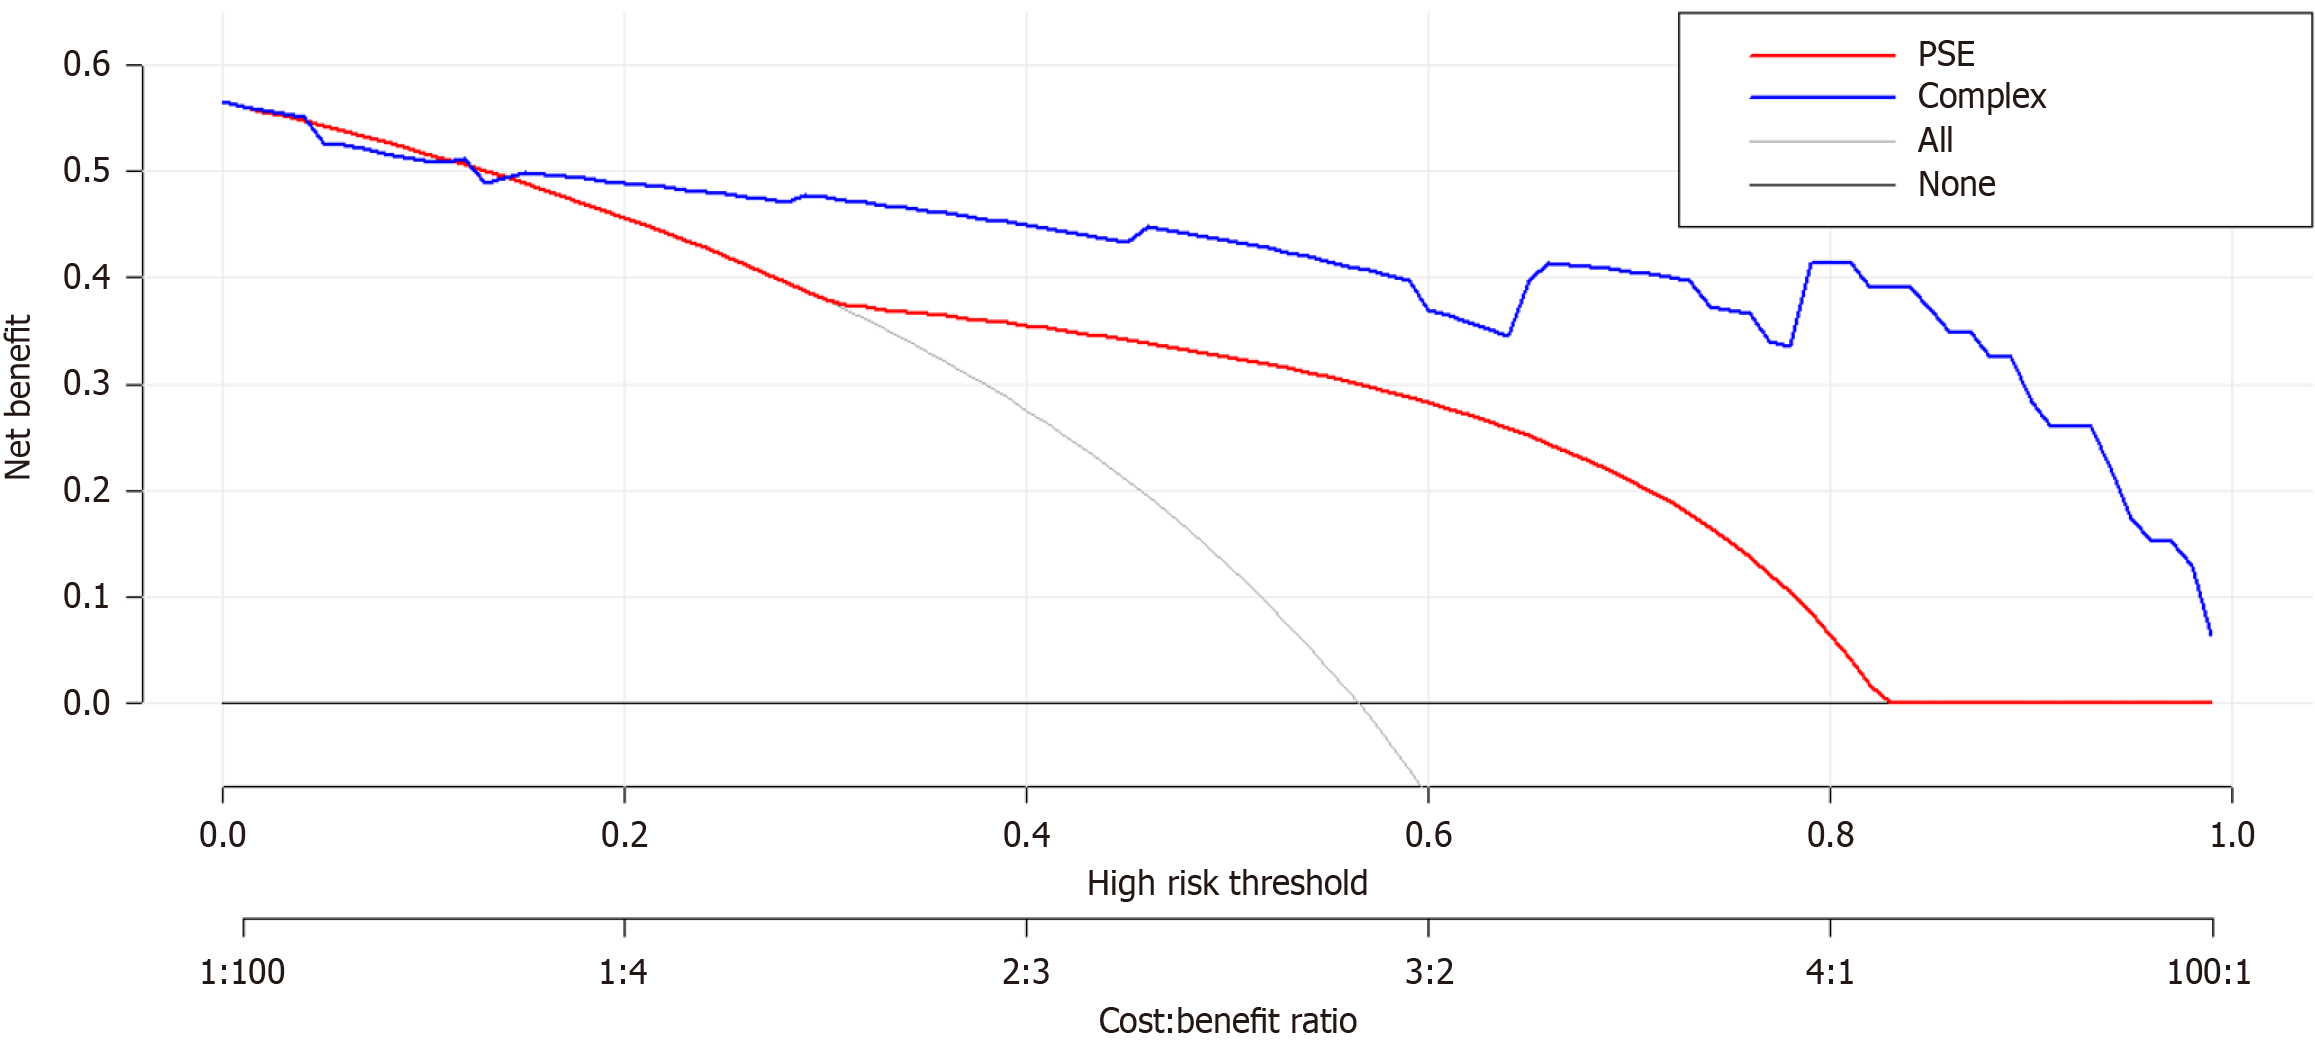
Figure 6 Nomogram decision curve analysis for intraoperative bleeding prediction in included patients.
The Y-axis represents the net benefit, which was calculated as the true incidence of intraoperative bleeding minus the false-positive rate (true positive rate), the red and blue lines represent the nomogram prediction probability, and the gray line represents the extremes of intervention and non-intervention. PSE: Partial splenic embolization.
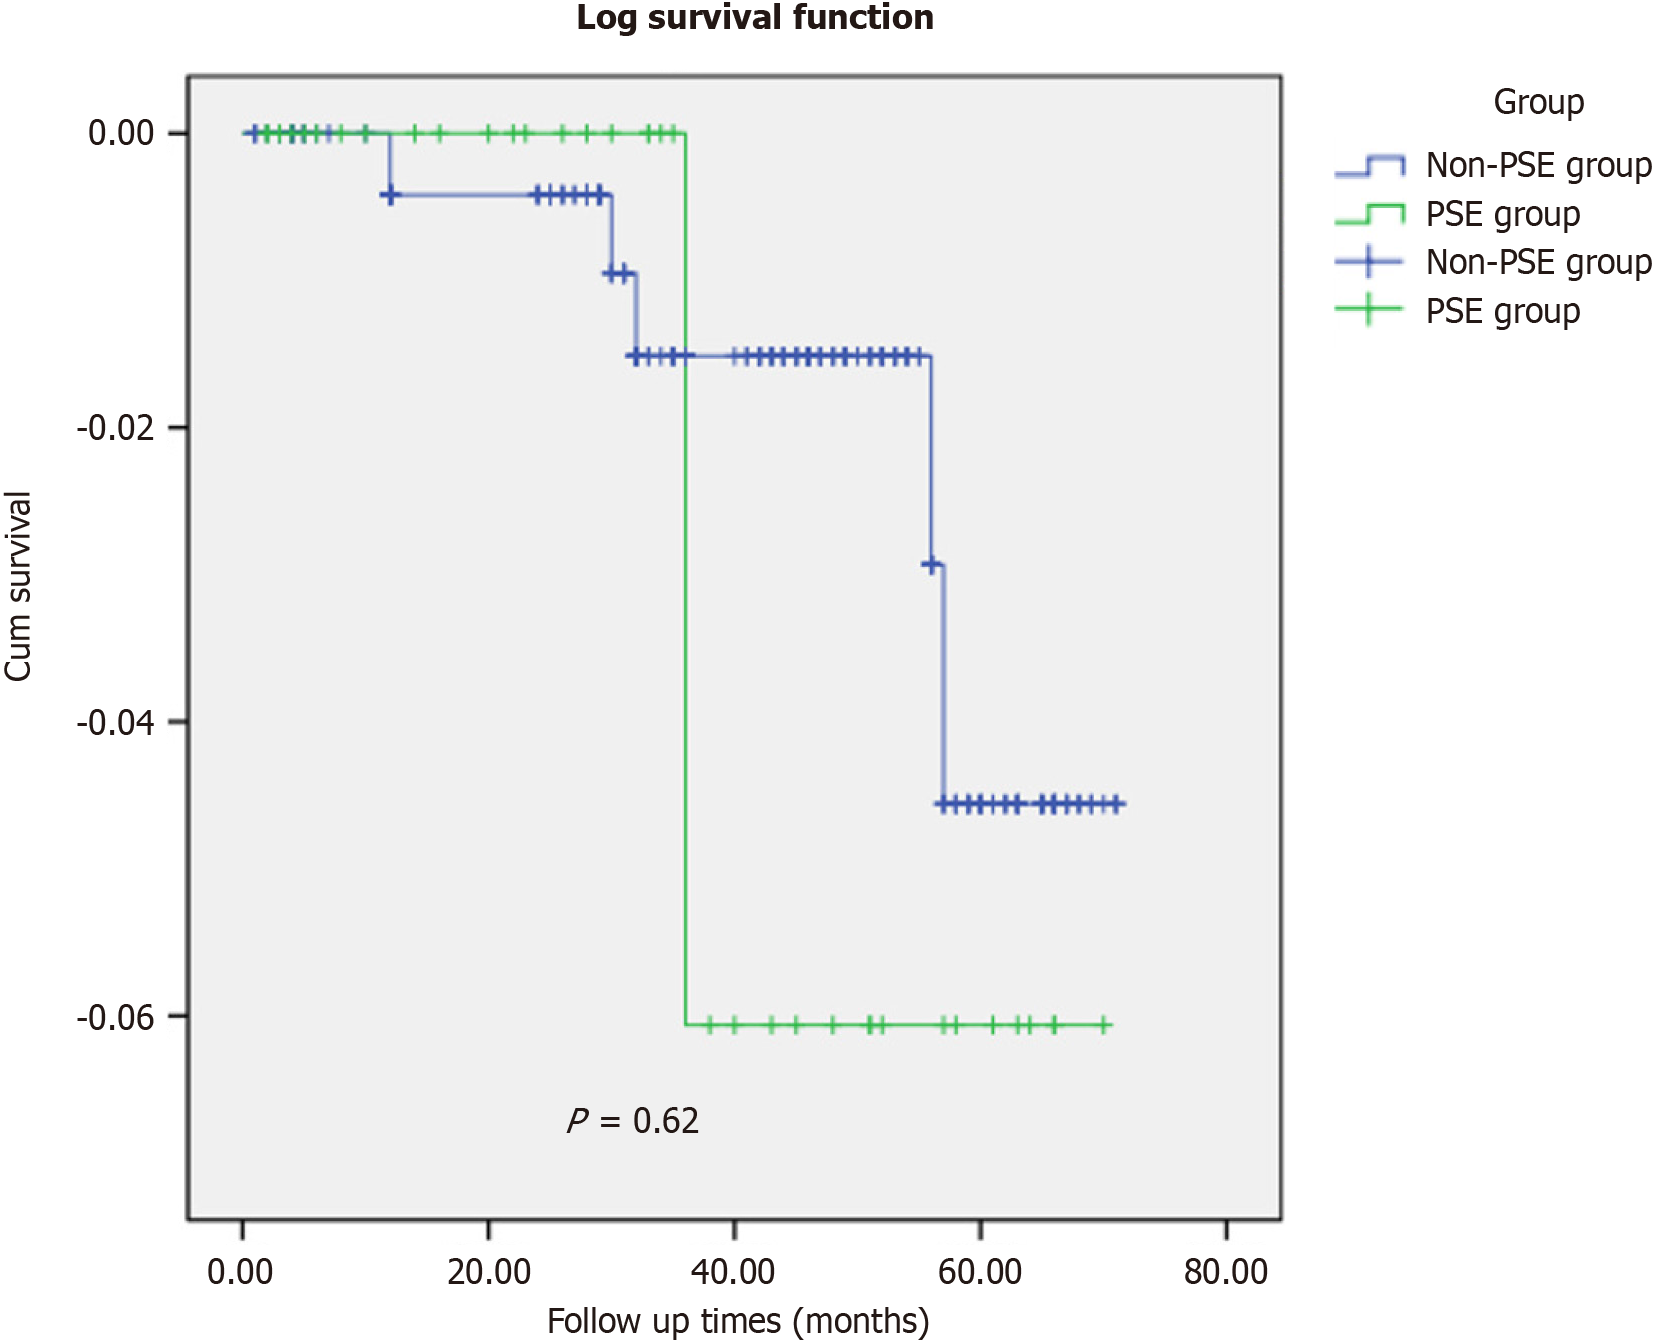
Figure 7 Overall survival data between the two groups in the follow-up.
PSE: Partial splenic embolization.
- Citation: Huang L, Li QL, Yu QS, Peng H, Zhen Z, Shen Y, Zhang Q. Will partial splenic embolization followed by splenectomy increase intraoperative bleeding? World J Gastrointest Surg 2024; 16(2): 318-330
- URL: https://www.wjgnet.com/1948-9366/full/v16/i2/318.htm
- DOI: https://dx.doi.org/10.4240/wjgs.v16.i2.318


