Copyright
©The Author(s) 2022.
World J Gastrointest Surg. Sep 27, 2022; 14(9): 1072-1081
Published online Sep 27, 2022. doi: 10.4240/wjgs.v14.i9.1072
Published online Sep 27, 2022. doi: 10.4240/wjgs.v14.i9.1072
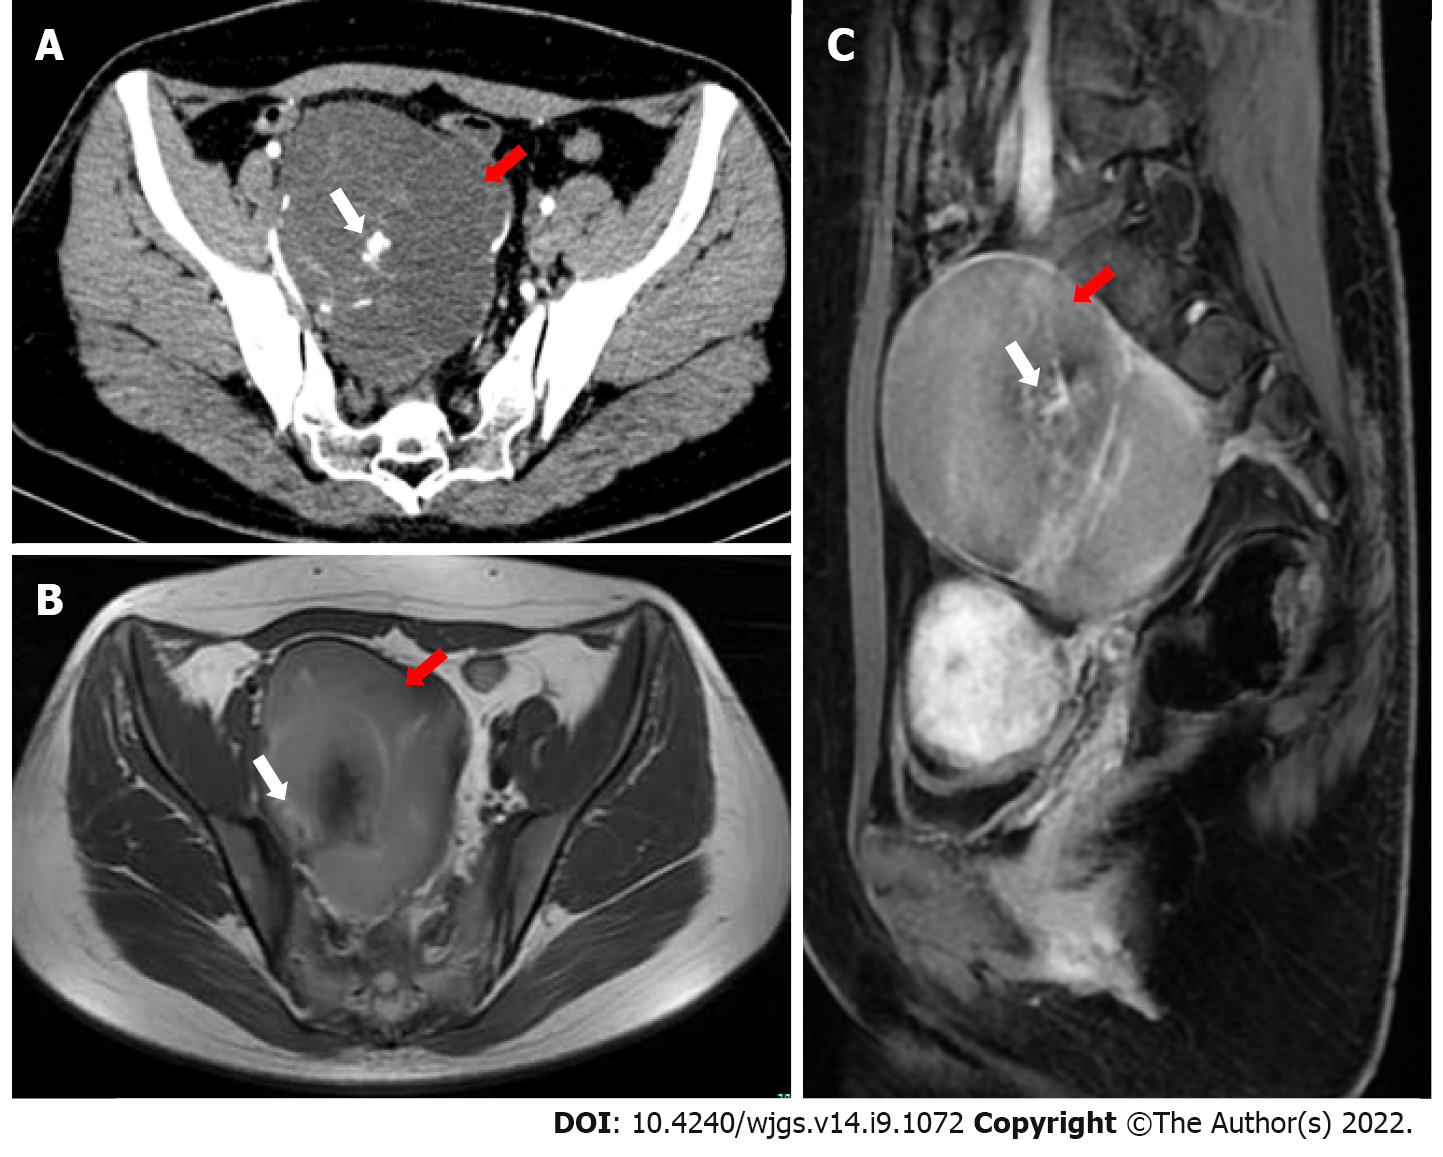
Figure 1 Imaging examination.
A: Computed tomography showed a low-density mass (red arrow) of approximately 10 cm × 9 cm in the pelvis, with cordlike separation and unclear boundaries with the posterior wall and lateral wall. Inhomogeneous enhancement and high-density areas (white arrow) were seen; B and C: Magnetic resonance imaging showed a mass (red arrow) of abnormal signal intensity on the right side of the pelvic cavity, whereas the boundary was still clear. T1-weighted imaging showed a slightly high signal intensity, T2-weighted imaging showed a mixed high signal intensity, and the septal changes in the enhanced scan showed obvious enhancement (white arrow).
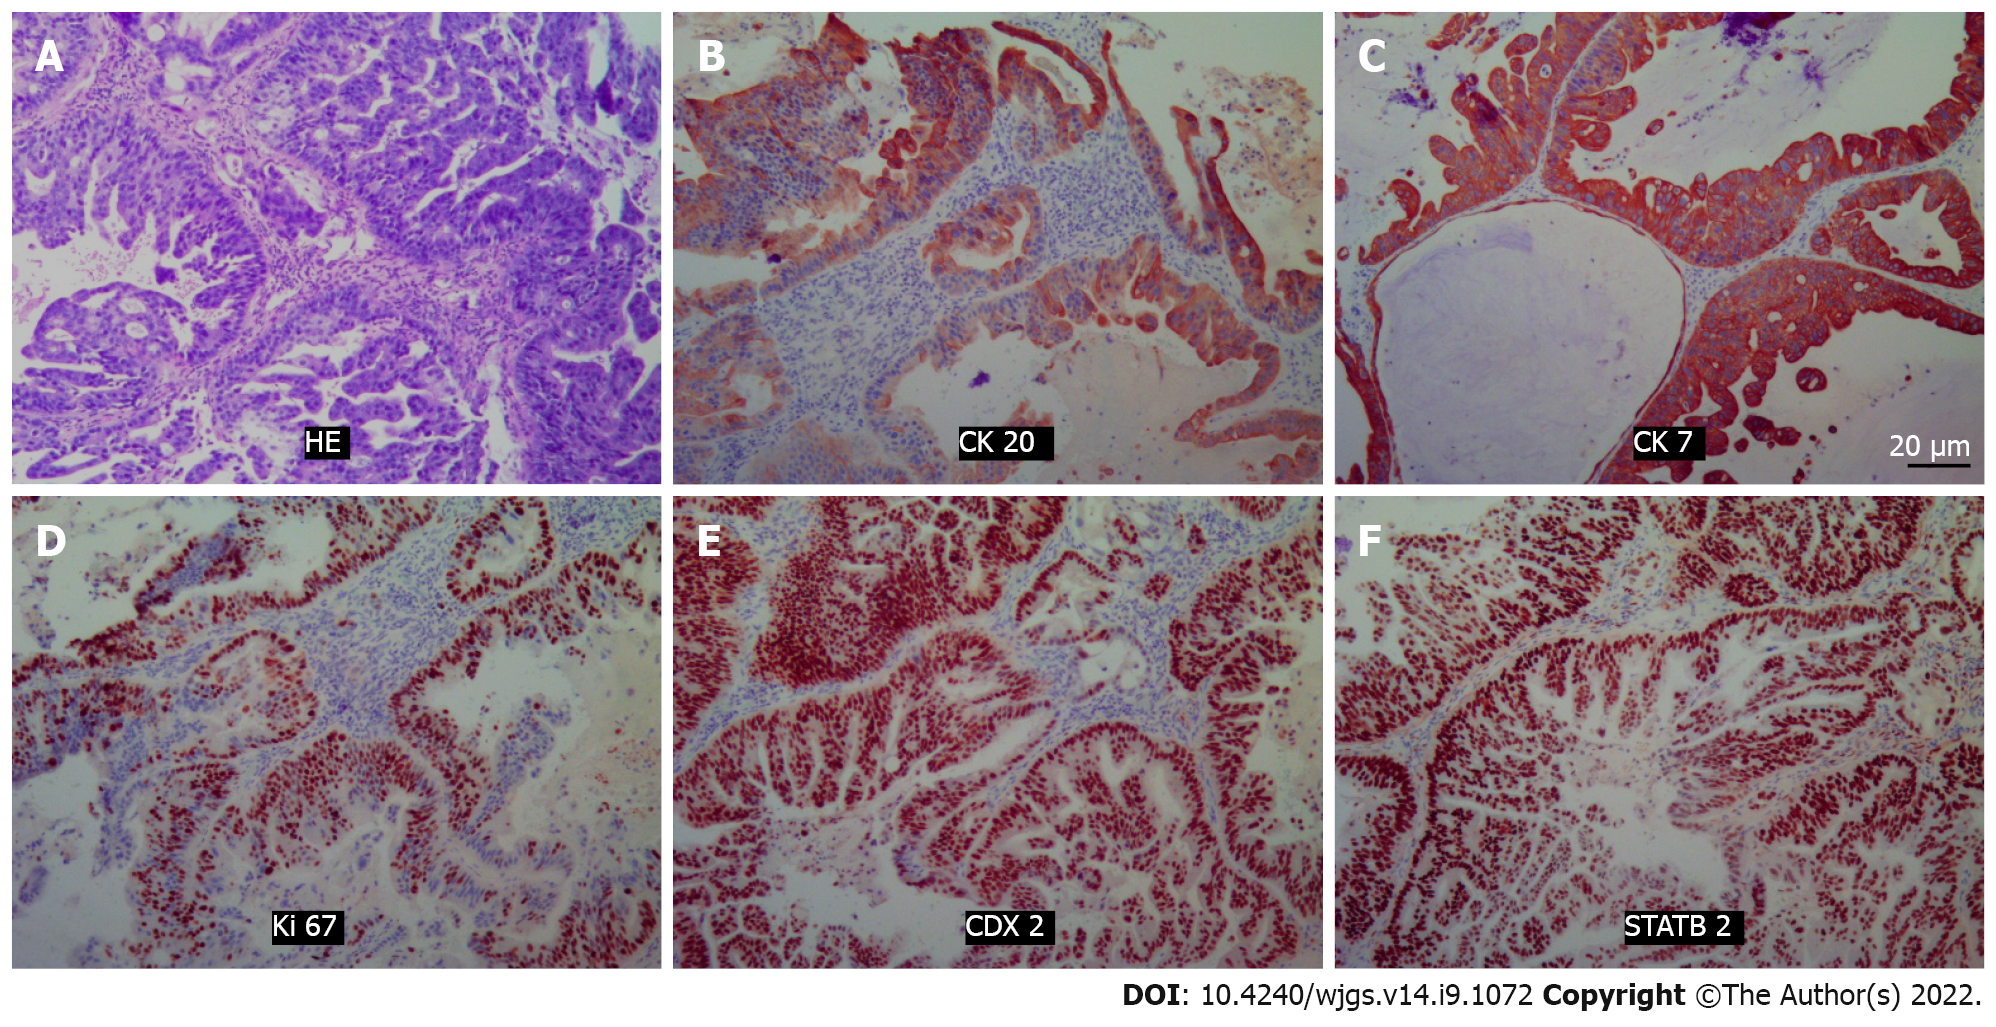
Figure 2 Hematoxylin-eosin staining and immunohistochemical pictures.
Positivity for cytokeratin 20, cytokeratin 7, Ki67, CDX2, and STATB2 was noted. A: Hematoxylin-eosin staining; B: CK20; C: CK7; D: Ki67; E: CDX2; F: STATB2. HE: Hematoxylin-eosin; CK20: Cytokeratin 20; CK7: Cytokeratin 7.
Figure 3 Surgical pictures.
A: Gross view of the mass (white arrow) under laparoscopy. The sigmoid colon (blue arrow) and ureter (red arrow) can be seen; B: Opening of the retroperitoneum (black arrow) and exposure of the mass (white arrow) and external iliac artery (blue arrow); C: Careful separation of the mass (white arrow) from the presacral tissue (blue arrow); D: The operative field after the tumor was removed, and the uterus (red arrow), rectum (blue arrow), and retroperitoneum (black arrow) can be seen.
- Citation: Wang YS, Guo QY, Zheng FH, Huang ZW, Yan JL, Fan FX, Liu T, Ji SX, Zhao XF, Zheng YX. Retrorectal mucinous adenocarcinoma arising from a tailgut cyst: A case report and review of literature. World J Gastrointest Surg 2022; 14(9): 1072-1081
- URL: https://www.wjgnet.com/1948-9366/full/v14/i9/1072.htm
- DOI: https://dx.doi.org/10.4240/wjgs.v14.i9.1072


