Copyright
©The Author(s) 2022.
World J Gastrointest Surg. Sep 27, 2022; 14(9): 1008-1025
Published online Sep 27, 2022. doi: 10.4240/wjgs.v14.i9.1008
Published online Sep 27, 2022. doi: 10.4240/wjgs.v14.i9.1008
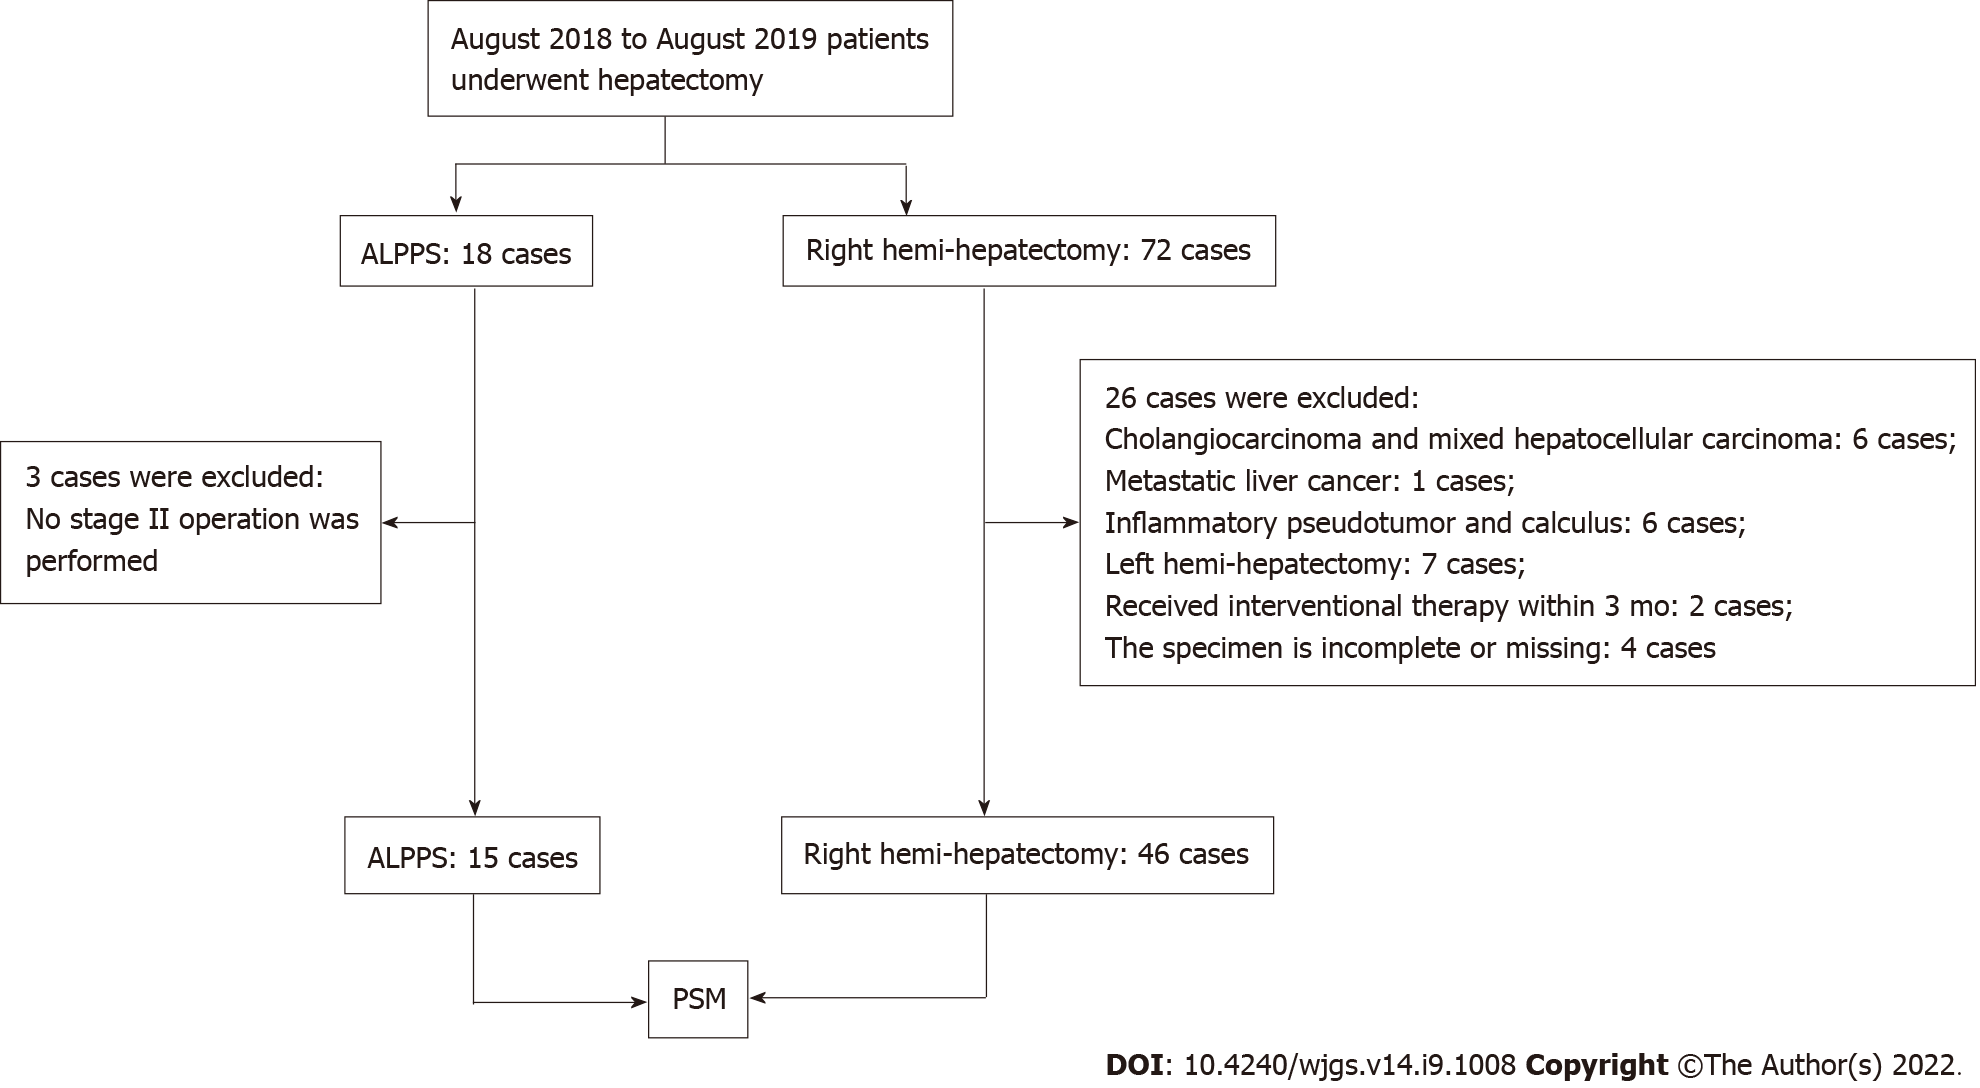
Figure 1 Flow chart of patient selection.
Fifteen hepatocellular carcinoma patients treated by associating liver partition and portal vein ligation for staged hepatectomy and 46 patients by right hemi-hepatectomy were included for analysis. ALPPS: Associating liver partition and portal vein ligation for staged hepatectomy; PSM: Propensity score matching.
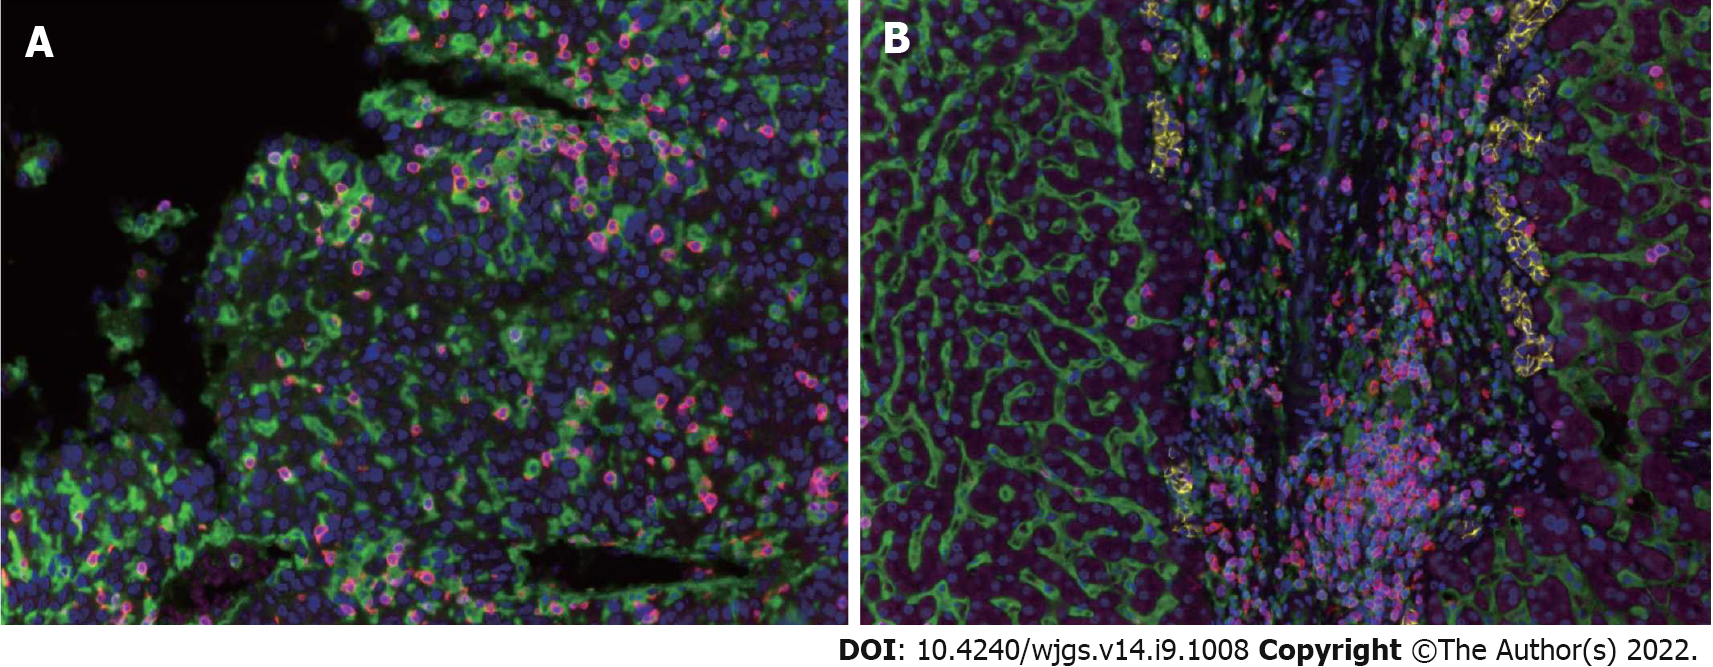
Figure 2 Expression of tumor-infiltrating lymphocytes in the hepatocellular carcinoma tumor microenvironment.
A: Immunohistochemistry image showing the distribution and expression of tumor-infiltrating lymphocyte subpopulations in tumor tissues; B: Immunohistochemistry image showing the distribution and expression of tumor-infiltrating lymphocyte subpopulations in adjacent tissues.
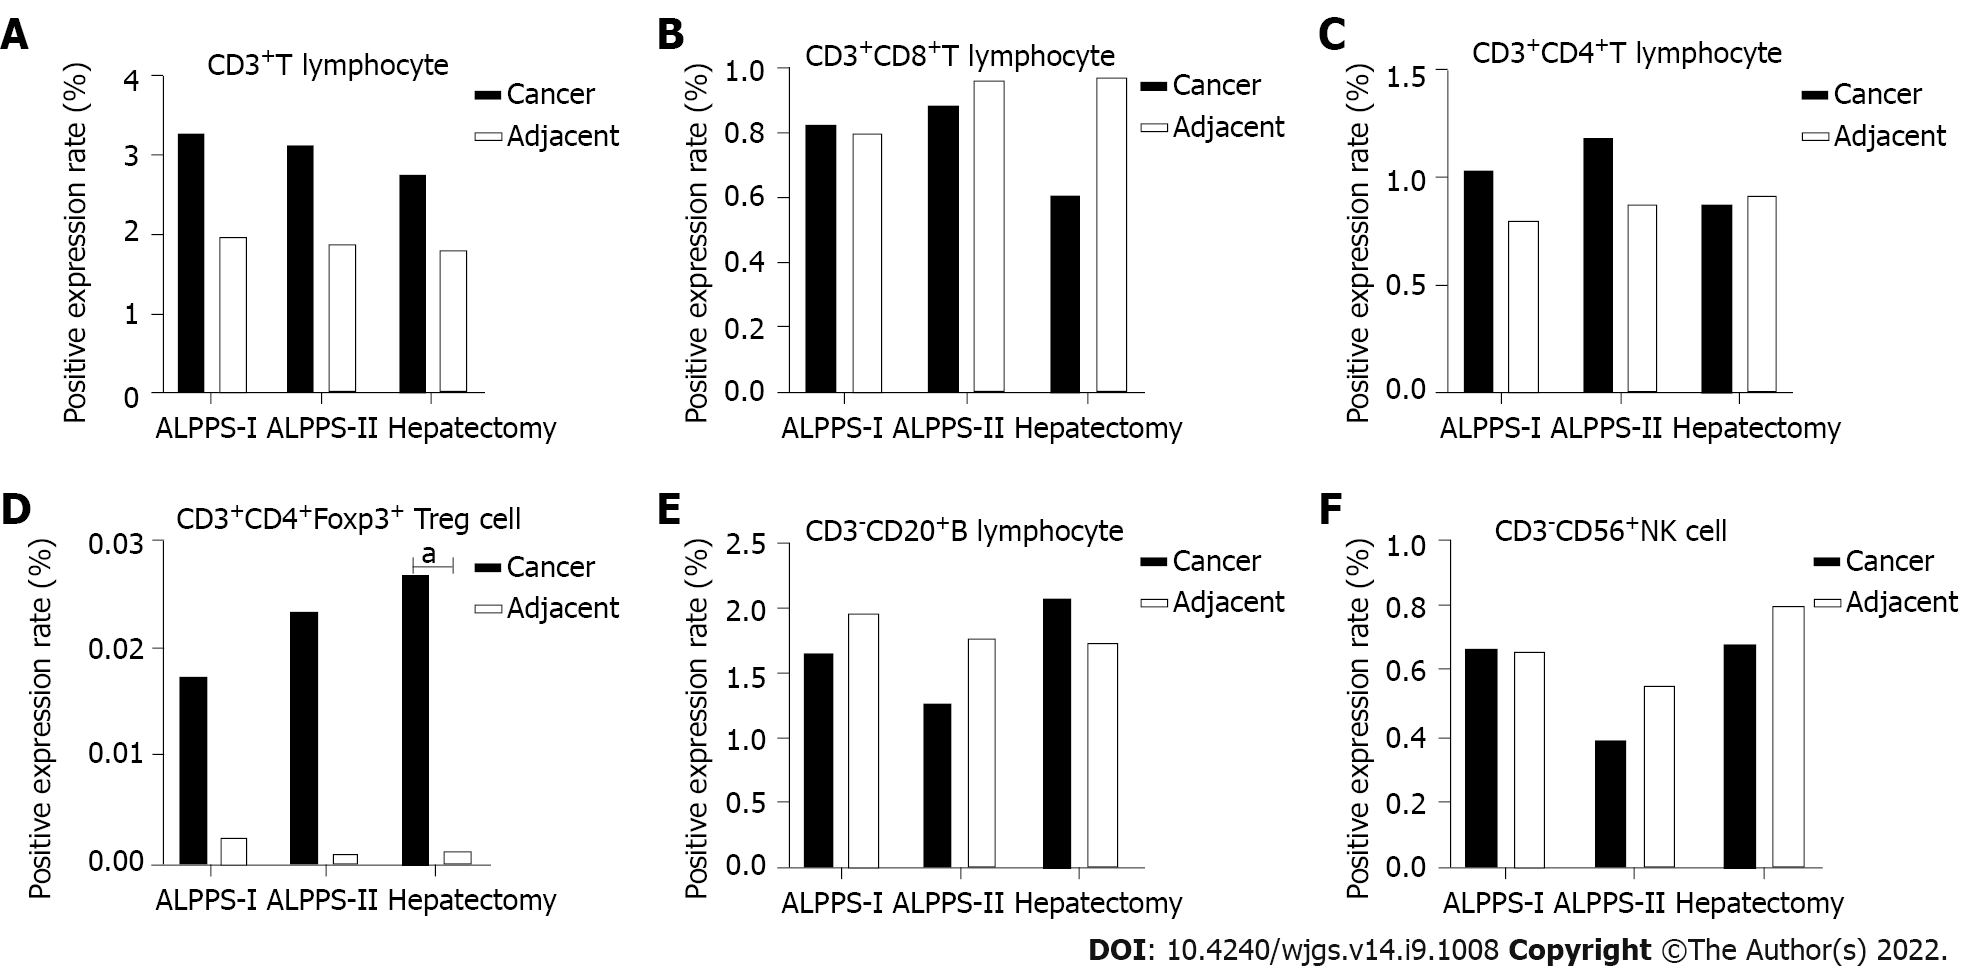
Figure 3 Expression of each subpopulation of tumor-infiltrating lymphocytes in the associating liver partition and portal vein ligation for staged hepatectomy group (stage I and stage II) and right hemi-hepatectomy group.
A: Positive expression level of CD3+ T cells; B: Positive expression level of CD3+CD4+ T cells; C: Positive expression level of CD3+CD8+ T cells; D: Positive expression level of CD3+CD4+Foxp3+ Treg cells; E: Positive expression level of CD3-CD20+ B cells; F: Positive expression level of CD3-CD56+ natural killer cells in different groups and tissues. aP < 0.05.
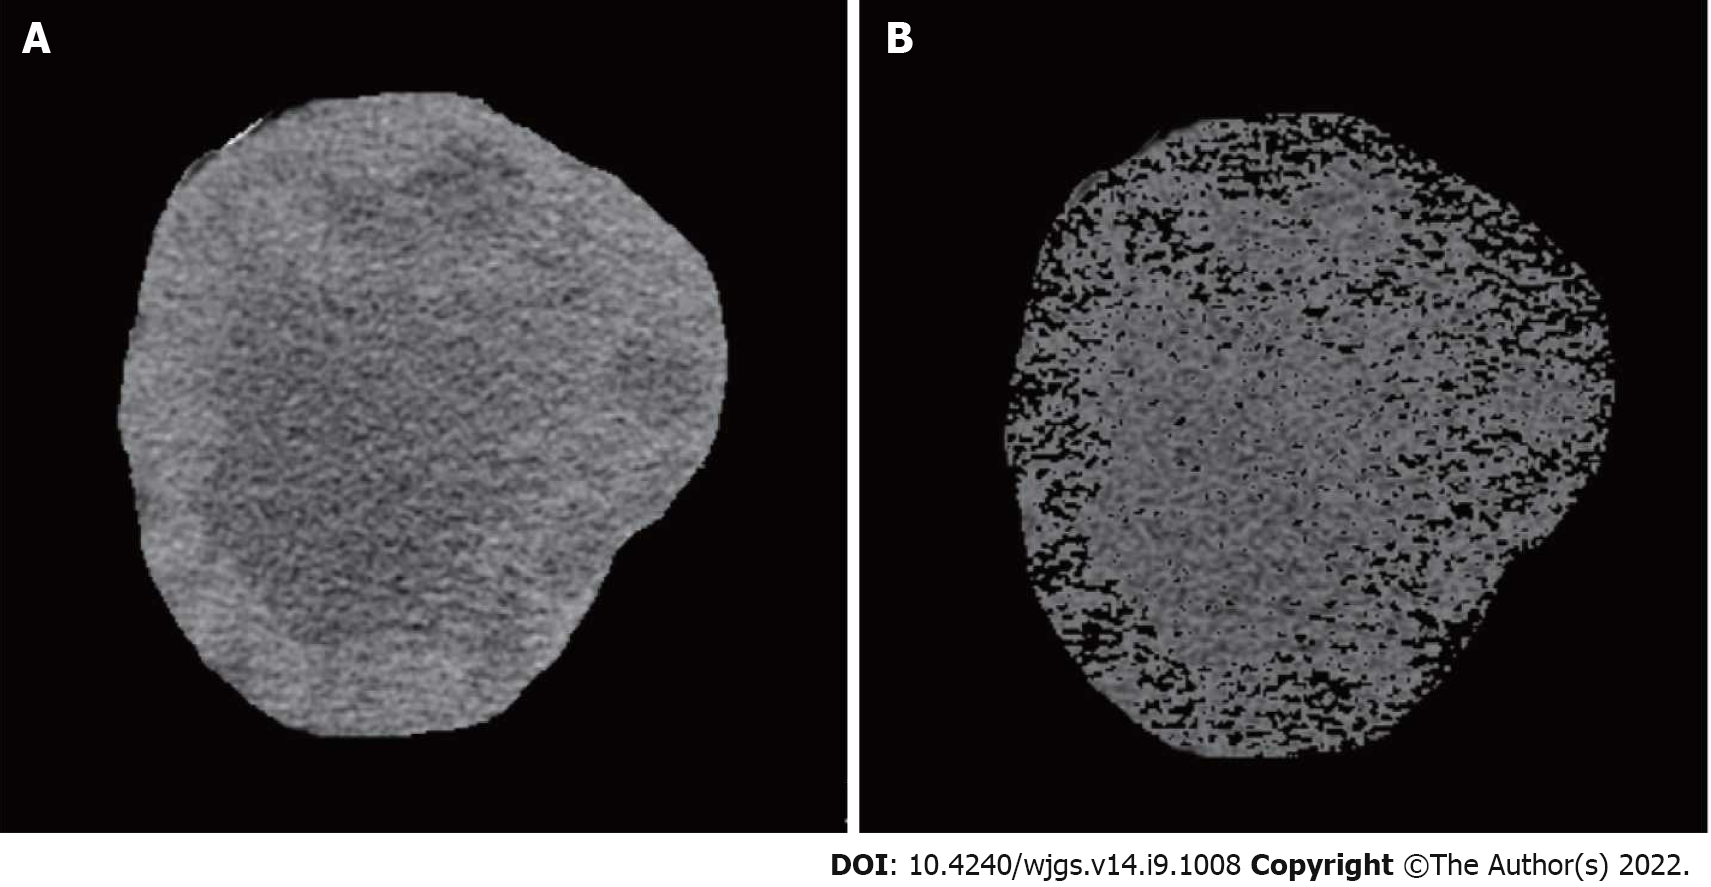
Figure 4 Diagrammatic representation of tumor volume and tumor necrosis volume measurement.
A: Tumor tissue; B: Component of tumor necrosis.
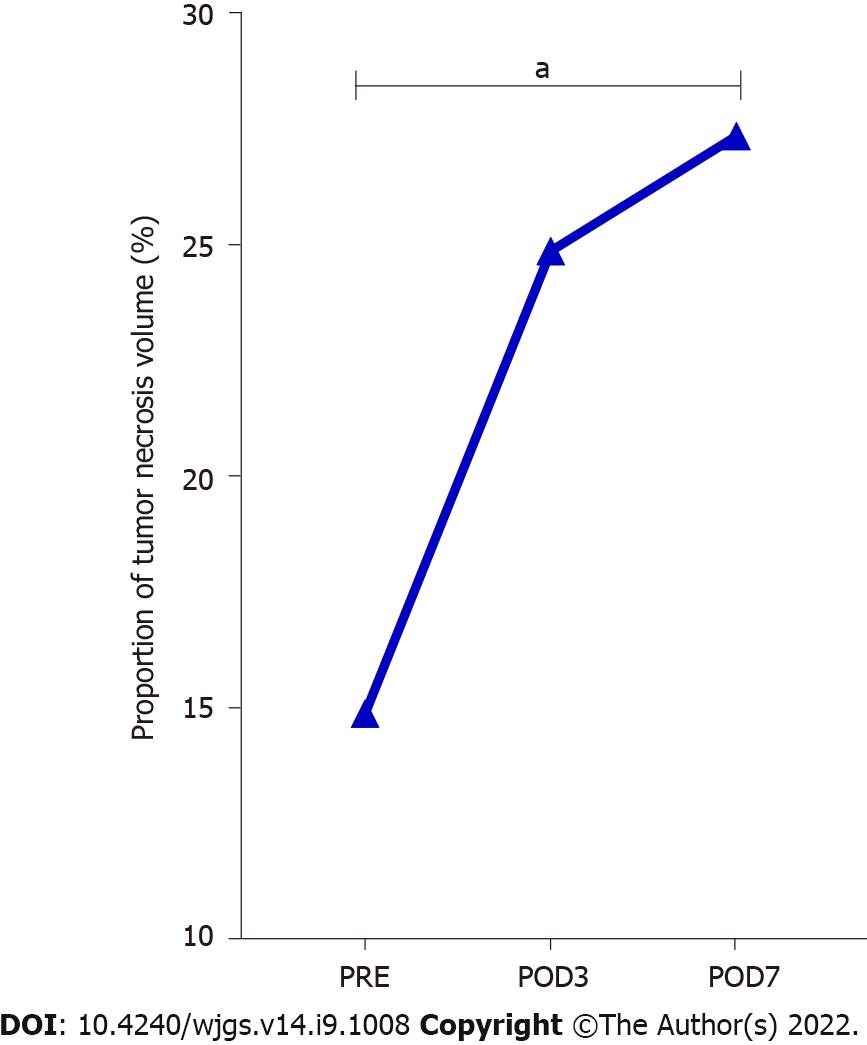
Figure 5 Change in the proportion of tumor necrosis volume in stage-I associating liver partition and portal vein ligation for staged hepatectomy.
The proportion of tumor necrotic volume on the seventh day after stage-I associating liver partition and portal vein ligation for staged hepatectomy was significantly higher than that before the operation. POD: Postoperative day. aP < 0.05.
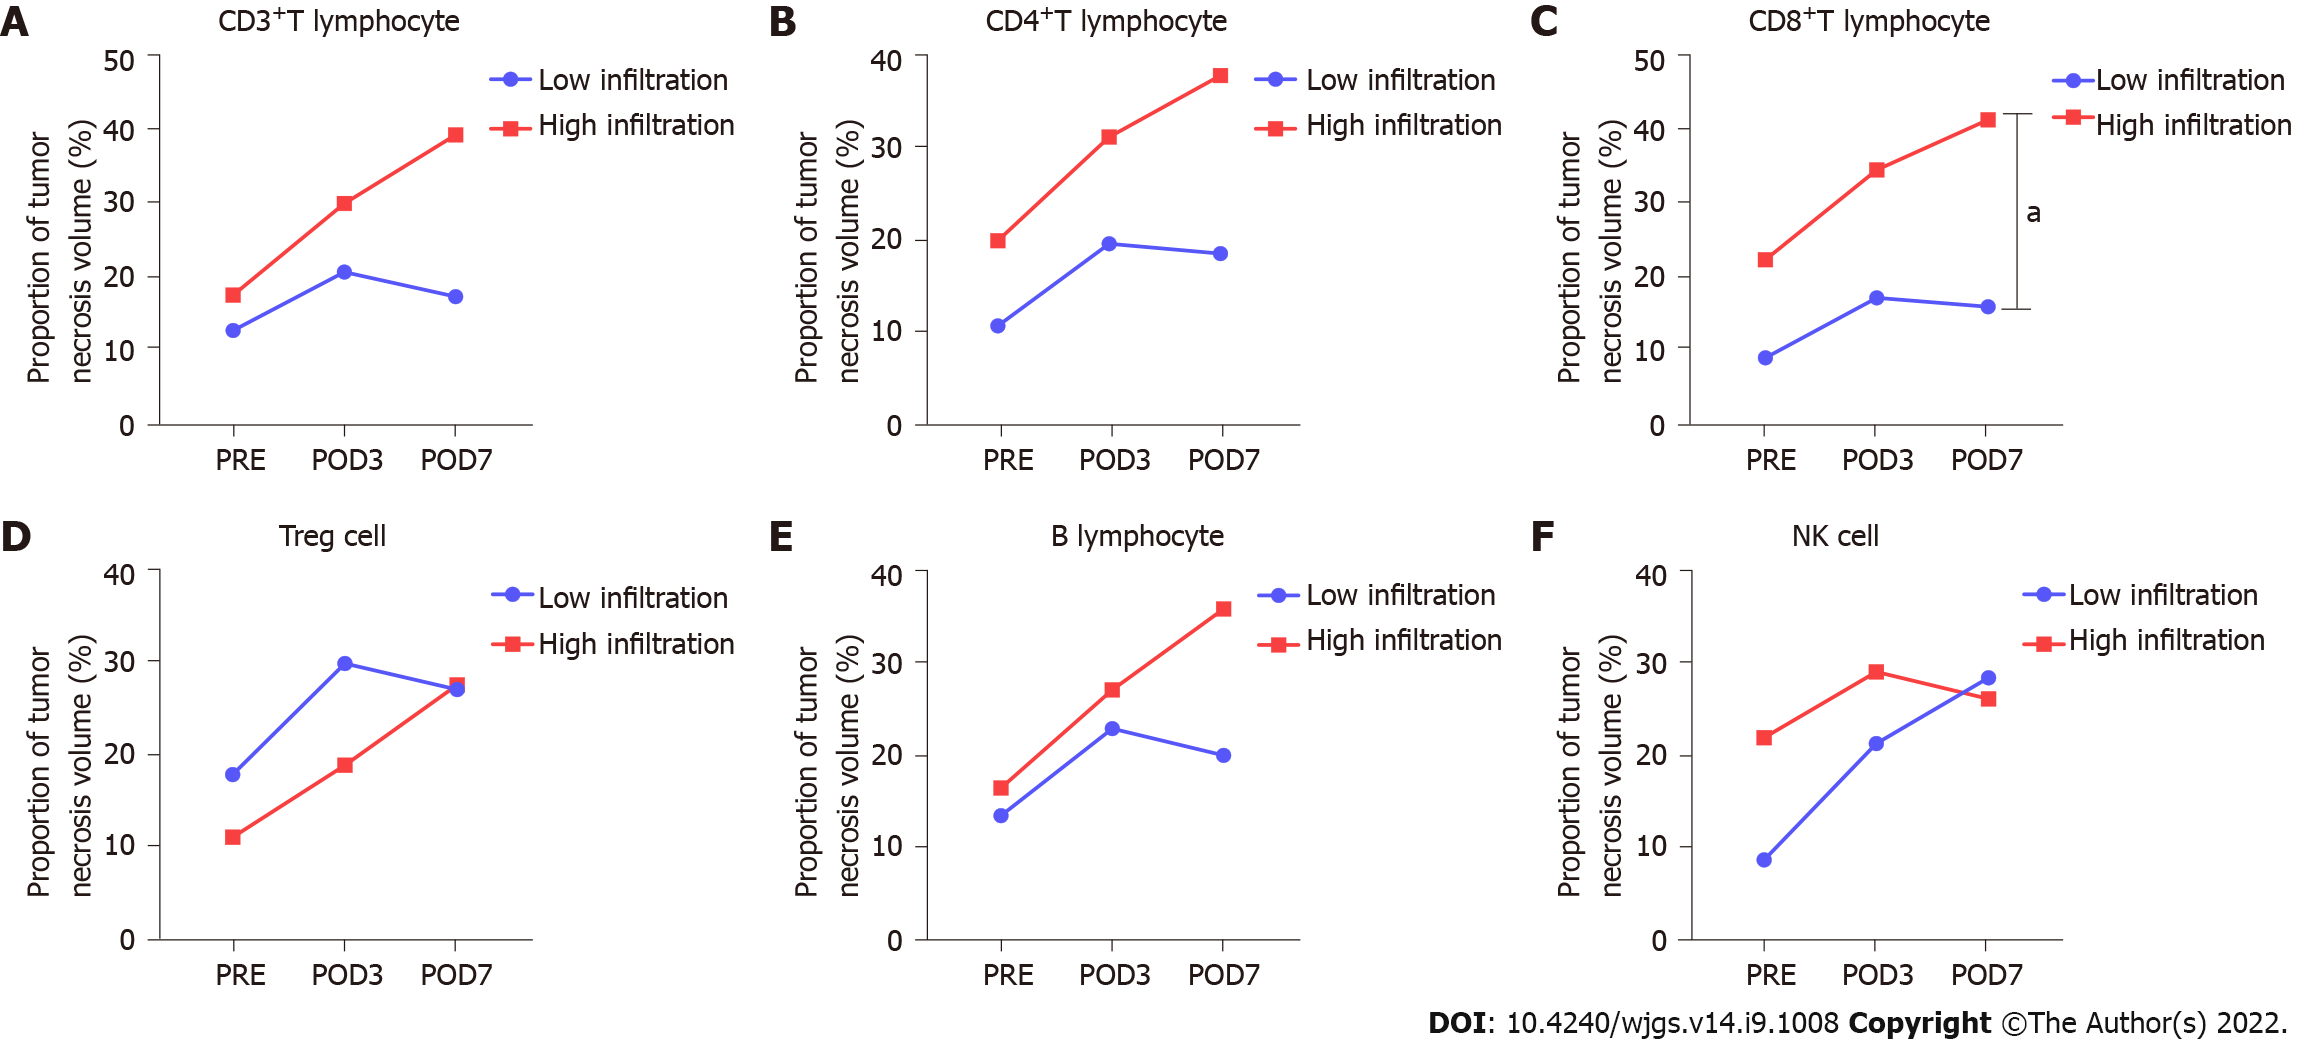
Figure 6 Relationship between the proportion of tumor necrosis volume and tumor-infiltrating lymphocyte subpopulations in perioperative period of stage-I associating liver partition and portal vein ligation for staged hepatectomy.
A: Proportion of tumor necrosis volume between high- and low- infiltration groups divided based on the positive expression level of CD3+ T cells; B: Proportion of tumor necrosis volume between high- and low- infiltration groups divided based on the positive expression level of CD4+ T cells; C: Proportion of tumor necrosis volume between high- and low- infiltration groups divided based on the positive expression level of CD8+ T cells; D: Proportion of tumor necrosis volume between high- and low- infiltration groups divided based on the positive expression level of Treg cells; E: Proportion of tumor necrosis volume between high- and low- infiltration groups divided based on the positive expression level of B cells; F: Proportion of tumor necrosis volume between high- and low- infiltration groups divided based on positive expression level of natural killer cells. aP < 0.05.
Figure 7 Changes in peripheral blood complement concentrations after stage-I and II associating liver partition and portal vein ligation for staged hepatectomy and right hemi-hepatectomy.
C1q and C3 in peripheral blood in stage-I associating liver partition and portal vein ligation for staged hepatectomy, were significantly higher than those in stage II. A: C1q; B: C3; C: C4. POD: Postoperative day; ALPPS: Associating liver partition and portal vein ligation for staged hepatectomy.
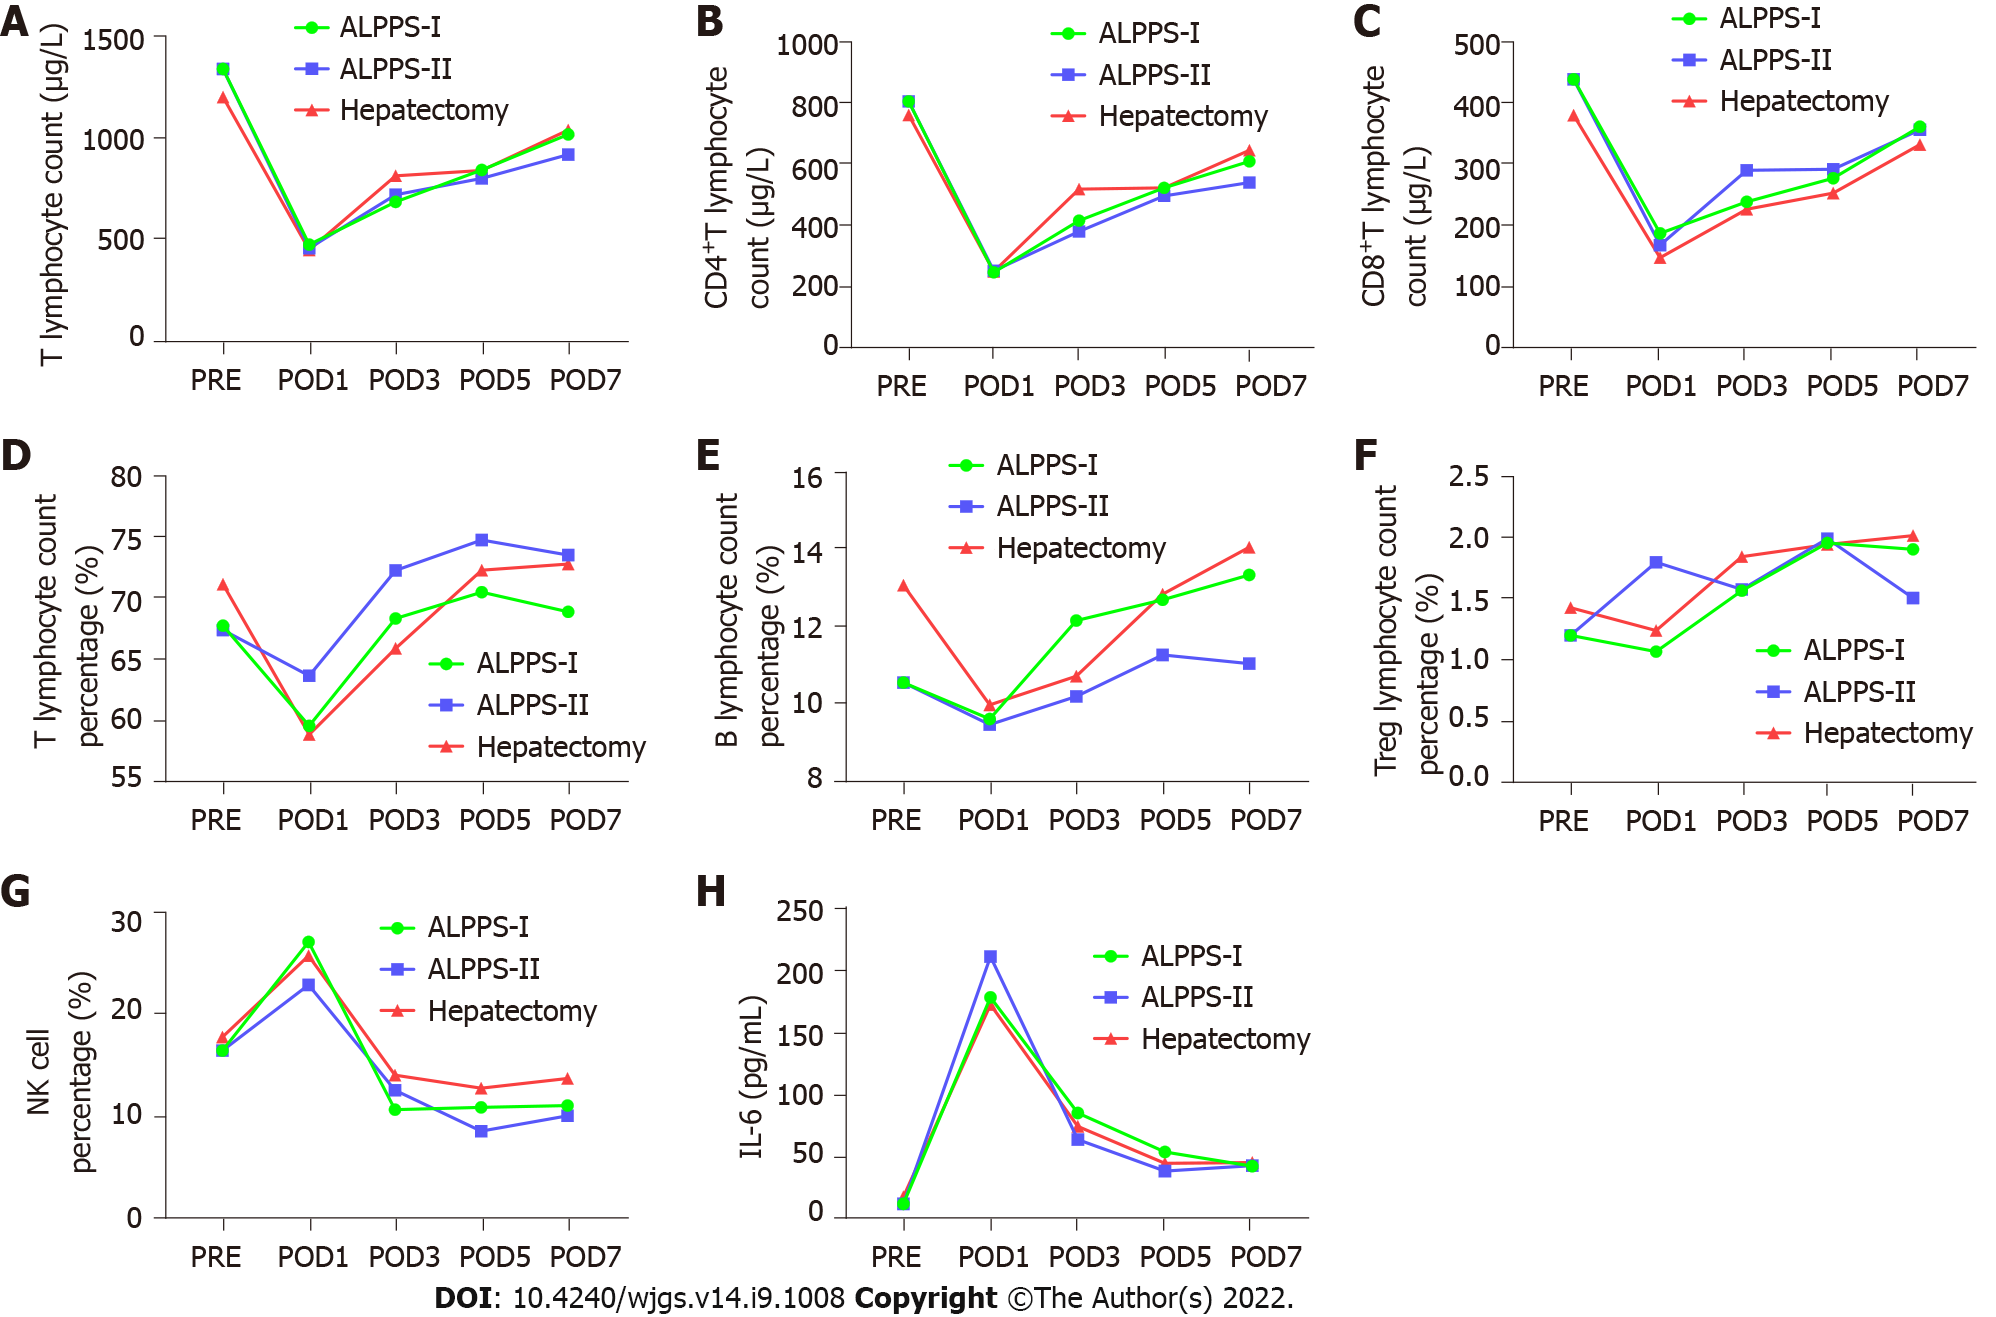
Figure 8 Changes in peripheral blood lymphocyte subpopulations after stage-I and II associating liver partition and portal vein ligation for staged hepatectomy and right hemi-hepatectomy.
Interleukin-6 levels in stage-I associating liver partition and portal vein ligation for staged hepatectomy (ALPPS) and stage-II ALPPS increased significantly and reached a peak value on the first day after surgery. Natural killer cells in stage-I and stage-II ALPPS temporarily increased on the first day after surgery and gradually decreased on the second day after surgery to figures lower than the preoperative level. A: T lymphocyte count (/μL); B: CD4+ T lymphocyte count (/μL); C: CD8+ T lymphocyte count (/μL); D: T lymphocyte percentage (%); E: B lymphocyte percentage (%); F: Treg lymphocyte percentage (%); G: Natural killer cells percentage (%); H: Interleukin-6 (pg/mL). NK: Natural killer; IL: Interleukin; POD: Postoperative day; ALPPS: Associating liver partition and portal vein ligation for staged hepatectomy.
Figure 9 Changes in peripheral blood immunoglobulins after stage-I and II associating liver partition and portal vein ligation for staged hepatectomy and right hemi-hepatectomy.
A: Immunoglobulin (Ig)A (g/L); B: IgG (g/L); C: IgM (g/L). Ig: Immunoglobulin; POD: Postoperative day; ALPPS: Associating liver partition and portal vein ligation for staged hepatectomy.
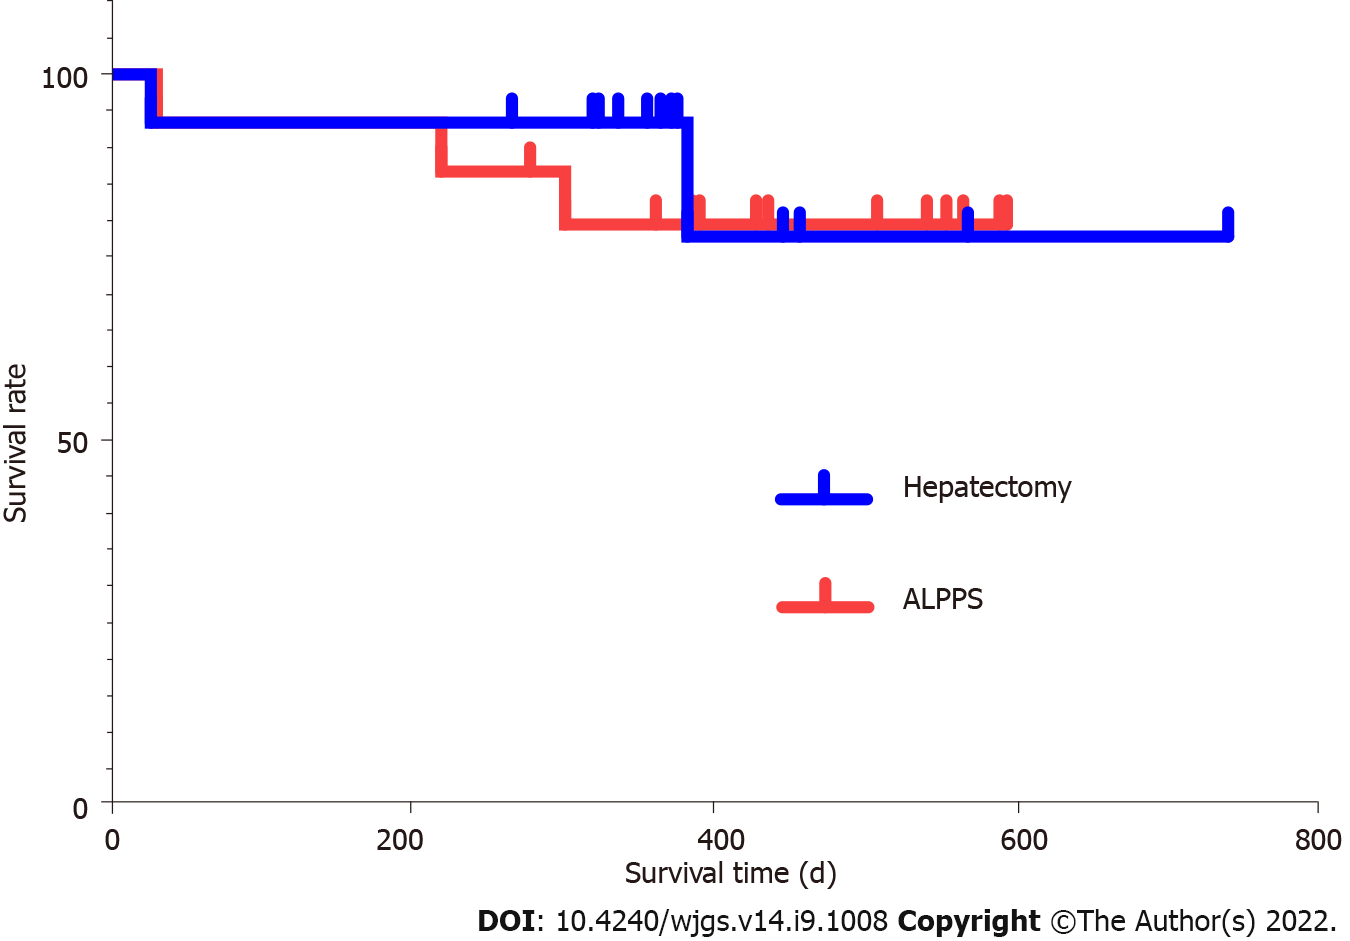
Figure 10 Comparison of survival rate between associating liver partition and portal vein ligation for staged hepatectomy group and right hemi-hepatectomy group.
The survival rate showed no significant difference between the two groups. ALPPS: Associating liver partition and portal vein ligation for staged hepatectomy.
- Citation: Wang W, Deng ZF, Wang JL, Zhang L, Bao L, Xu BH, Zhu H, Guo Y, Wen Z. Change of tumor-infiltrating lymphocyte of associating liver partition and portal vein ligation for staged hepatectomy for hepatocellular carcinoma. World J Gastrointest Surg 2022; 14(9): 1008-1025
- URL: https://www.wjgnet.com/1948-9366/full/v14/i9/1008.htm
- DOI: https://dx.doi.org/10.4240/wjgs.v14.i9.1008


