Copyright
©2014 Baishideng Publishing Group Co.
World J Gastrointest Oncol. Jan 15, 2014; 6(1): 22-33
Published online Jan 15, 2014. doi: 10.4251/wjgo.v6.i1.22
Published online Jan 15, 2014. doi: 10.4251/wjgo.v6.i1.22
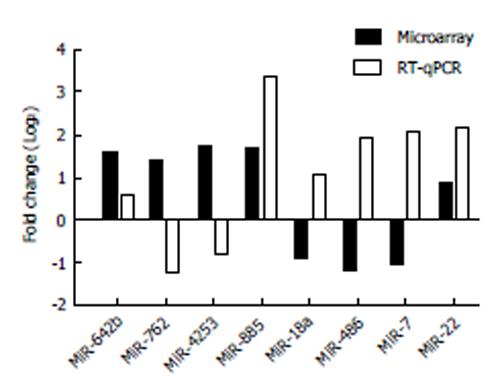
Figure 2 Confirmation study of the expression profile of eight microRNAs.
Microarray (solid bar) and RT-qPCR (open bar) data sets were analyzed based on the “Comparative C(T) Method”, normalized to miR-3196, and calculated as the ratio of mean fold change of pancreatic cancer patients (n = 8) to healthy controls (n = 11). MiRNA: MicroRNA.
- Citation: Ganepola GA, Rutledge JR, Suman P, Yiengpruksawan A, Chang DH. Novel blood-based microRNA biomarker panel for early diagnosis of pancreatic cancer. World J Gastrointest Oncol 2014; 6(1): 22-33
- URL: https://www.wjgnet.com/1948-5204/full/v6/i1/22.htm
- DOI: https://dx.doi.org/10.4251/wjgo.v6.i1.22


