Copyright
©The Author(s) 2024.
World J Gastrointest Oncol. Feb 15, 2024; 16(2): 436-457
Published online Feb 15, 2024. doi: 10.4251/wjgo.v16.i2.436
Published online Feb 15, 2024. doi: 10.4251/wjgo.v16.i2.436
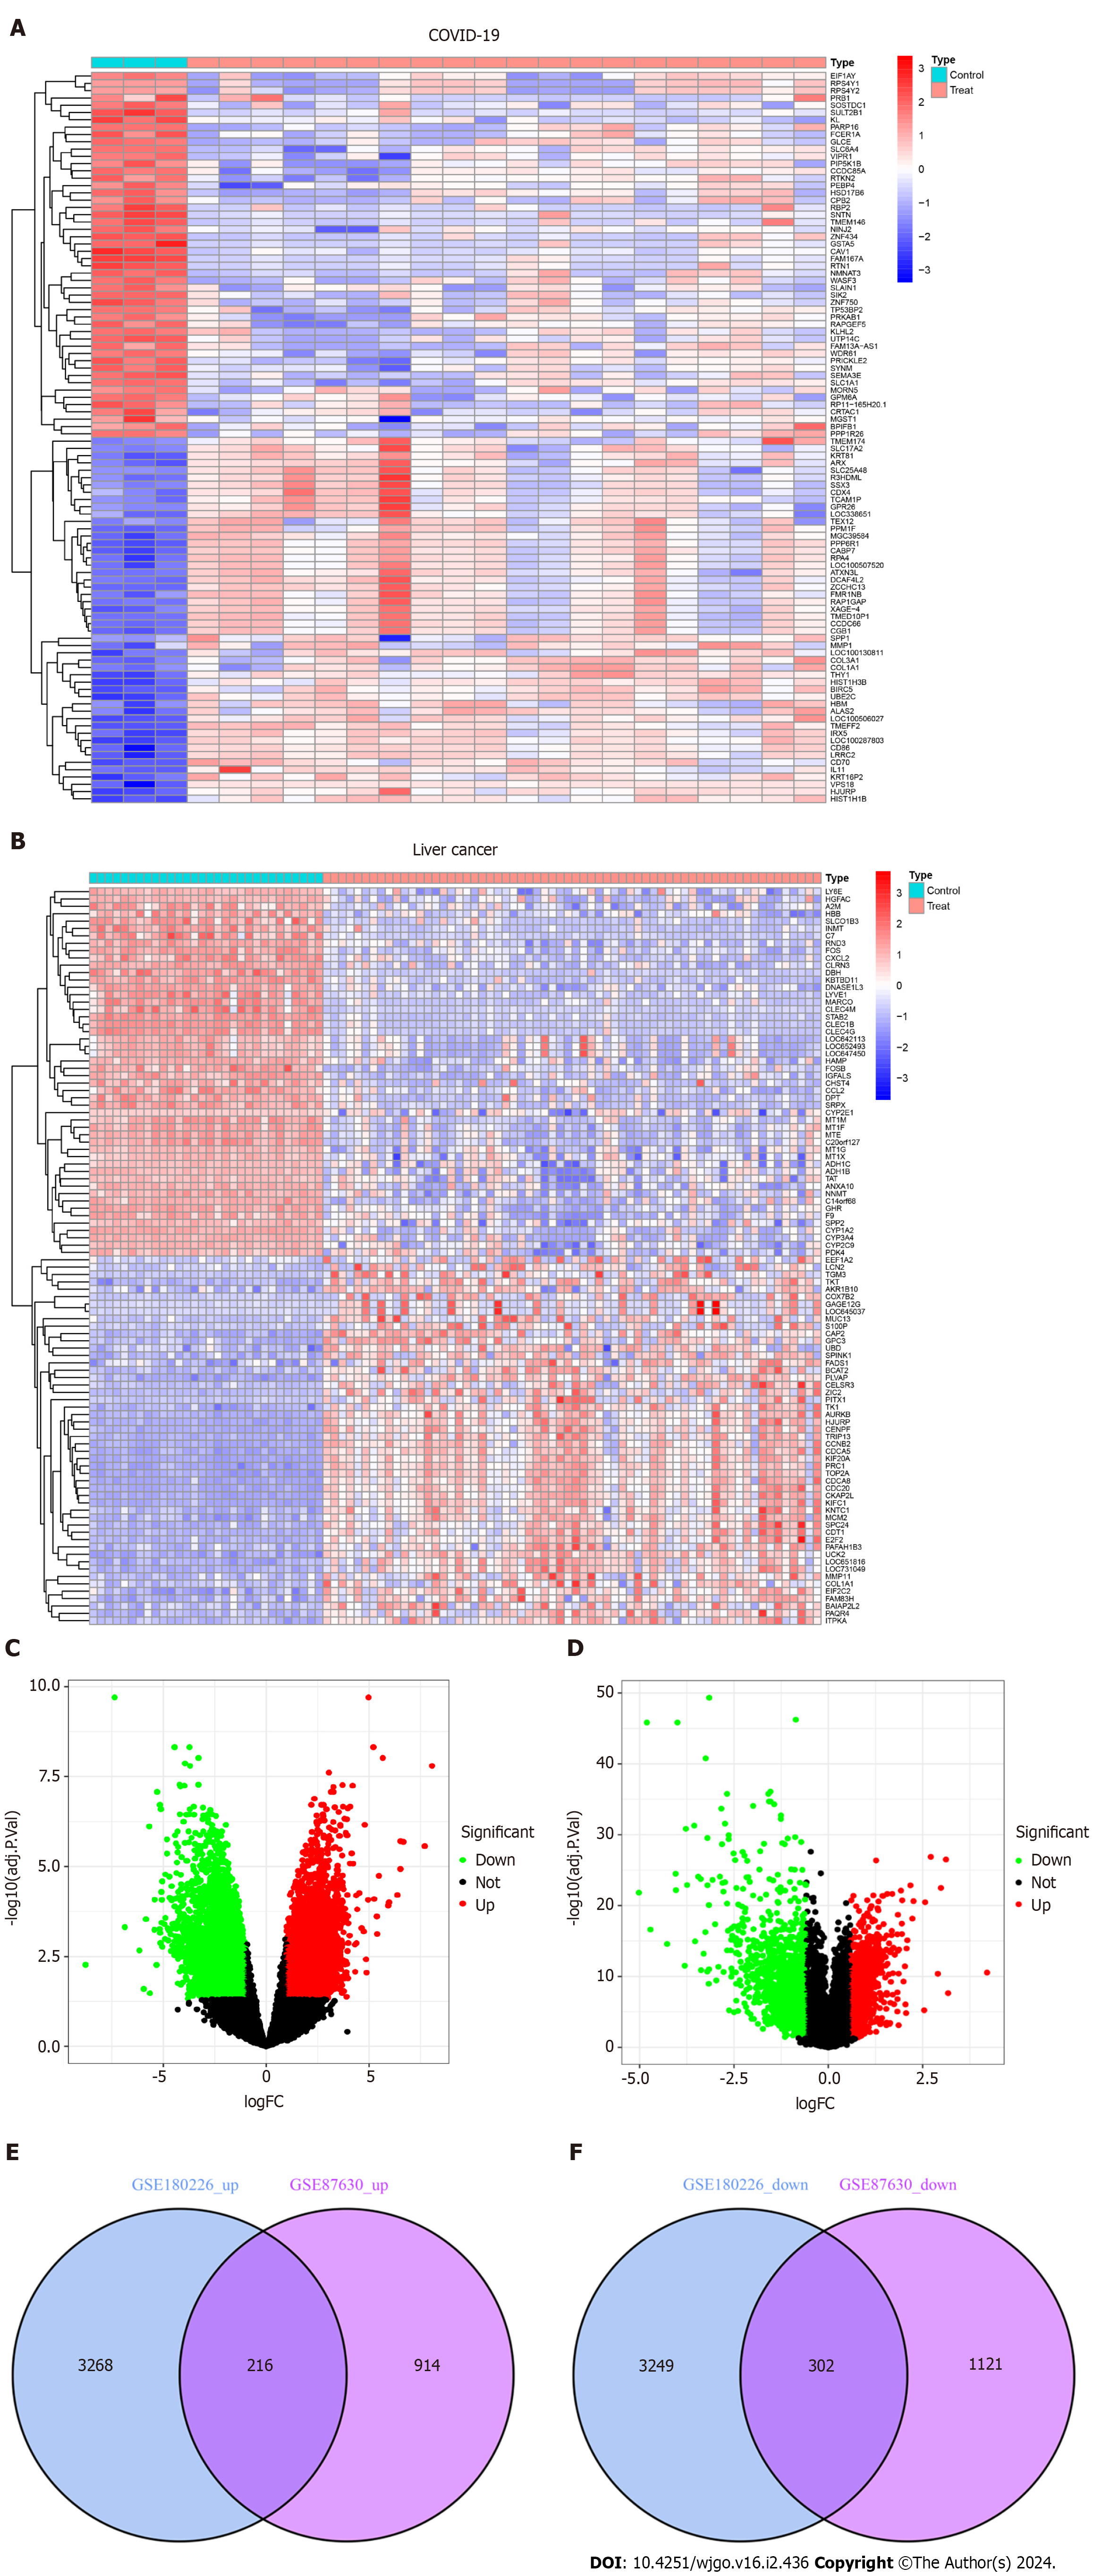
Figure 2 Volcanic diagram, heat map and Venn diagram.
A: Volcano map of GSE180226; B: Volcano map of GSE87630. Up-regulated genes are colored in red; down-regulated genes are colored in green; C: Cluster analysis of GSE180226; D: Cluster analysis of GSE87630; E: Two datasets showed 216 up-regulated shared differentially expressed genes (DEGs); F: Two datasets showed 302 down-regulated shared DEGs. COVID-19: Coronavirus disease 2019.
- Citation: Rong Y, Tang MZ, Liu SH, Li XF, Cai H. Comprehensive analysis of the potential pathogenesis of COVID-19 infection and liver cancer. World J Gastrointest Oncol 2024; 16(2): 436-457
- URL: https://www.wjgnet.com/1948-5204/full/v16/i2/436.htm
- DOI: https://dx.doi.org/10.4251/wjgo.v16.i2.436


