Copyright
©The Author(s) 2019.
World J Gastrointest Oncol. Mar 15, 2019; 11(3): 208-226
Published online Mar 15, 2019. doi: 10.4251/wjgo.v11.i3.208
Published online Mar 15, 2019. doi: 10.4251/wjgo.v11.i3.208
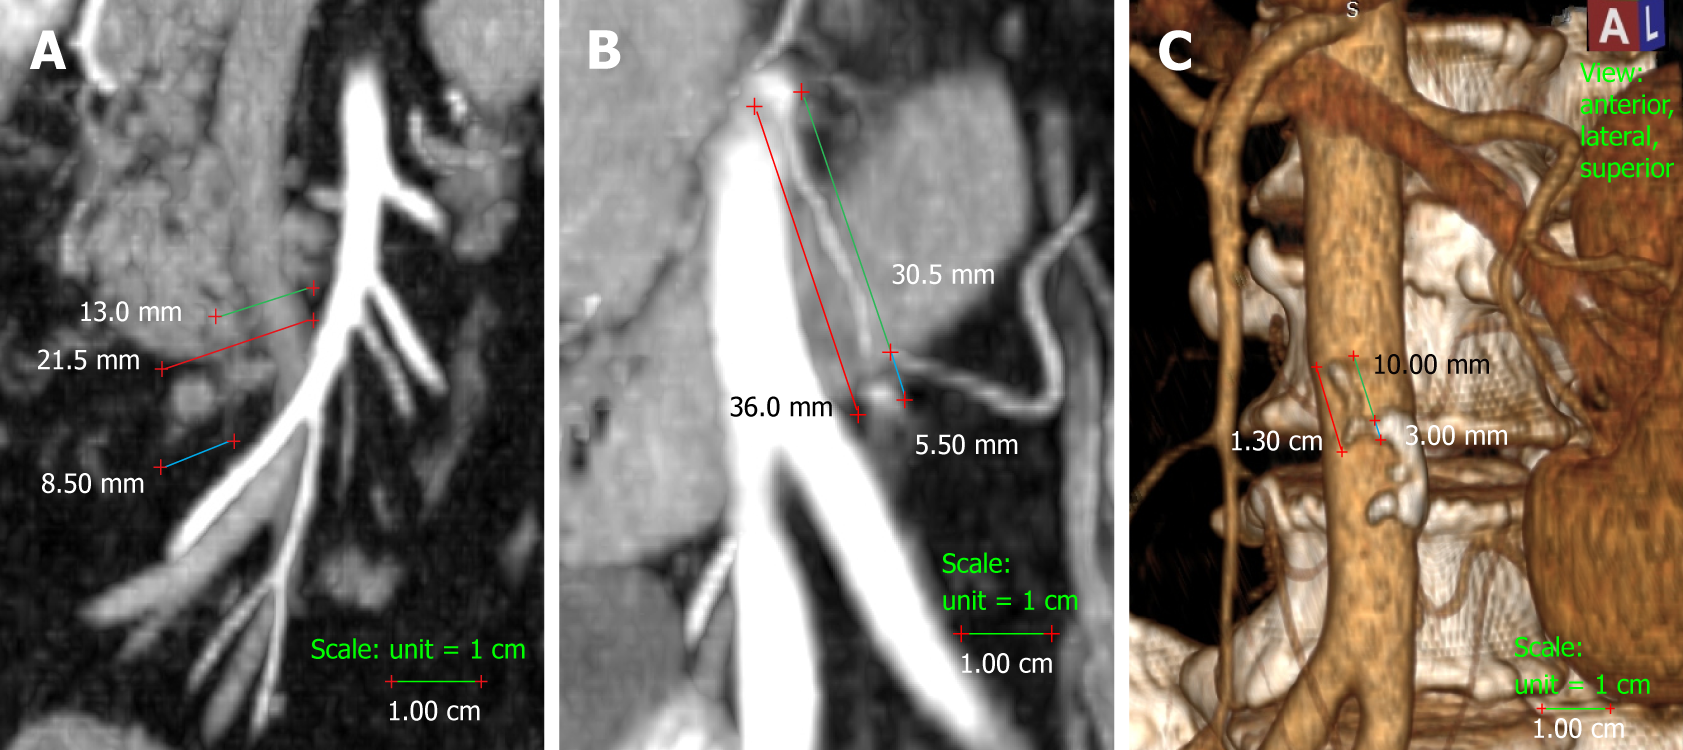
Figure 1 Representative cases of stump length measurement.
A: Actual ICA stump after a group A right colectomy. The lengths measured on contrast-enhanced CT were 21.5 mm – actual length with granuloma (red line), 13.0 mm – D2 predicted ligation level (green line), and 8.5 mm – D2 improvement potential (blue line); B: Actual IMA stump after a group A sigmoidectomy. The lengths measured on contrast-enhanced CT were 36.0 mm – actual length with granuloma (red line), 30.5 mm – D2 predicted ligation level (green line), and 5.50 mm – D2 improvement potential (blue line); C: Reconstruction in 3D form, showing the actual inferior mesenteric artery stump after a group A high ligation. The measurements on contrast-enhanced CT were 13.0 mm – actual length (red line), 10.0 mm – D3 predicted ligation level (green line), and 3.0 mm – D3 improvement potential (blue line). The scale bar illustrates the size of 1 cm. CT: Computed tomography; ICA: Ileocolic artery; IMA: Inferior mesenteric artery.
- Citation: Livadaru C, Morarasu S, Frunza TC, Ghitun FA, Paiu-Spiridon EF, Sava F, Terinte C, Ferariu D, Lunca S, Dimofte GM. Post-operative computed tomography scan – reliable tool for quality assessment of complete mesocolic excision. World J Gastrointest Oncol 2019; 11(3): 208-226
- URL: https://www.wjgnet.com/1948-5204/full/v11/i3/208.htm
- DOI: https://dx.doi.org/10.4251/wjgo.v11.i3.208


