Copyright
©The Author(s) 2017.
World J Gastrointest Oncol. Jun 15, 2017; 9(6): 257-262
Published online Jun 15, 2017. doi: 10.4251/wjgo.v9.i6.257
Published online Jun 15, 2017. doi: 10.4251/wjgo.v9.i6.257
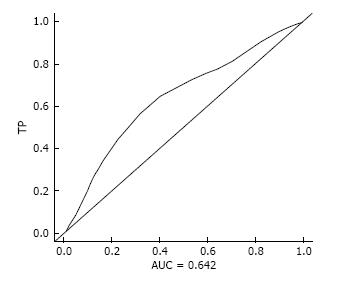
Figure 1 Receiver operating characteristic curve for three years survival (AUC = 0.
642, TP = 0.536, FP = 0.248).
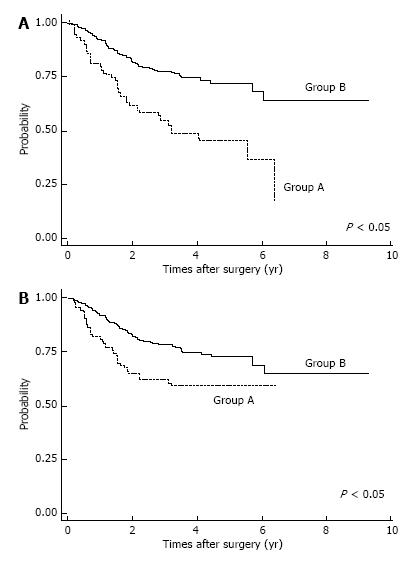
Figure 2 Overall survival (A) and cause-specific survival (B) in two aged group after IPTW method.
OS and CSS were significantly lower in Group A than Group B (P < 0.05). OS: Overall survival; CSS: Cause-specific survival; IPTW: Inverse probability of treatment weighting.
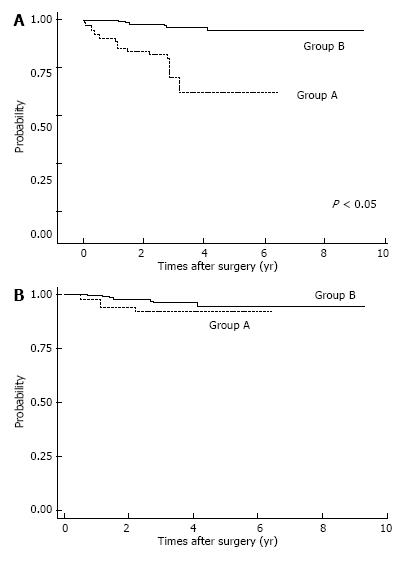
Figure 3 Overall survival (A) and cause-specific survival (B) by age group among patients with pStage I gastric cancer who underwent gastrectomy.
OS was significantly lower significantly lower in Group A than Group B after IPTW method (P < 0.05). OS: Overall survival; CSS: Cause-specific survival; IPTW: Inverse probability of treatment weighting.
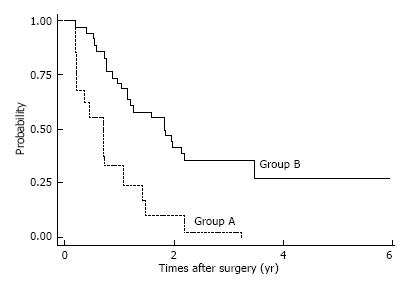
Figure 4 Cause-specific survival and overall survival by age group among patients with pStage IV gastric cancer who underwent gastrectomy; after IPTW method.
CCS and OS were significantly lower in Group A than Group B (P < 0.05). OS: Overall survival; CSS: Cause-specific survival; IPTW: Inverse probability of treatment weighting..
- Citation: Fujiwara Y, Fukuda S, Tsujie M, Ishikawa H, Kitani K, Inoue K, Yukawa M, Inoue M. Effects of age on survival and morbidity in gastric cancer patients undergoing gastrectomy. World J Gastrointest Oncol 2017; 9(6): 257-262
- URL: https://www.wjgnet.com/1948-5204/full/v9/i6/257.htm
- DOI: https://dx.doi.org/10.4251/wjgo.v9.i6.257


