Copyright
©The Author(s) 2017.
World J Gastrointest Oncol. Apr 15, 2017; 9(4): 166-175
Published online Apr 15, 2017. doi: 10.4251/wjgo.v9.i4.166
Published online Apr 15, 2017. doi: 10.4251/wjgo.v9.i4.166
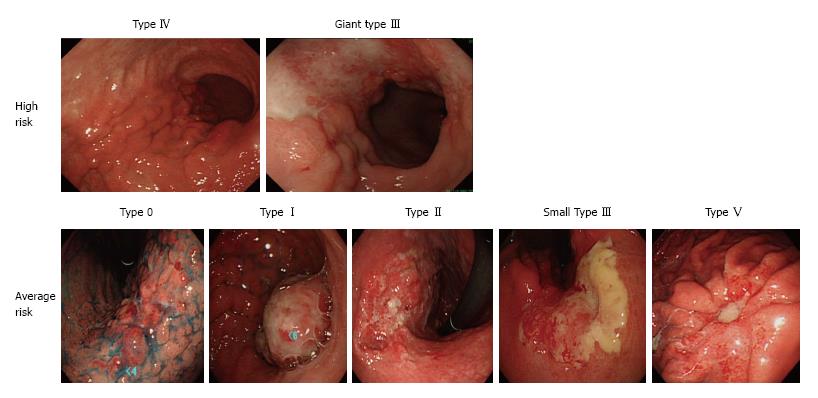
Figure 1 Representative gastroendoscopy images of advanced gastric cancer by macroscopic classification.
Upper panels include high-risk macroscopic features of type IV (left) and giant type III (right). Lower panels include average risk macroscopic features of type 0, type I, type II, small type III, and type V (in order from left to right).
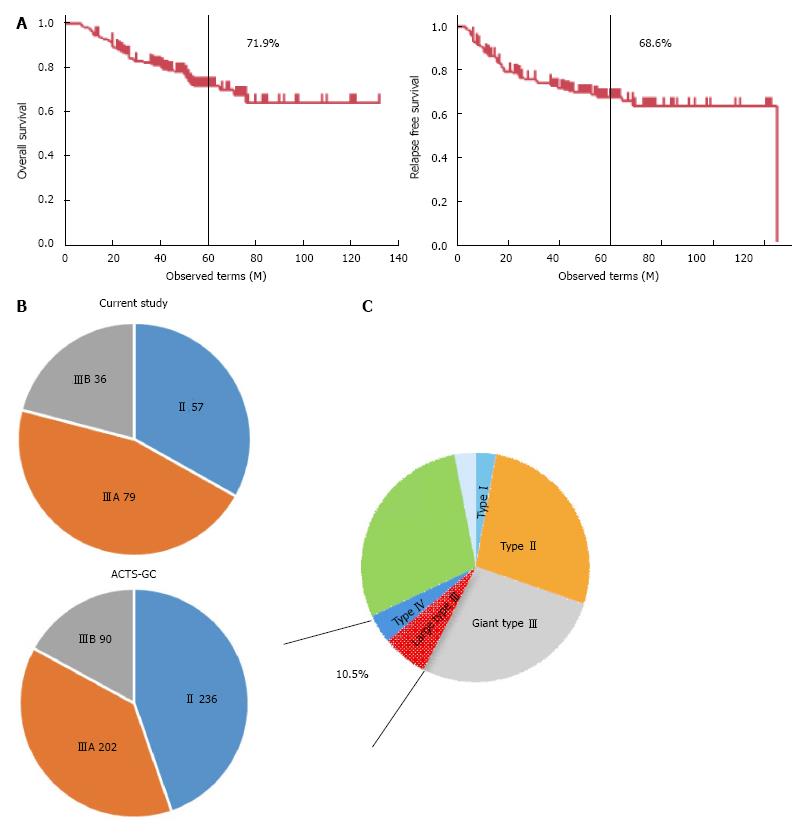
Figure 2 Prognosis of pathological stage II/III advanced gastric cancer patients who underwent curative gastrectomy followed by S1 postoperative adjuvant chemotherapy.
A: Kaplan-Meier curves for overall survival (OS) (upper panel) and relapse free survival (RFS). Five year survival is shown; B: Stage distribution of pathological stage according to the 13th Japanese Gastric Cancer Association stage in Kitasato University in comparison with the ACTS-GC trial; C: Rate of each macroscopic feature in pathological stage II/III advanced gastric cancer. High-risk macroscopic features (type IV and giant type III) are seen in 10.5% as shown in this figure.
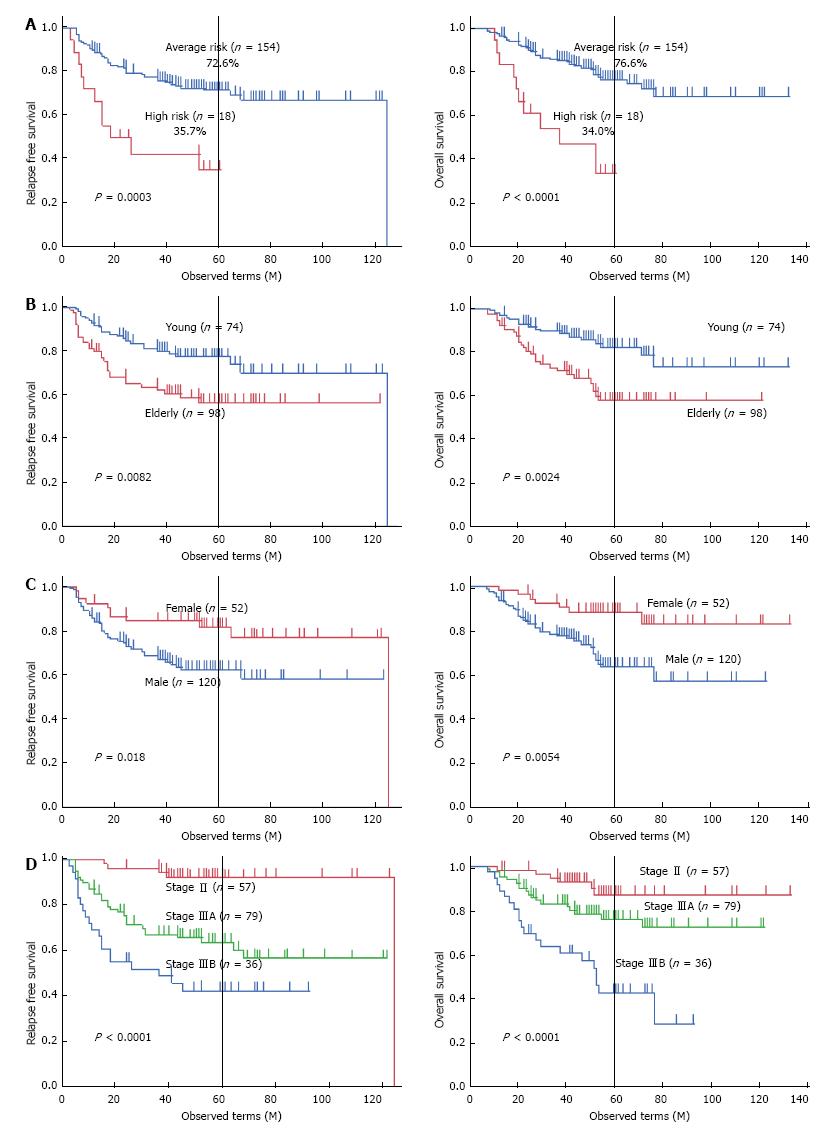
Figure 3 Survival curve of independent prognostic factors with regard to relapse free survival (left panel) and overall survival (right panel).
A: Survival curve according to macroscopic features for the high-risk group and the average-risk group. Five-year survival is shown; B: Survival curve by age; C: Survival curve by sex; D: Survival curve by pathological stage according to the 13th JGCA stage. JGCA: Japanese Gastric Cancer Association.
- Citation: Yamashita K, Ema A, Hosoda K, Mieno H, Moriya H, Katada N, Watanabe M. Macroscopic appearance of Type IV and giant Type III is a high risk for a poor prognosis in pathological stage II/III advanced gastric cancer with postoperative adjuvant chemotherapy. World J Gastrointest Oncol 2017; 9(4): 166-175
- URL: https://www.wjgnet.com/1948-5204/full/v9/i4/166.htm
- DOI: https://dx.doi.org/10.4251/wjgo.v9.i4.166


