Copyright
©2013 Baishideng Publishing Group Co.
World J Gastrointest Oncol. Feb 15, 2013; 5(2): 38-42
Published online Feb 15, 2013. doi: 10.4251/wjgo.v5.i2.38
Published online Feb 15, 2013. doi: 10.4251/wjgo.v5.i2.38
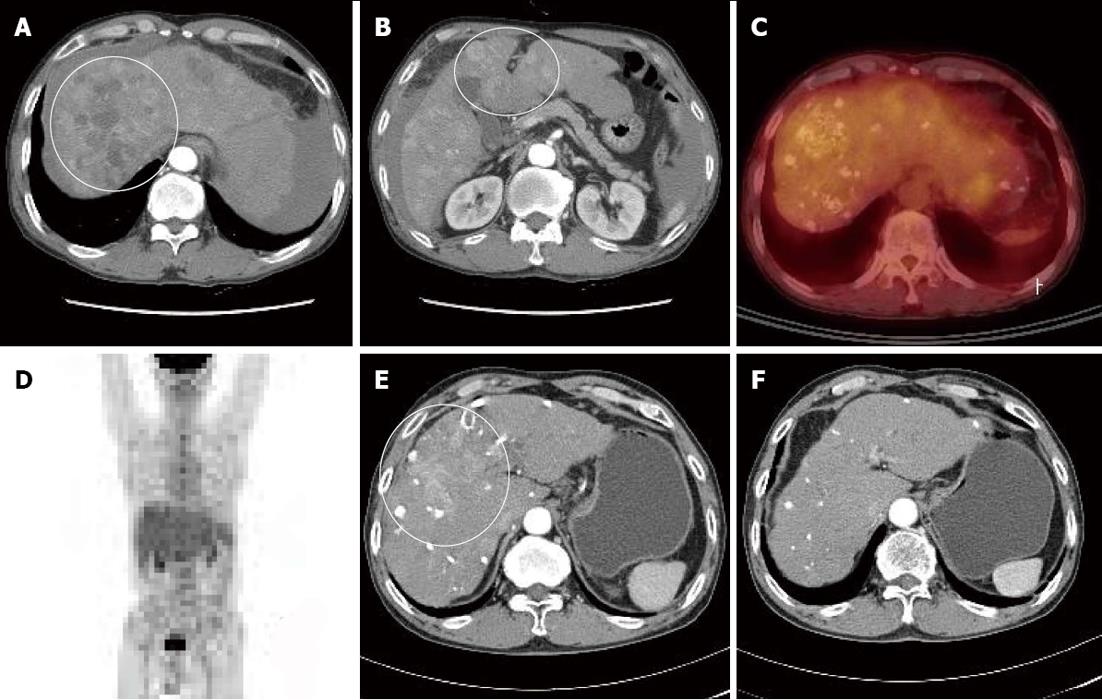
Figure 1 Computed tomography of the patient.
A, B: Computed tomography (CT) scan taken at the time of hepatocellular carcinoma (HCC) diagnosis showing intrahepatic multinodular HCCs (white circles); C, D: Positron emission tomography CT scan showing multiple lipiodolized masses and abnormal fluorine-18 2-fluoro-2-deoxy-D-glucose uptake on liver (no distant metastasis was found); E, F: After repetitive transarterial chemoembolization, a viable hypervascular mass remained (E, white circle), but after 6 mo of oral sorafenib, this was not detected by liver dynamic CT (F, arterial phase).
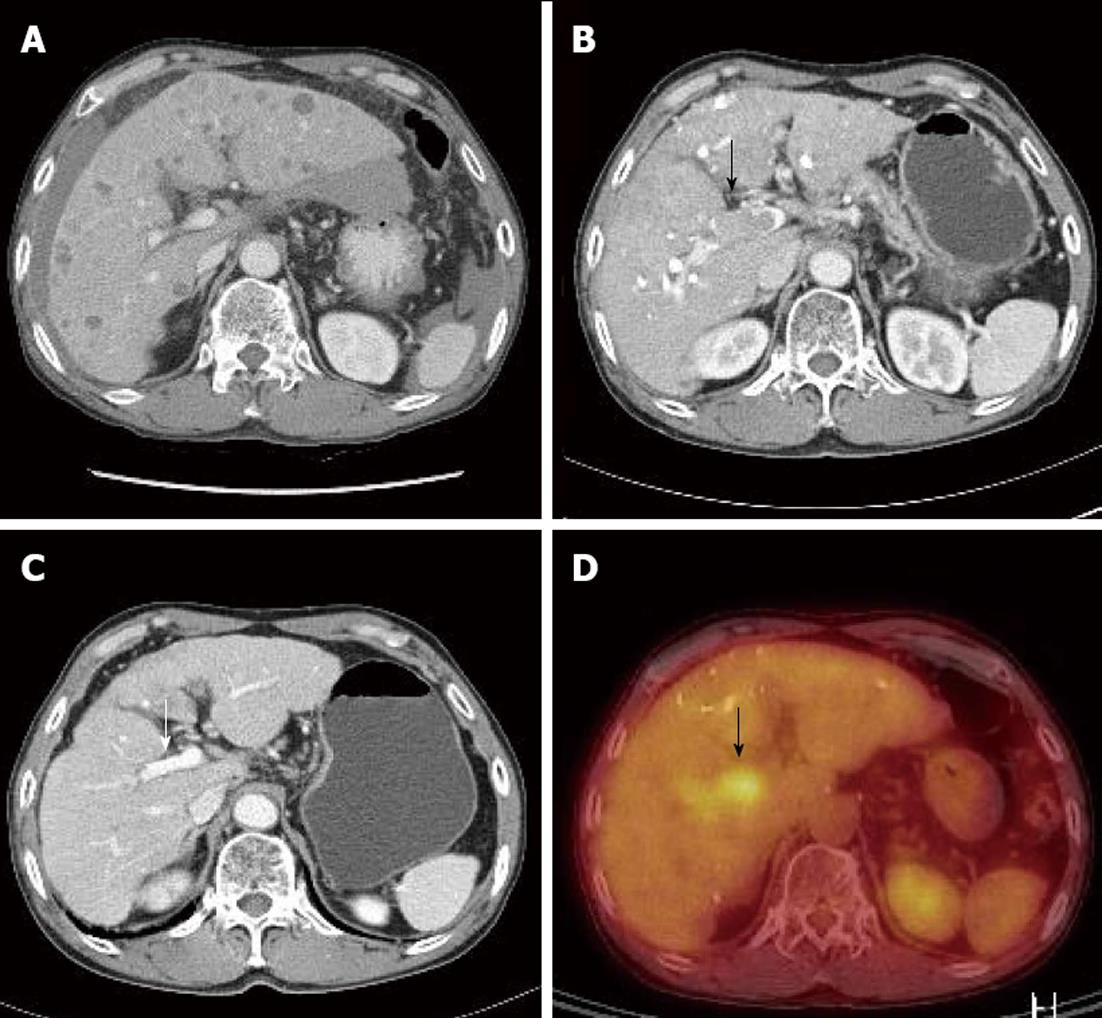
Figure 2 The diagnosis of portal vein tumor.
A, B, D: Portal vein tumor (A), which was not evident at diagnosis, was detected by liver dynamic computed tomography (CT) (B, black arrow) and positron emission tomography-CT (D, black arrow) after four sessions of transarterial chemoembolization; C: Portal vein tumor improved after 3 mo of sorafenib (white arrow).
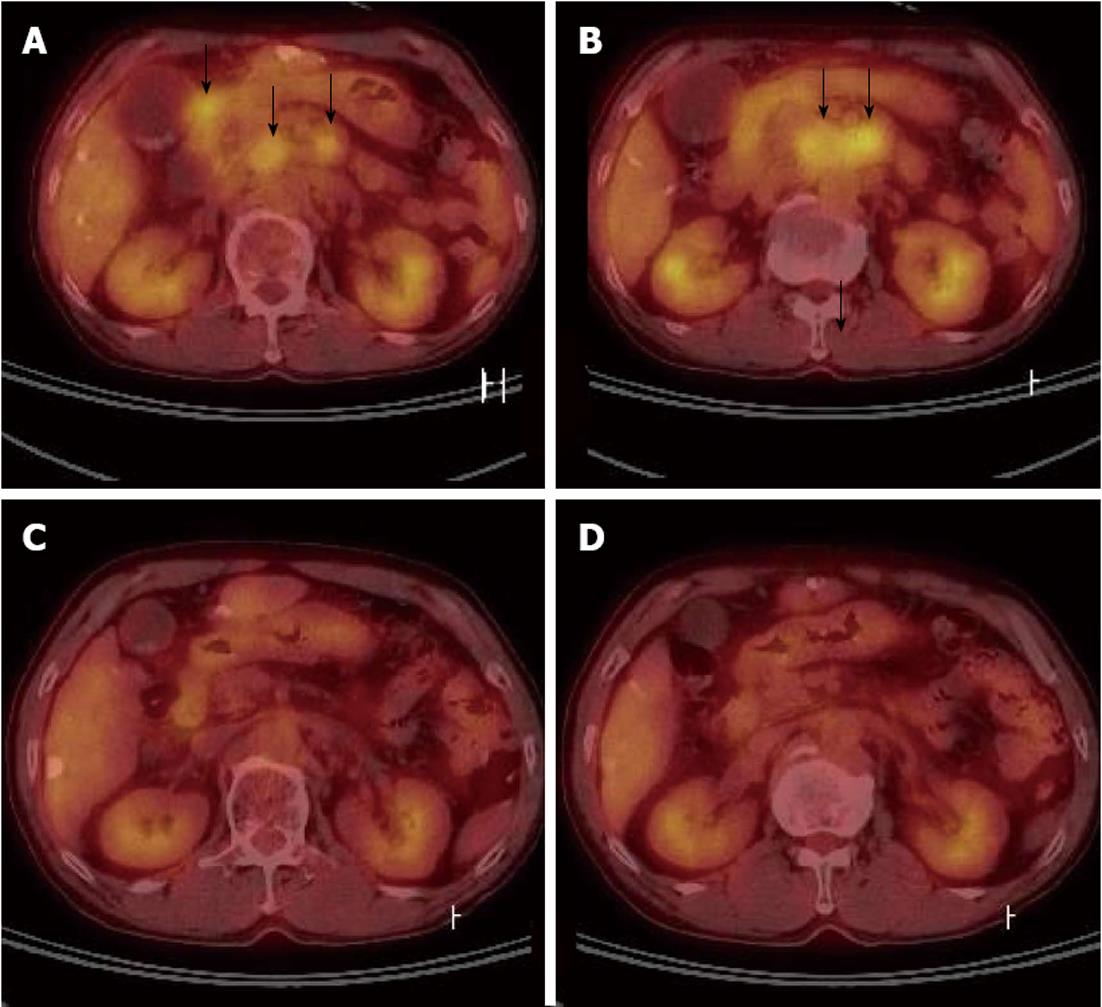
Figure 3 Positron emission tomography computed tomography.
A, B: After four sessions of transarterial chemoembolization, significant multiple abdominal lymphadenopathy was detected by positron emission tomography (PET)-computed tomography (CT) (black arrows); C, D: Fluorine-18 2-fluoro-2-deoxy-D-glucose uptakes disappeared on follow up PET-CT scans taken after 6 mo on sorafenib.
- Citation: Kim MS, Jin YJ, Lee JW, Lee JI, Kim YS, Lee SY, Chae MH. Complete remission of advanced hepatocellular carcinoma by sorafenib: A case report. World J Gastrointest Oncol 2013; 5(2): 38-42
- URL: https://www.wjgnet.com/1948-5204/full/v5/i2/38.htm
- DOI: https://dx.doi.org/10.4251/wjgo.v5.i2.38


