Copyright
©2013 Baishideng Publishing Group Co.
World J Gastrointest Oncol. Dec 15, 2013; 5(12): 230-234
Published online Dec 15, 2013. doi: 10.4251/wjgo.v5.i12.230
Published online Dec 15, 2013. doi: 10.4251/wjgo.v5.i12.230
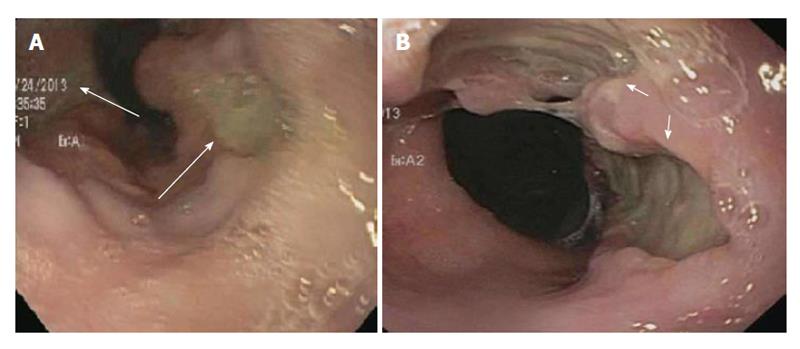
Figure 1 Esophageal ulcers (arrows) noted on upper endoscopy on initial presentation (A), and repeat endoscopy 10 d later shows significantly enlarged ulcers (arrows) (B).
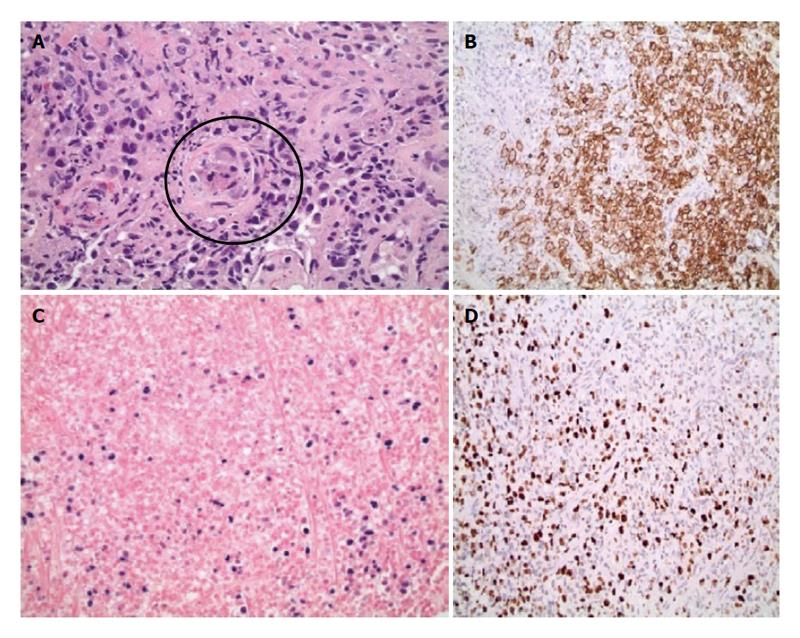
Figure 2 Biopsy results.
A: Esophageal biopsy, with circled area showing a large endothelial cell with cytomegalovirus inclusions; B: Positive CD20 staining; C: Epstein Barr virus encoded RNA in situ hybridization showing positive staining; D: Positive Ki-67 staining in most of the lymphoma cells.
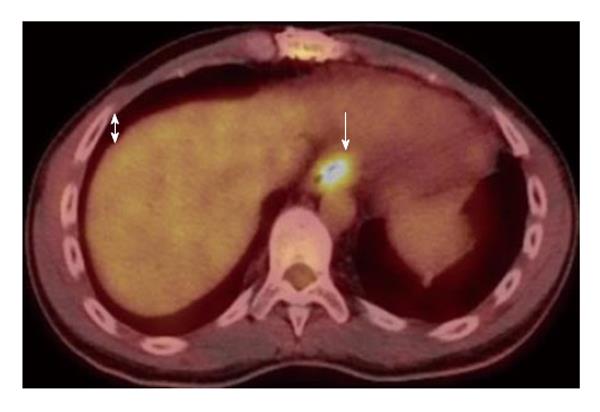
Figure 3 Above shows a coronal section of positron emission tomography-computed tomography showing increased uptake at the gastroesophageal junction.
Green arrow points to the area of increased activity.
- Citation: Haverkos BM, Oza VM, Johnson A, Walker J, Shana’ah A. Rare presentation of post-transplant lymphoproliferative disorder isolated to gastroesophageal junction. World J Gastrointest Oncol 2013; 5(12): 230-234
- URL: https://www.wjgnet.com/1948-5204/full/v5/i12/230.htm
- DOI: https://dx.doi.org/10.4251/wjgo.v5.i12.230


