
















Copyright: ©Author(s) 2026.
World J Gastrointest Oncol. Nov 15, 2026; 18(11): 123857
Published online Nov 15, 2026. doi: 10.4251/wjgo.123857
Published online Nov 15, 2026. doi: 10.4251/wjgo.123857
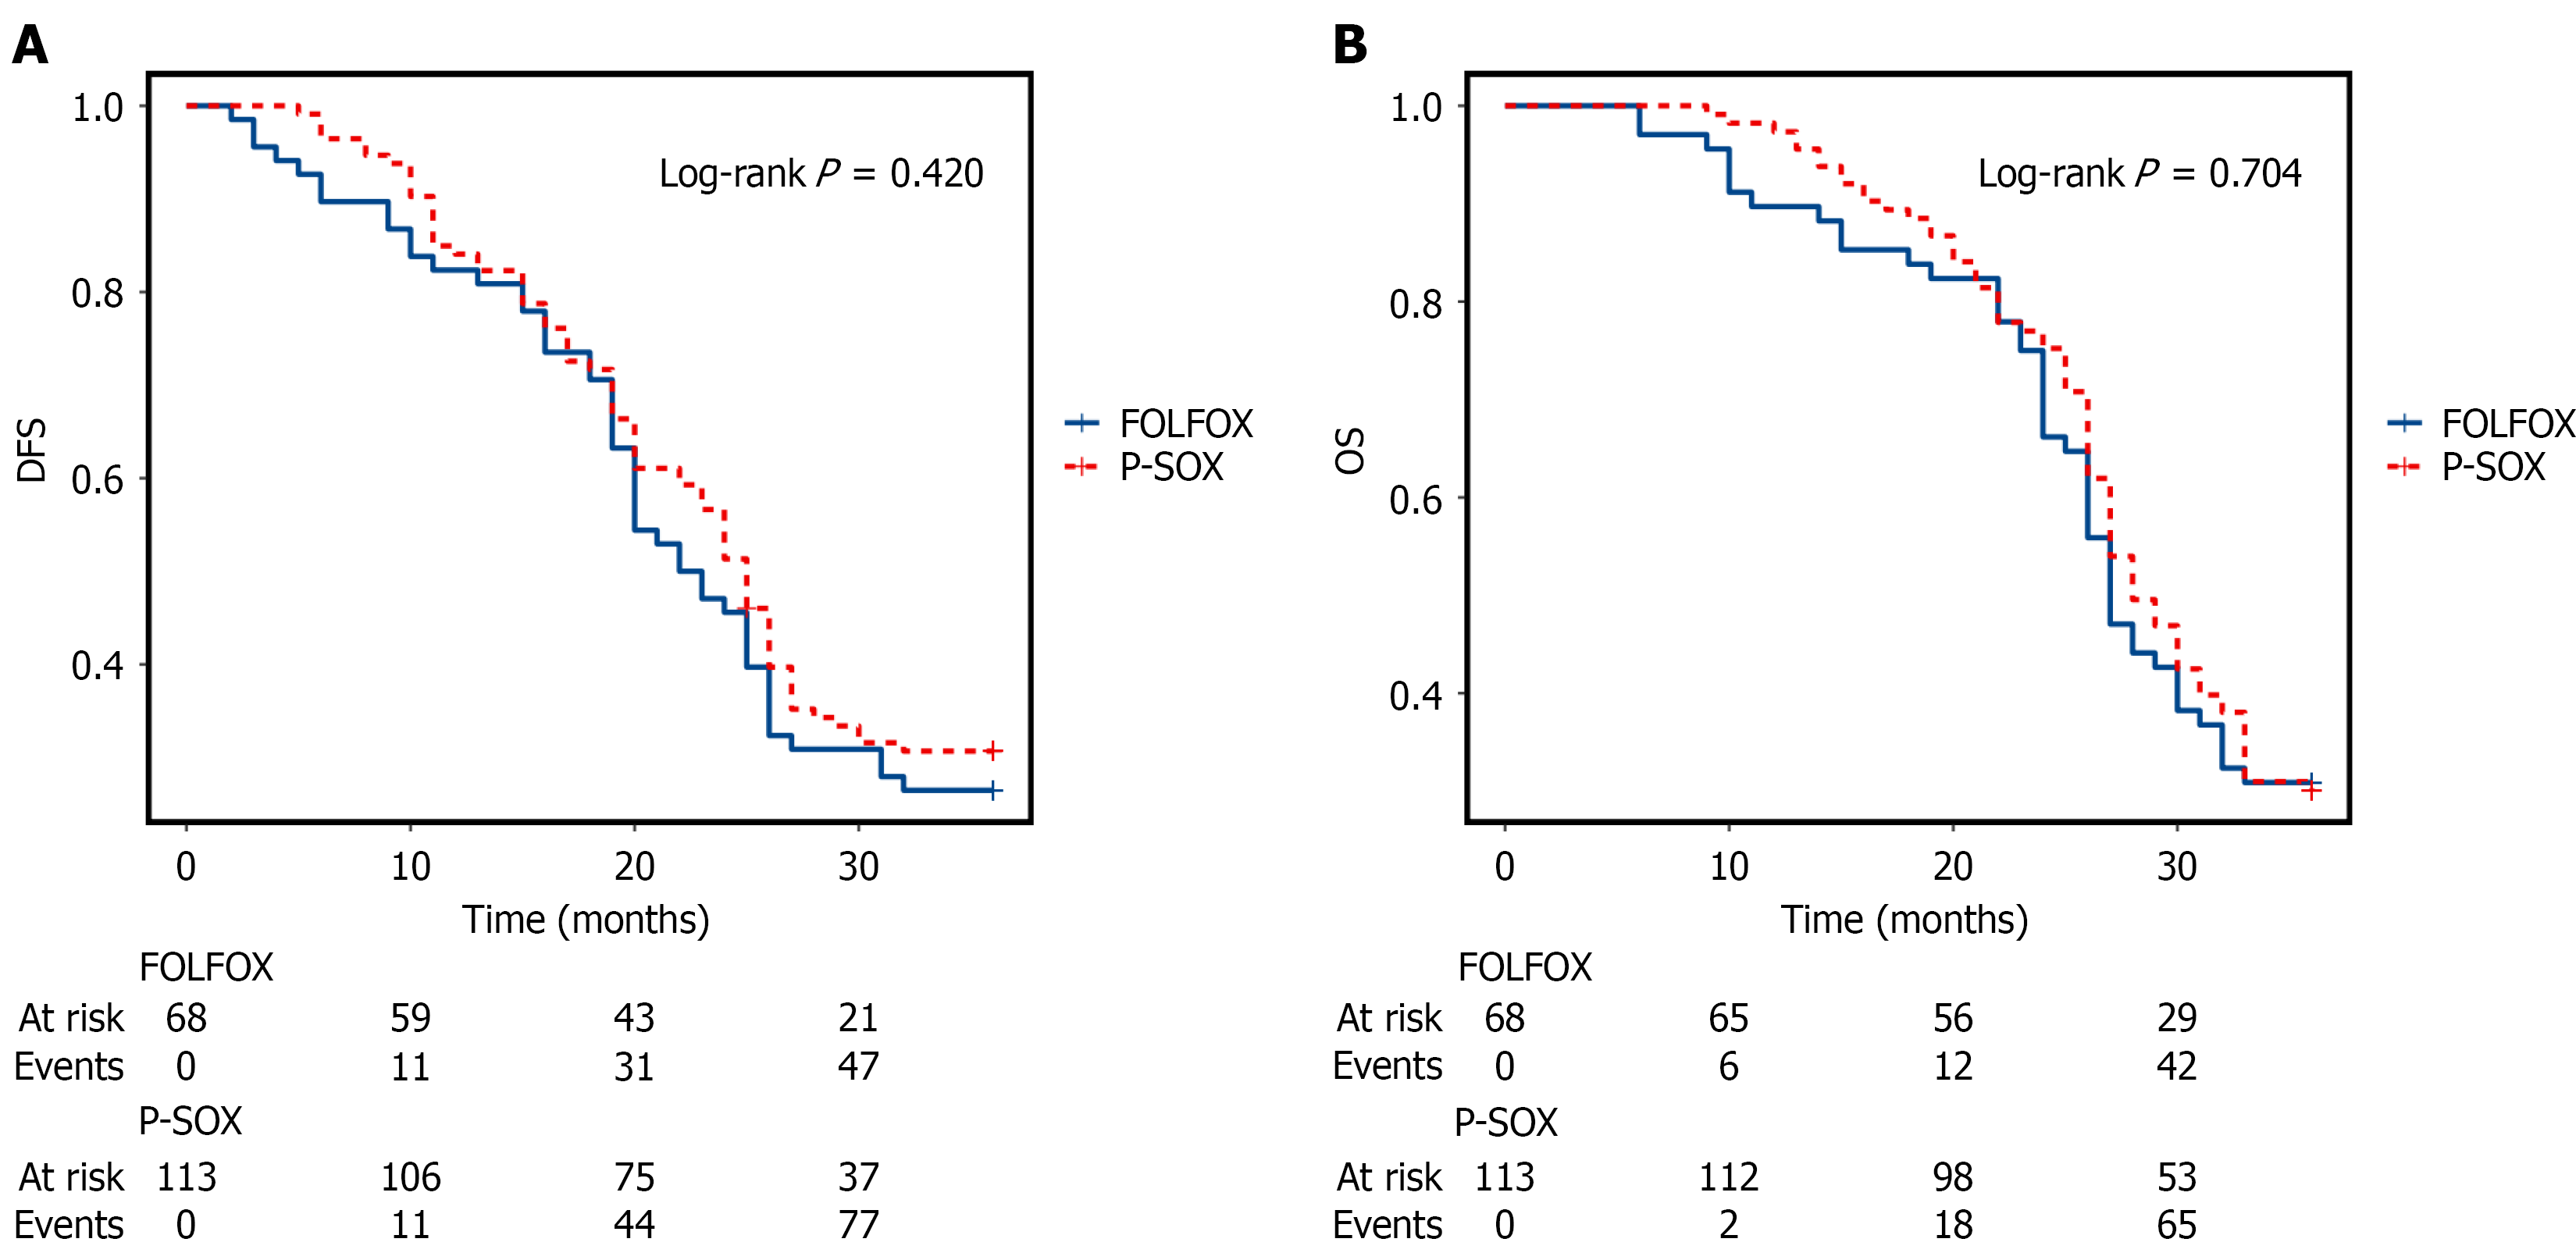
Figure 1 Comparison of disease-free survival and overall survival between the FOLFOX and P-SOX groups.
A: Disease-free survival; B: Overall survival. DFS: Disease-free survival; OS: Overall survival.
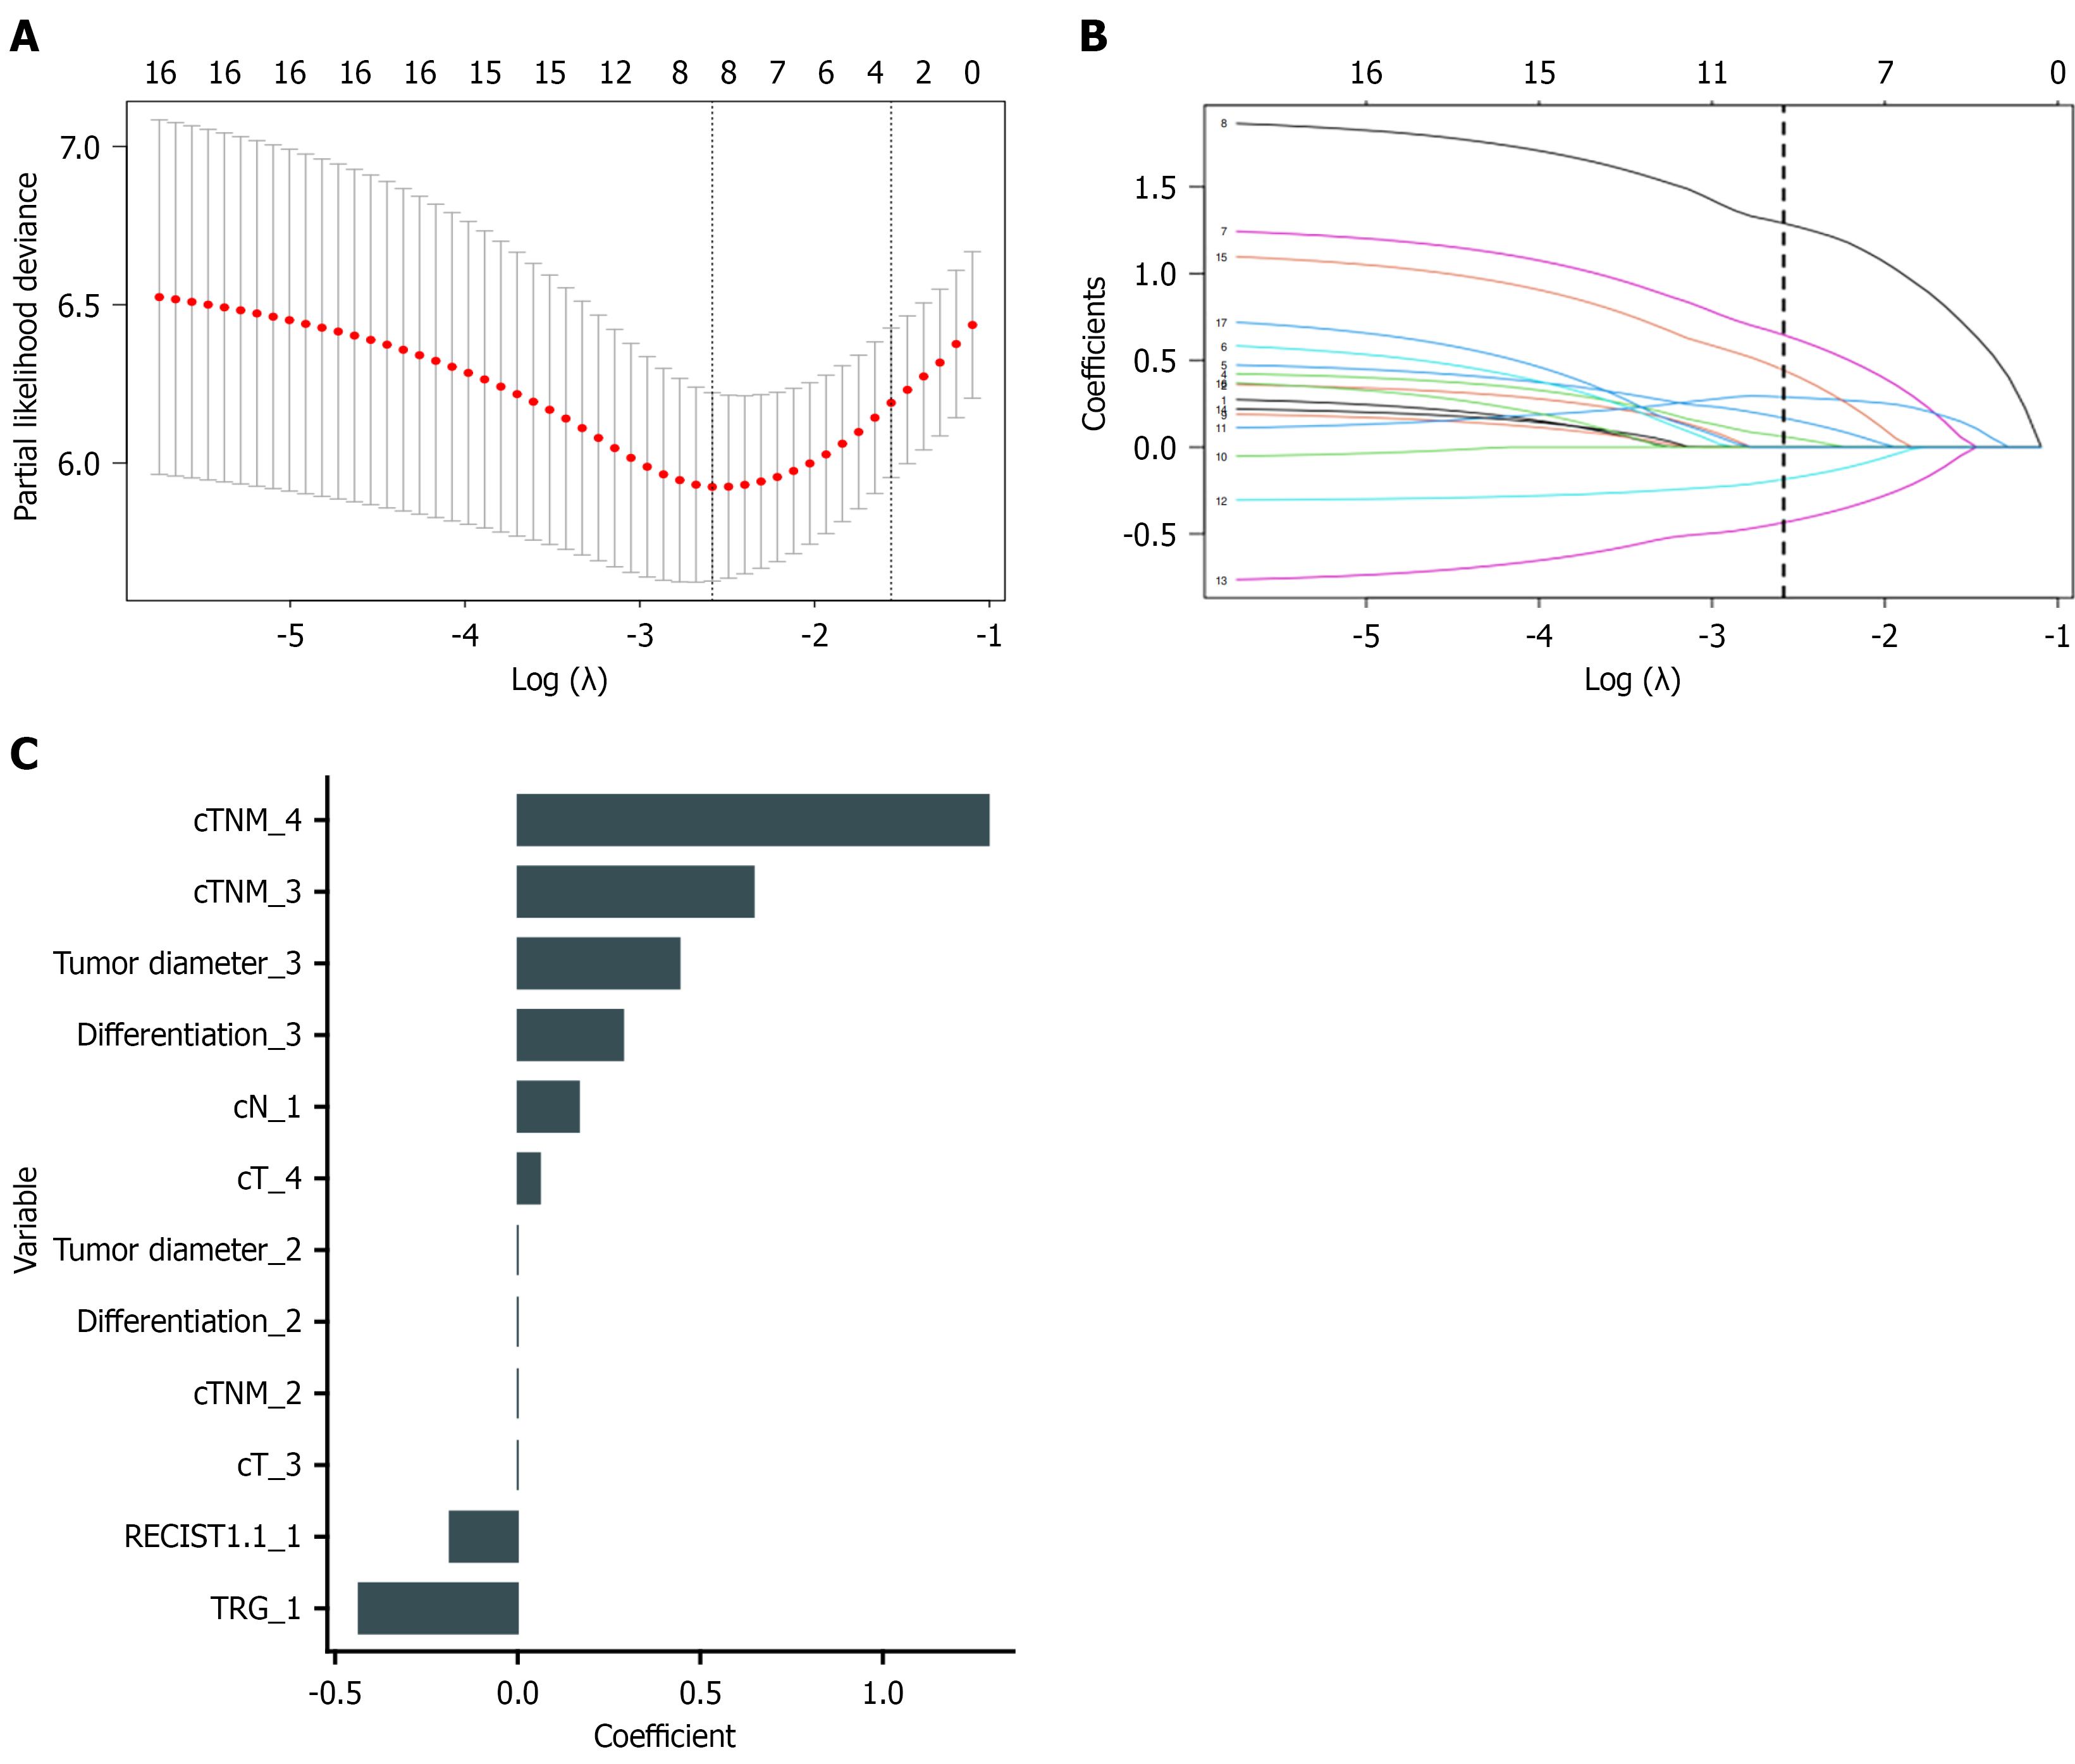
Figure 2 Least absolute shrinkage and selection operator regression analysis.
A: Least absolute shrinkage and selection operator (LASSO) regression with 10-fold cross-validation for selection of the optimal penalty parameter; B: LASSO coefficient profiles of candidate variables as a function of log(λ); C: Coefficients of variables retained by the LASSO-Cox regression model. cTNM: Clinical tumor node metastasis; RECIST: Response evaluation criteria in solid tumors; TRG: Tumor regression grade.
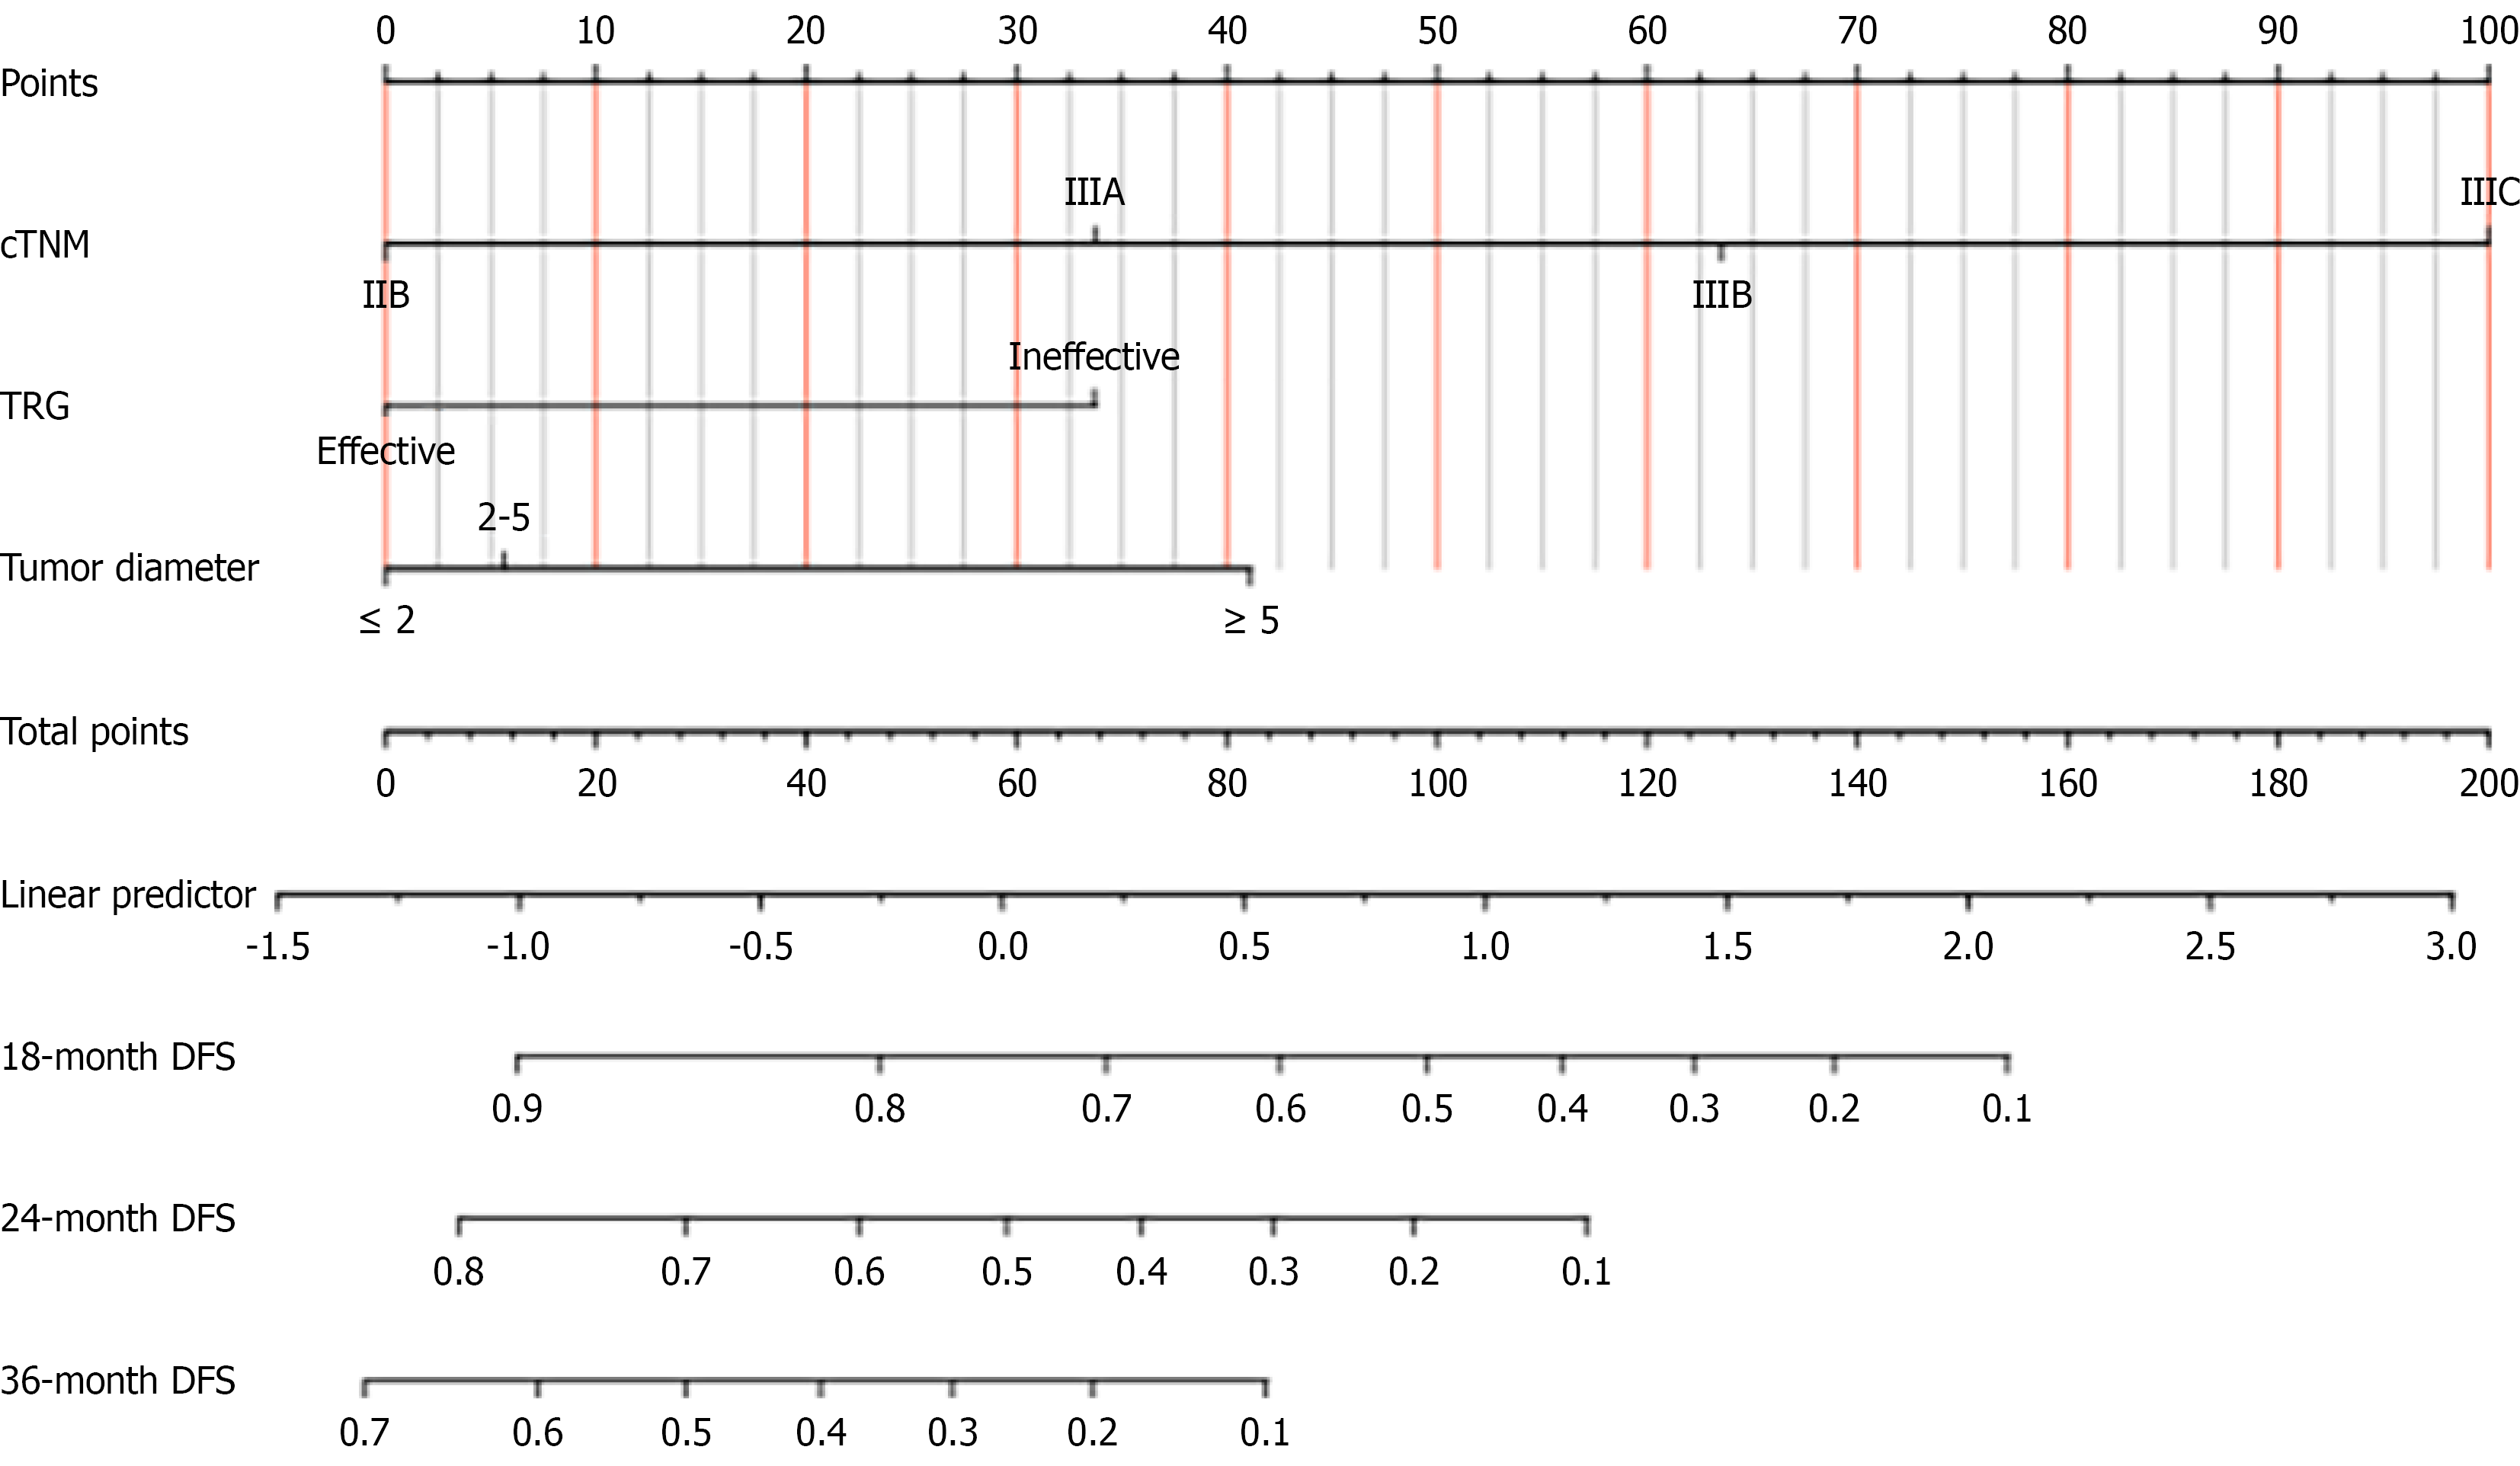
Figure 3 Disease-free survival nomogram.
cTNM: Clinical tumor node metastasis; DFS: Disease-free survival; TRG: Tumor regression grade.
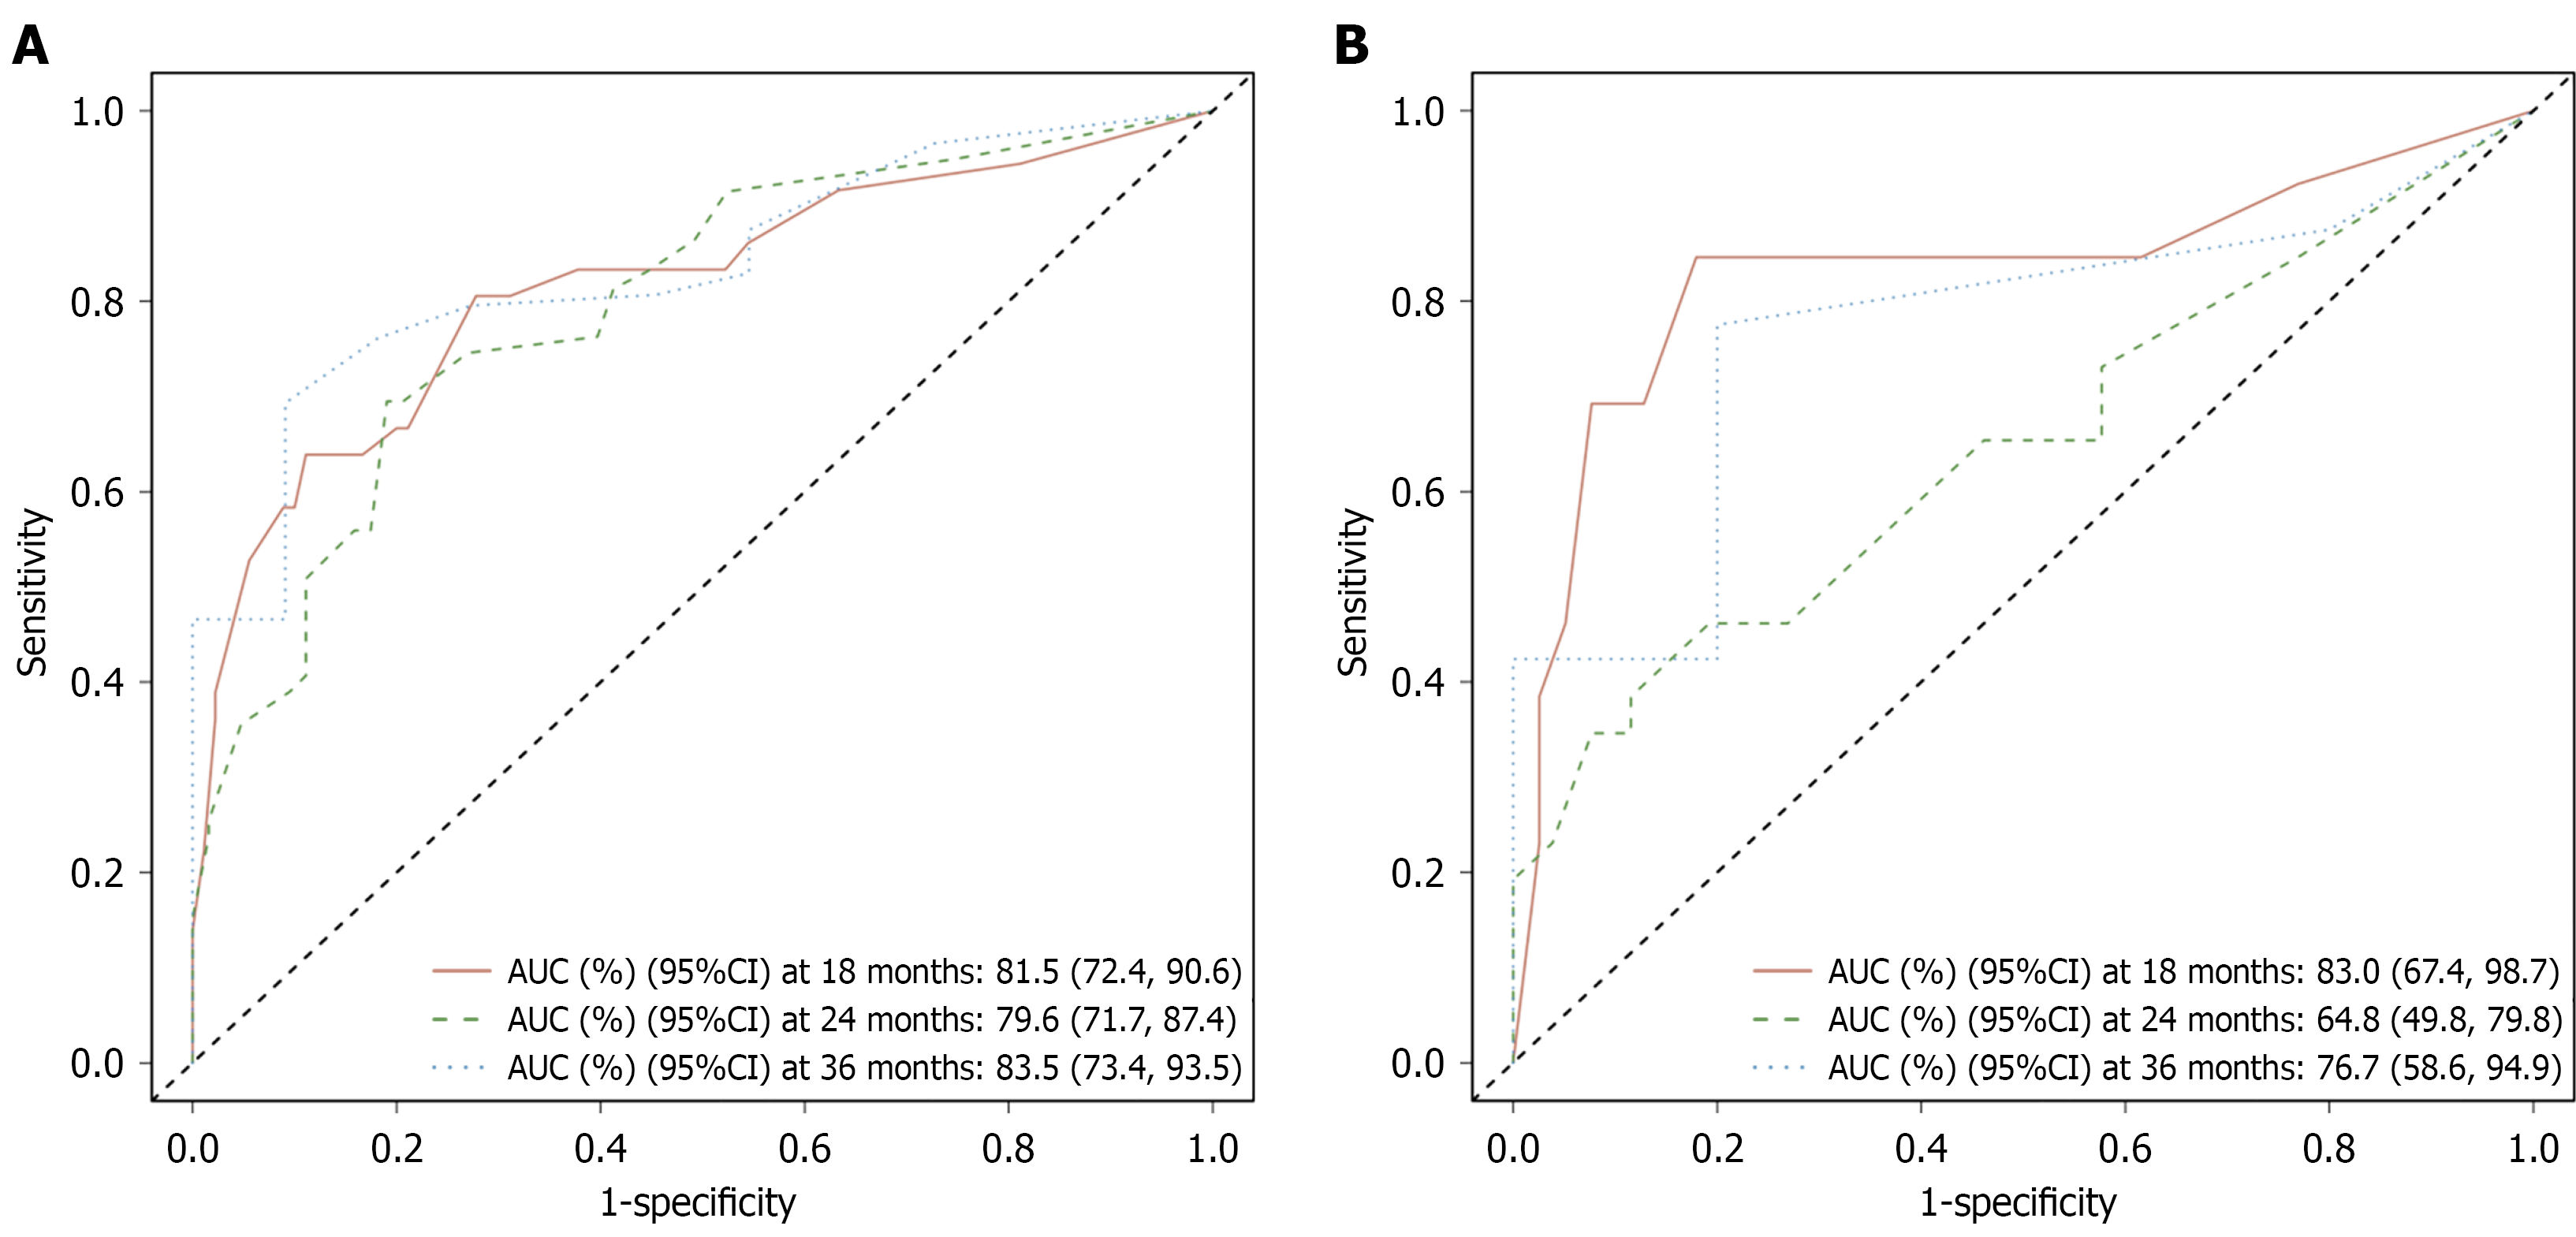
Figure 4 Disease-free survival receiver operating characteristic curve.
A: 18 months, 24 months, 36 months training set; B: 18 months, 24 months, 36 months validation set. AUC: Area under the curve; CI: Confidence interval.
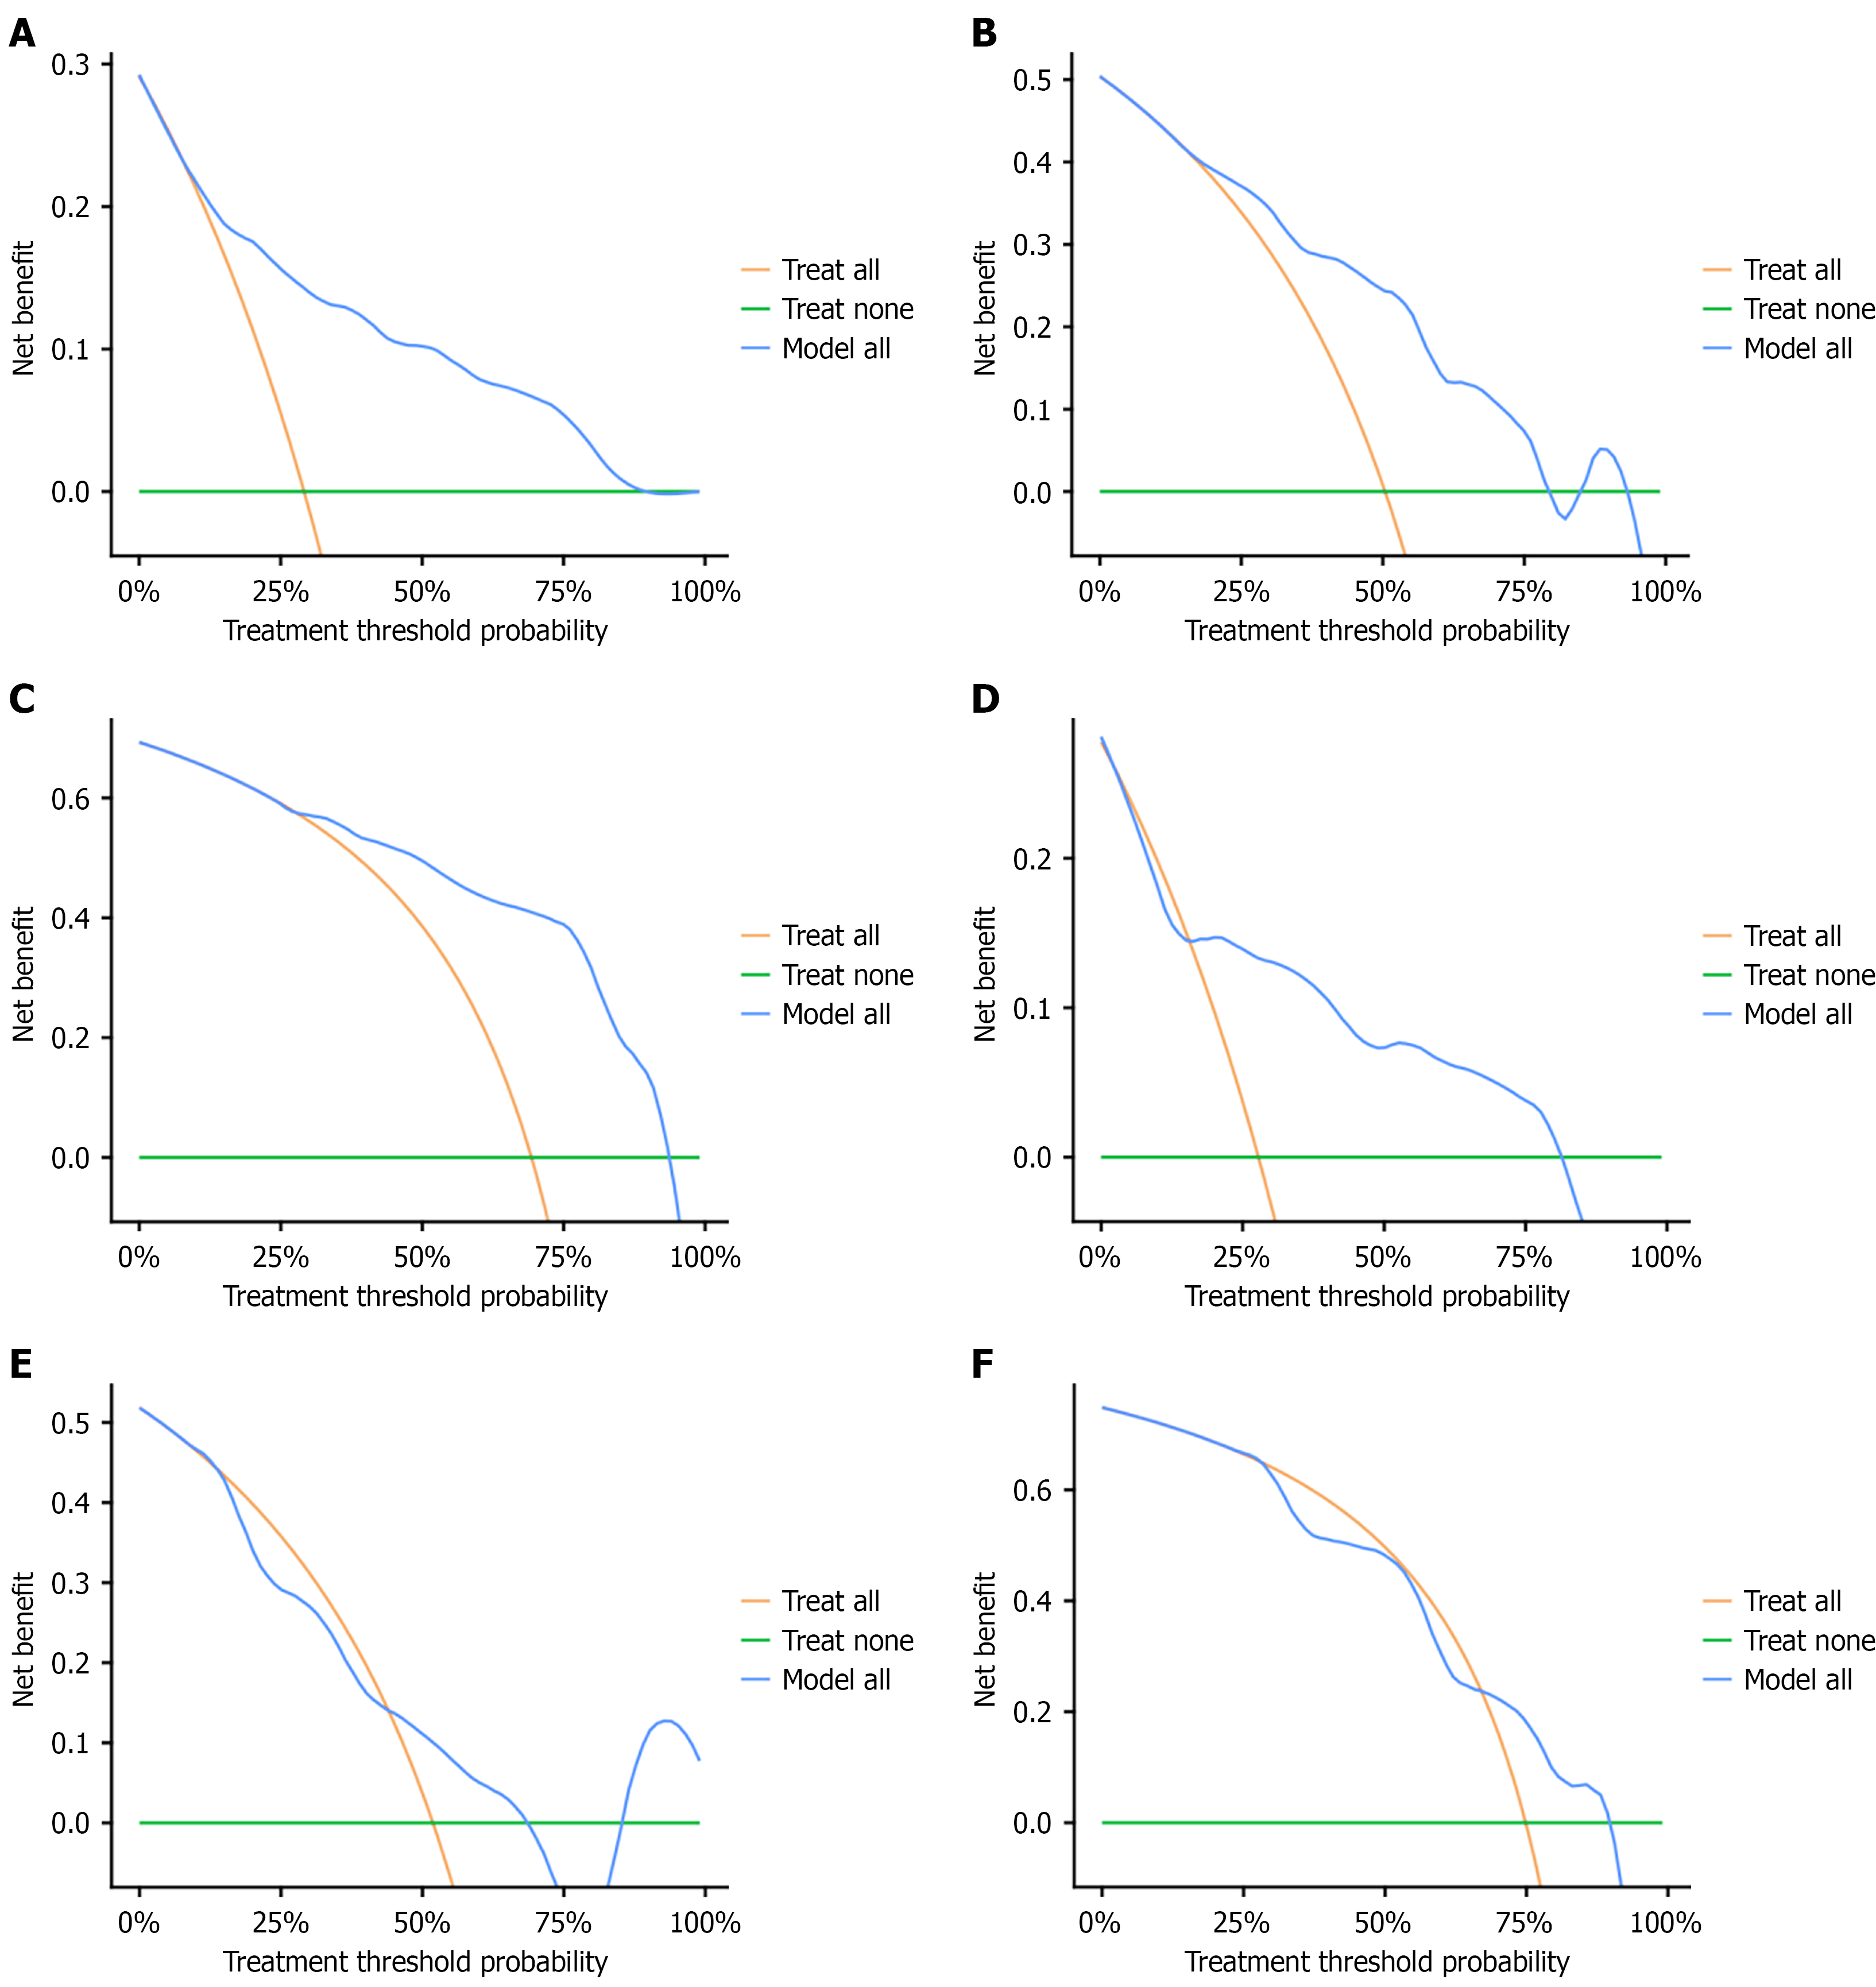
Figure 5 Decision curve analysis of the nomogram for predicting disease-free survival.
A: 18-month training set; B: 24-month training set; C: 36-month training set; D: 18-month validation set; E: 24-month validation set; F: 36-month validation set.
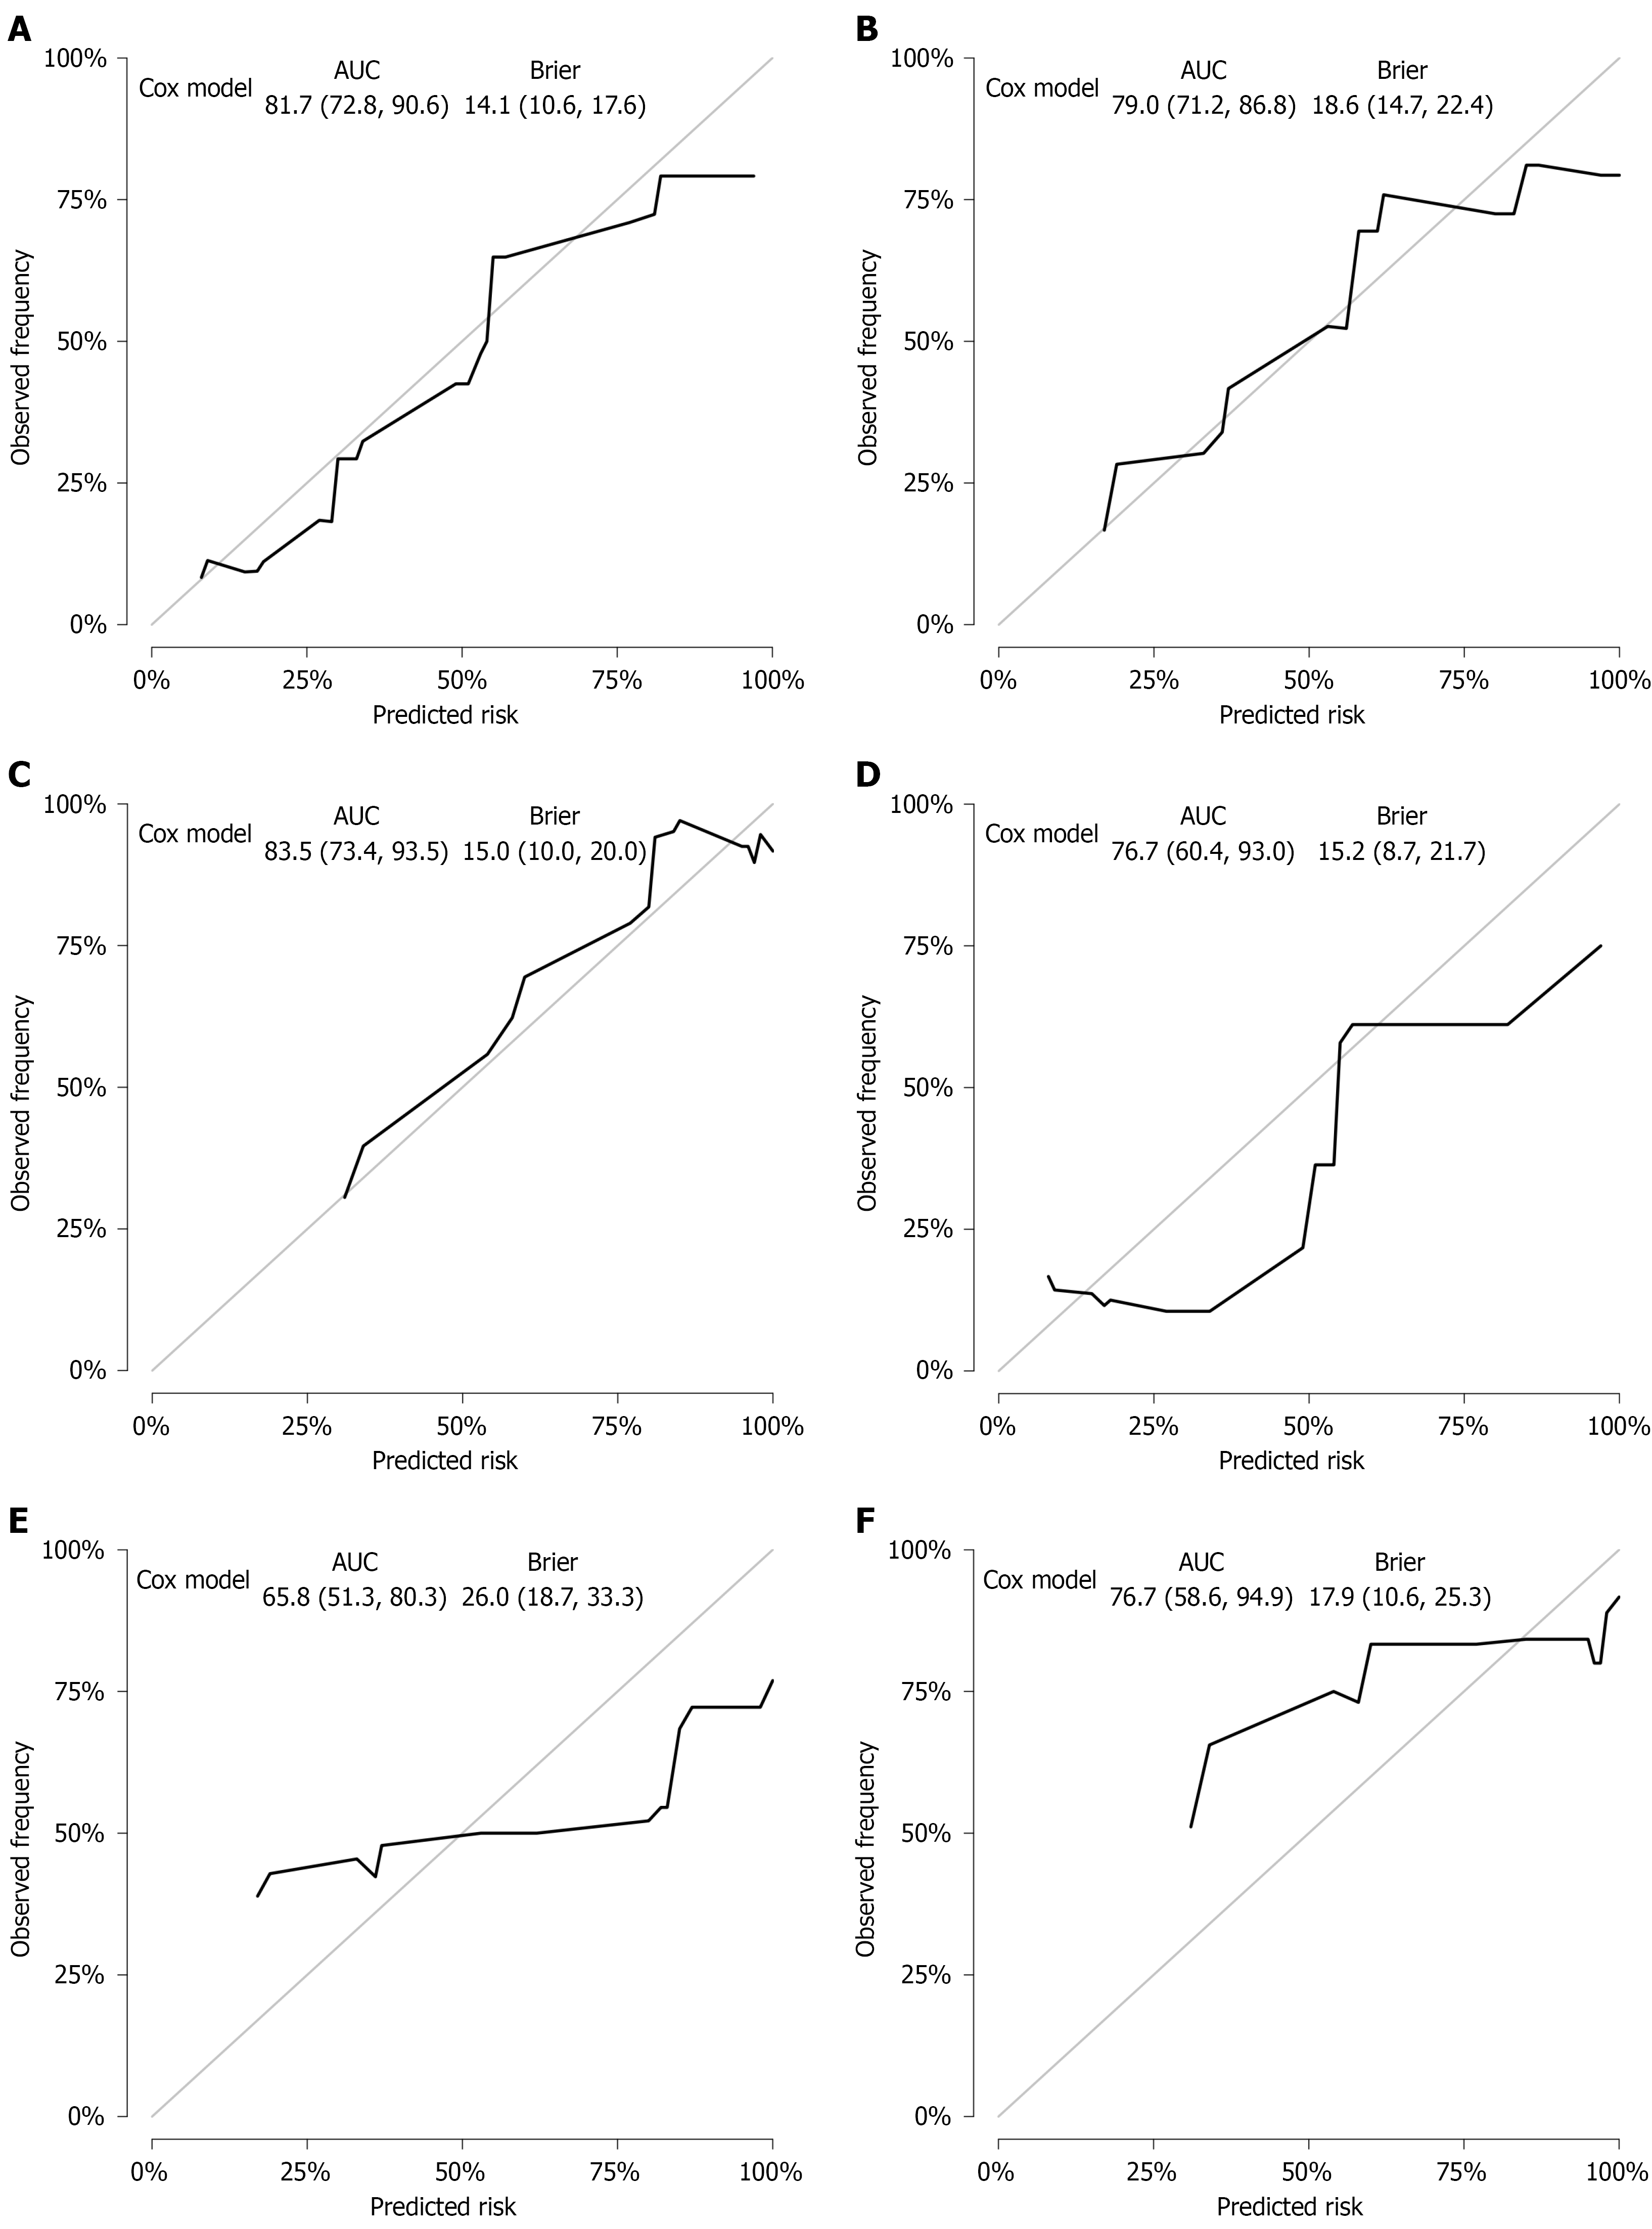
Figure 6 Calibration curves of the nomogram for predicting disease-free survival.
A: 18-month training set; B: 24-month training set; C: 36-month training set; D: 18-month validation set; E: 24-month validation set; F: 36-month validation set. AUC: Area under the curve.
- Citation: Ji BY, Qi LL, Fan DY, Zhang Y, He L, Zhang K, Liu ZB. Nab-paclitaxel-oxaliplatin-S-1 vs FOLFOX in locally advanced gastric cancer: Efficacy and postoperative disease-free survival prediction. World J Gastrointest Oncol 2026; 18(11): 123857
- URL: https://www.wjgnet.com/1948-5204/full/v18/i11/123857.htm
- DOI: https://dx.doi.org/10.4251/wjgo.123857