
















Copyright: ©Author(s) 2026.
World J Gastrointest Oncol. Nov 15, 2026; 18(11): 123688
Published online Nov 15, 2026. doi: 10.4251/wjgo.123688
Published online Nov 15, 2026. doi: 10.4251/wjgo.123688
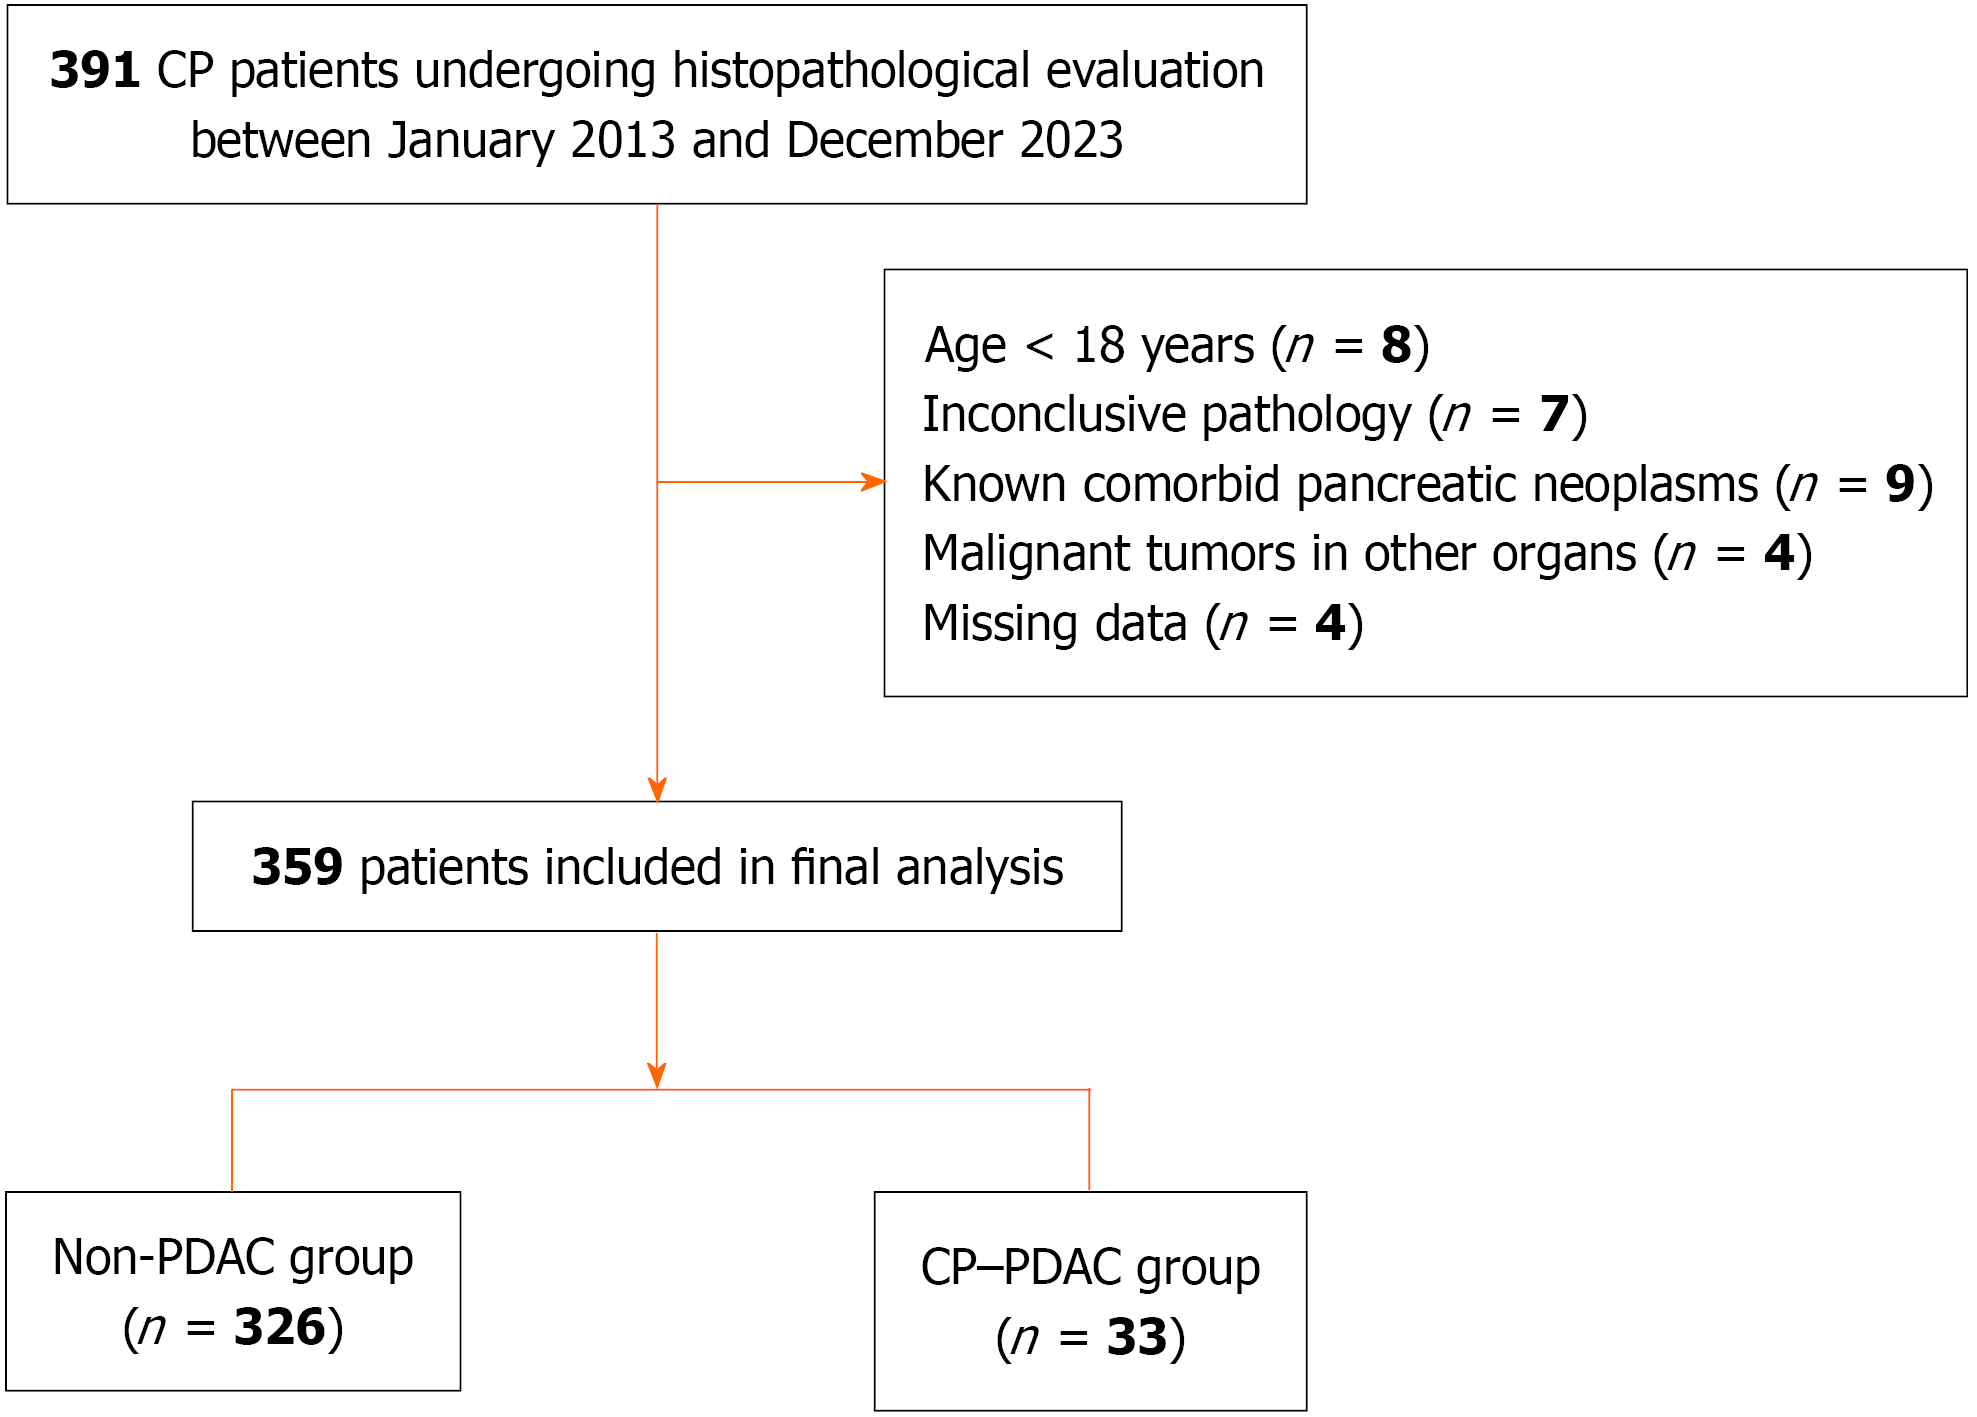
Figure 1 Flow diagram of patient selection and study cohort classification.
CP: Chronic pancreatitis; PDAC: Pancreatic ductal adenocarcinoma.
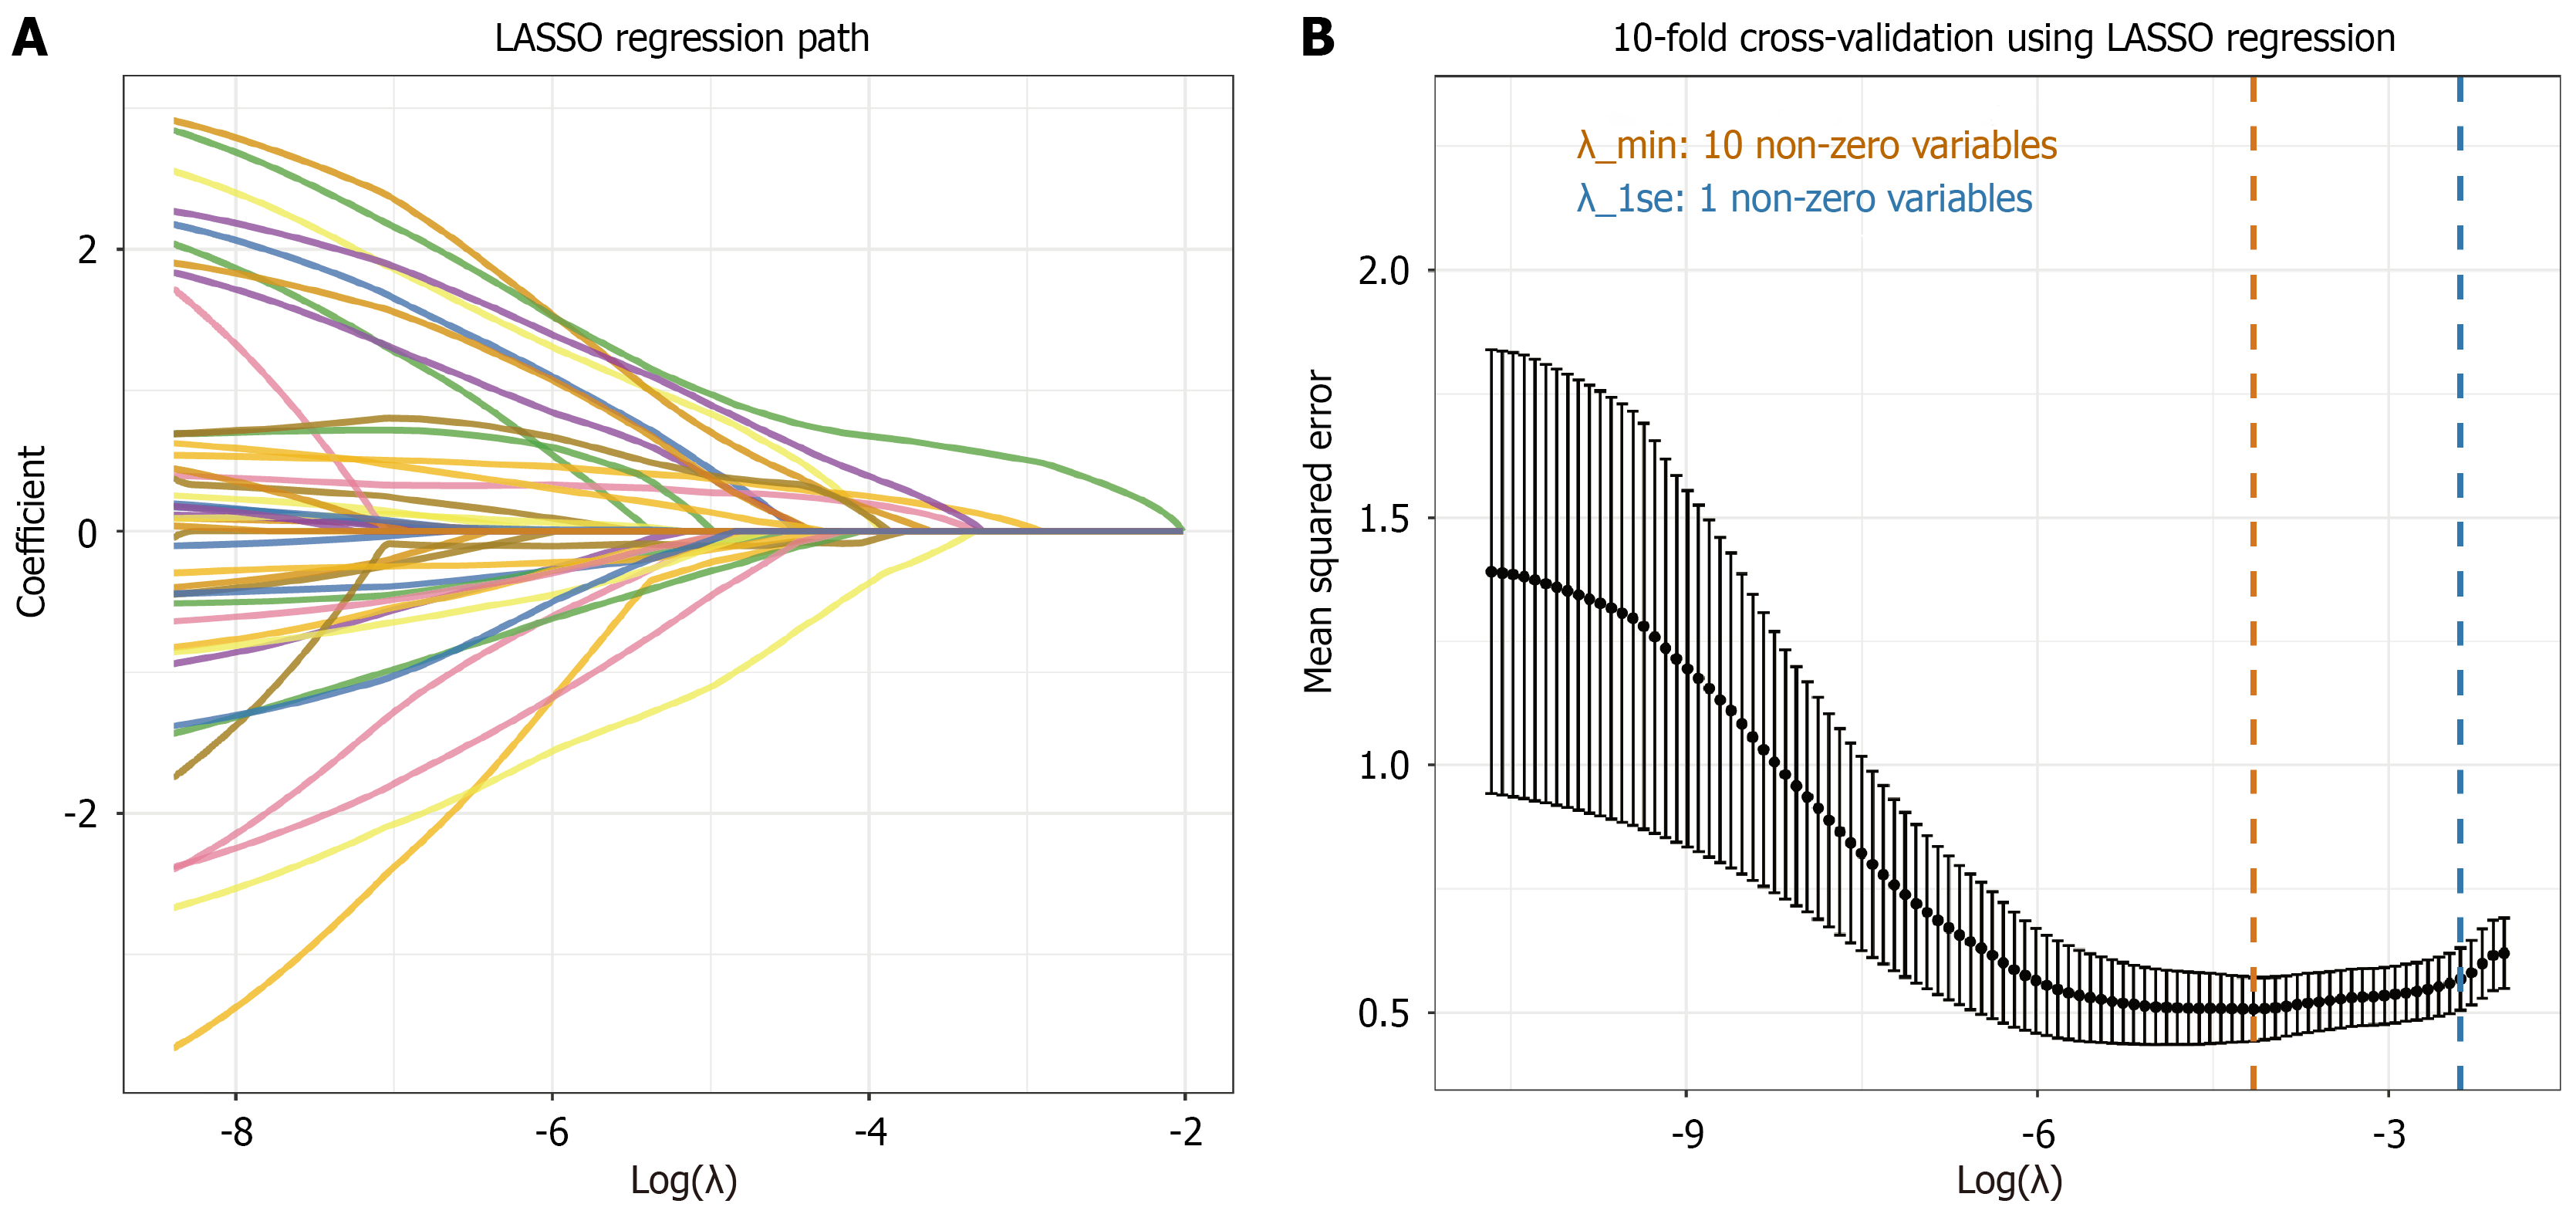
Figure 2 Least absolute shrinkage and selection operator regression analysis for variable selection.
A: Least absolute shrinkage and selection operator coefficient profiles of candidate variables plotted against log(λ); B: Ten-fold cross-validation plot for selection of the optimal regularization parameter (λ). The vertical dashed lines indicate λ_min and λ_1se, corresponding to the minimum cross-validation error and the value within one standard error of the minimum, respectively. LASSO: Least absolute shrinkage and selection operator.
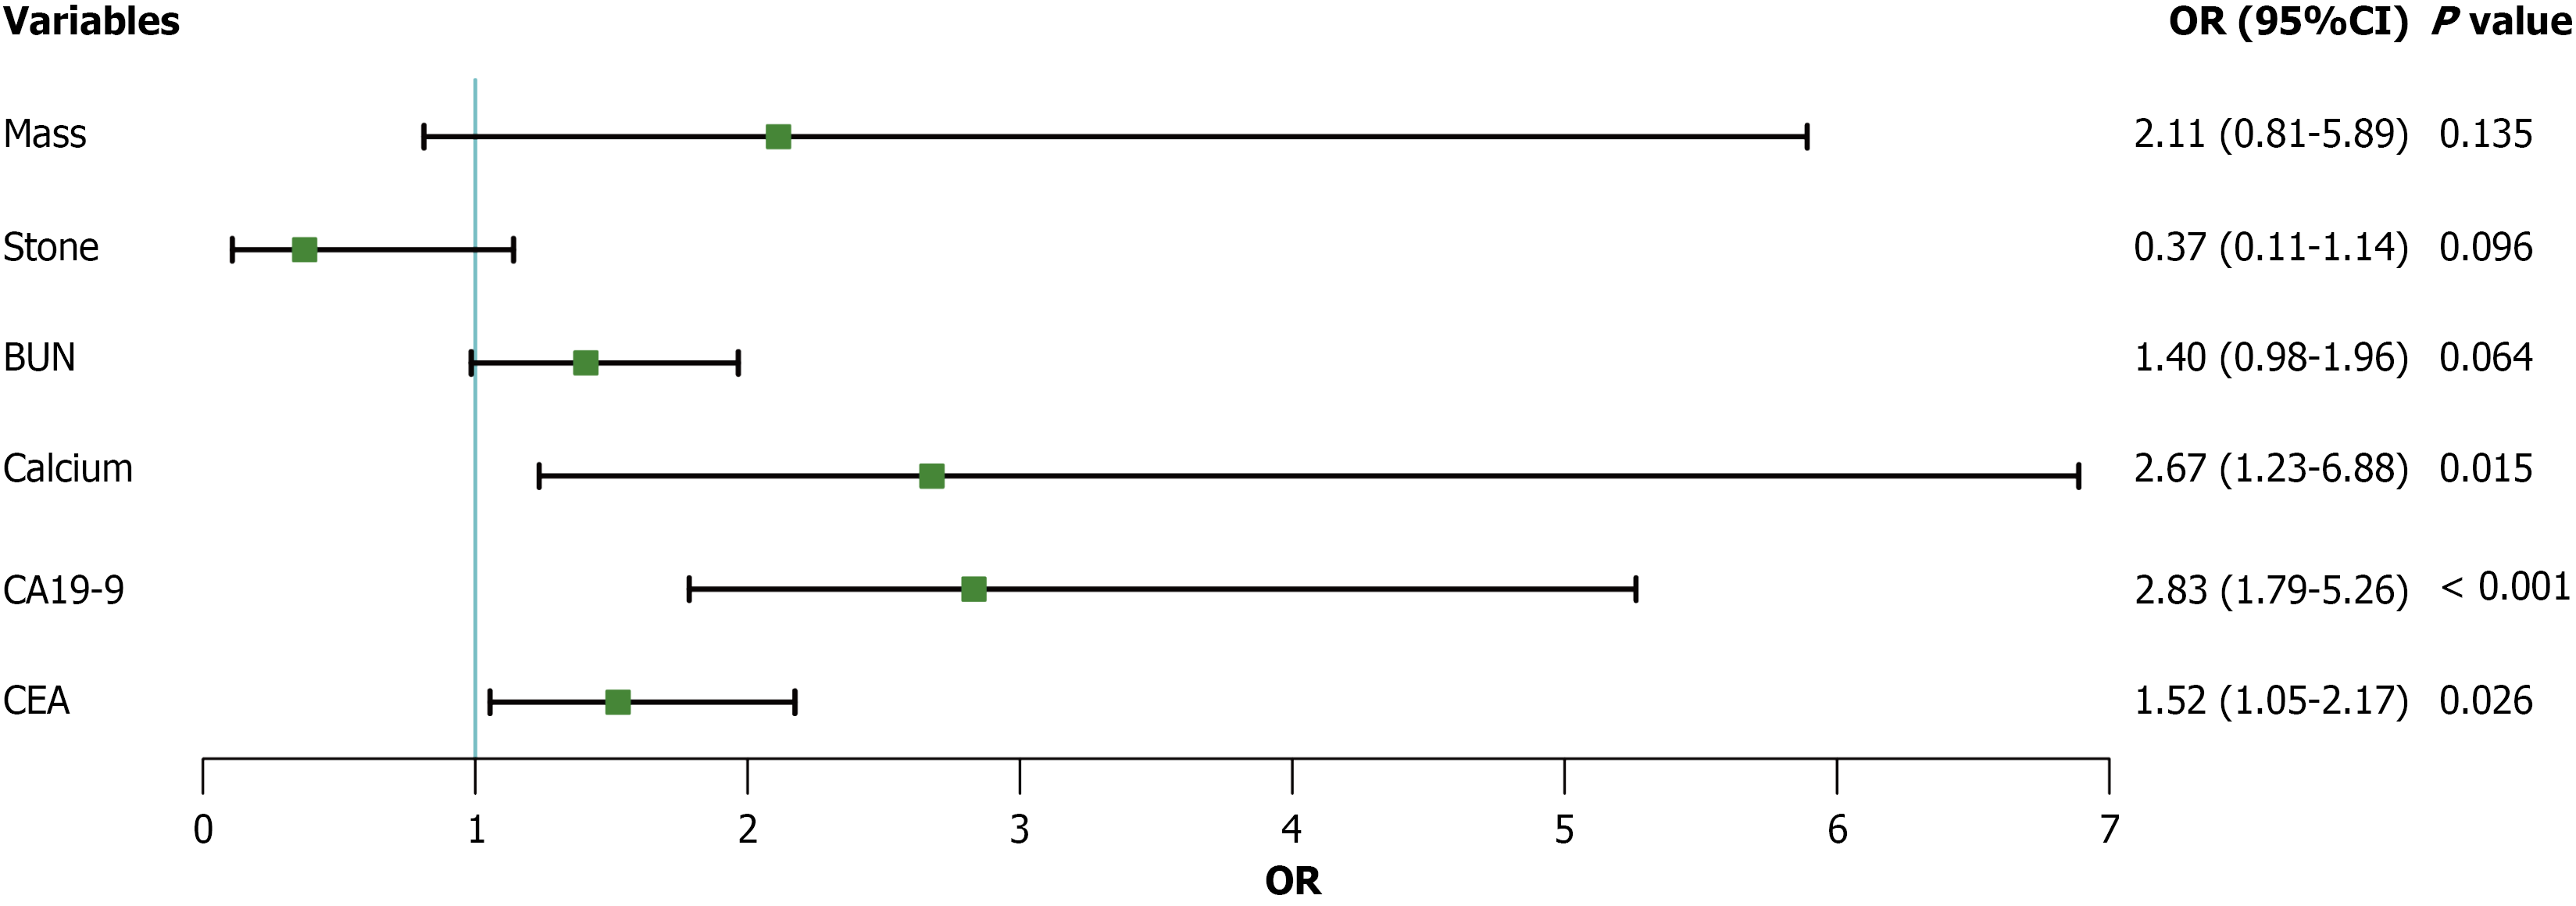
Figure 3 Forest plot of multivariate logistic regression analysis for early detection of pancreatic cancer ductal adenocarcinoma in patients with chronic pancreatitis.
BUN: Blood urea nitrogen; CA19-9: Carbohydrate antigen 19-9; CEA: Carcinoembryonic antigen; 95%CI: 95% confidence interval; OR: Odds ratio.
- Citation: Wei WZ, Wei KY, He HR, Leng HZ, Yang X, Han L, Jiang YN, Xue J, Wang Z, Duan WX. Occult pancreatic ductal adenocarcinoma in patients undergoing invasive evaluation for chronic pancreatitis: A retrospective study. World J Gastrointest Oncol 2026; 18(11): 123688
- URL: https://www.wjgnet.com/1948-5204/full/v18/i11/123688.htm
- DOI: https://dx.doi.org/10.4251/wjgo.123688