
















Copyright: ©Author(s) 2026.
World J Gastrointest Oncol. Nov 15, 2026; 18(11): 122992
Published online Nov 15, 2026. doi: 10.4251/wjgo.122992
Published online Nov 15, 2026. doi: 10.4251/wjgo.122992
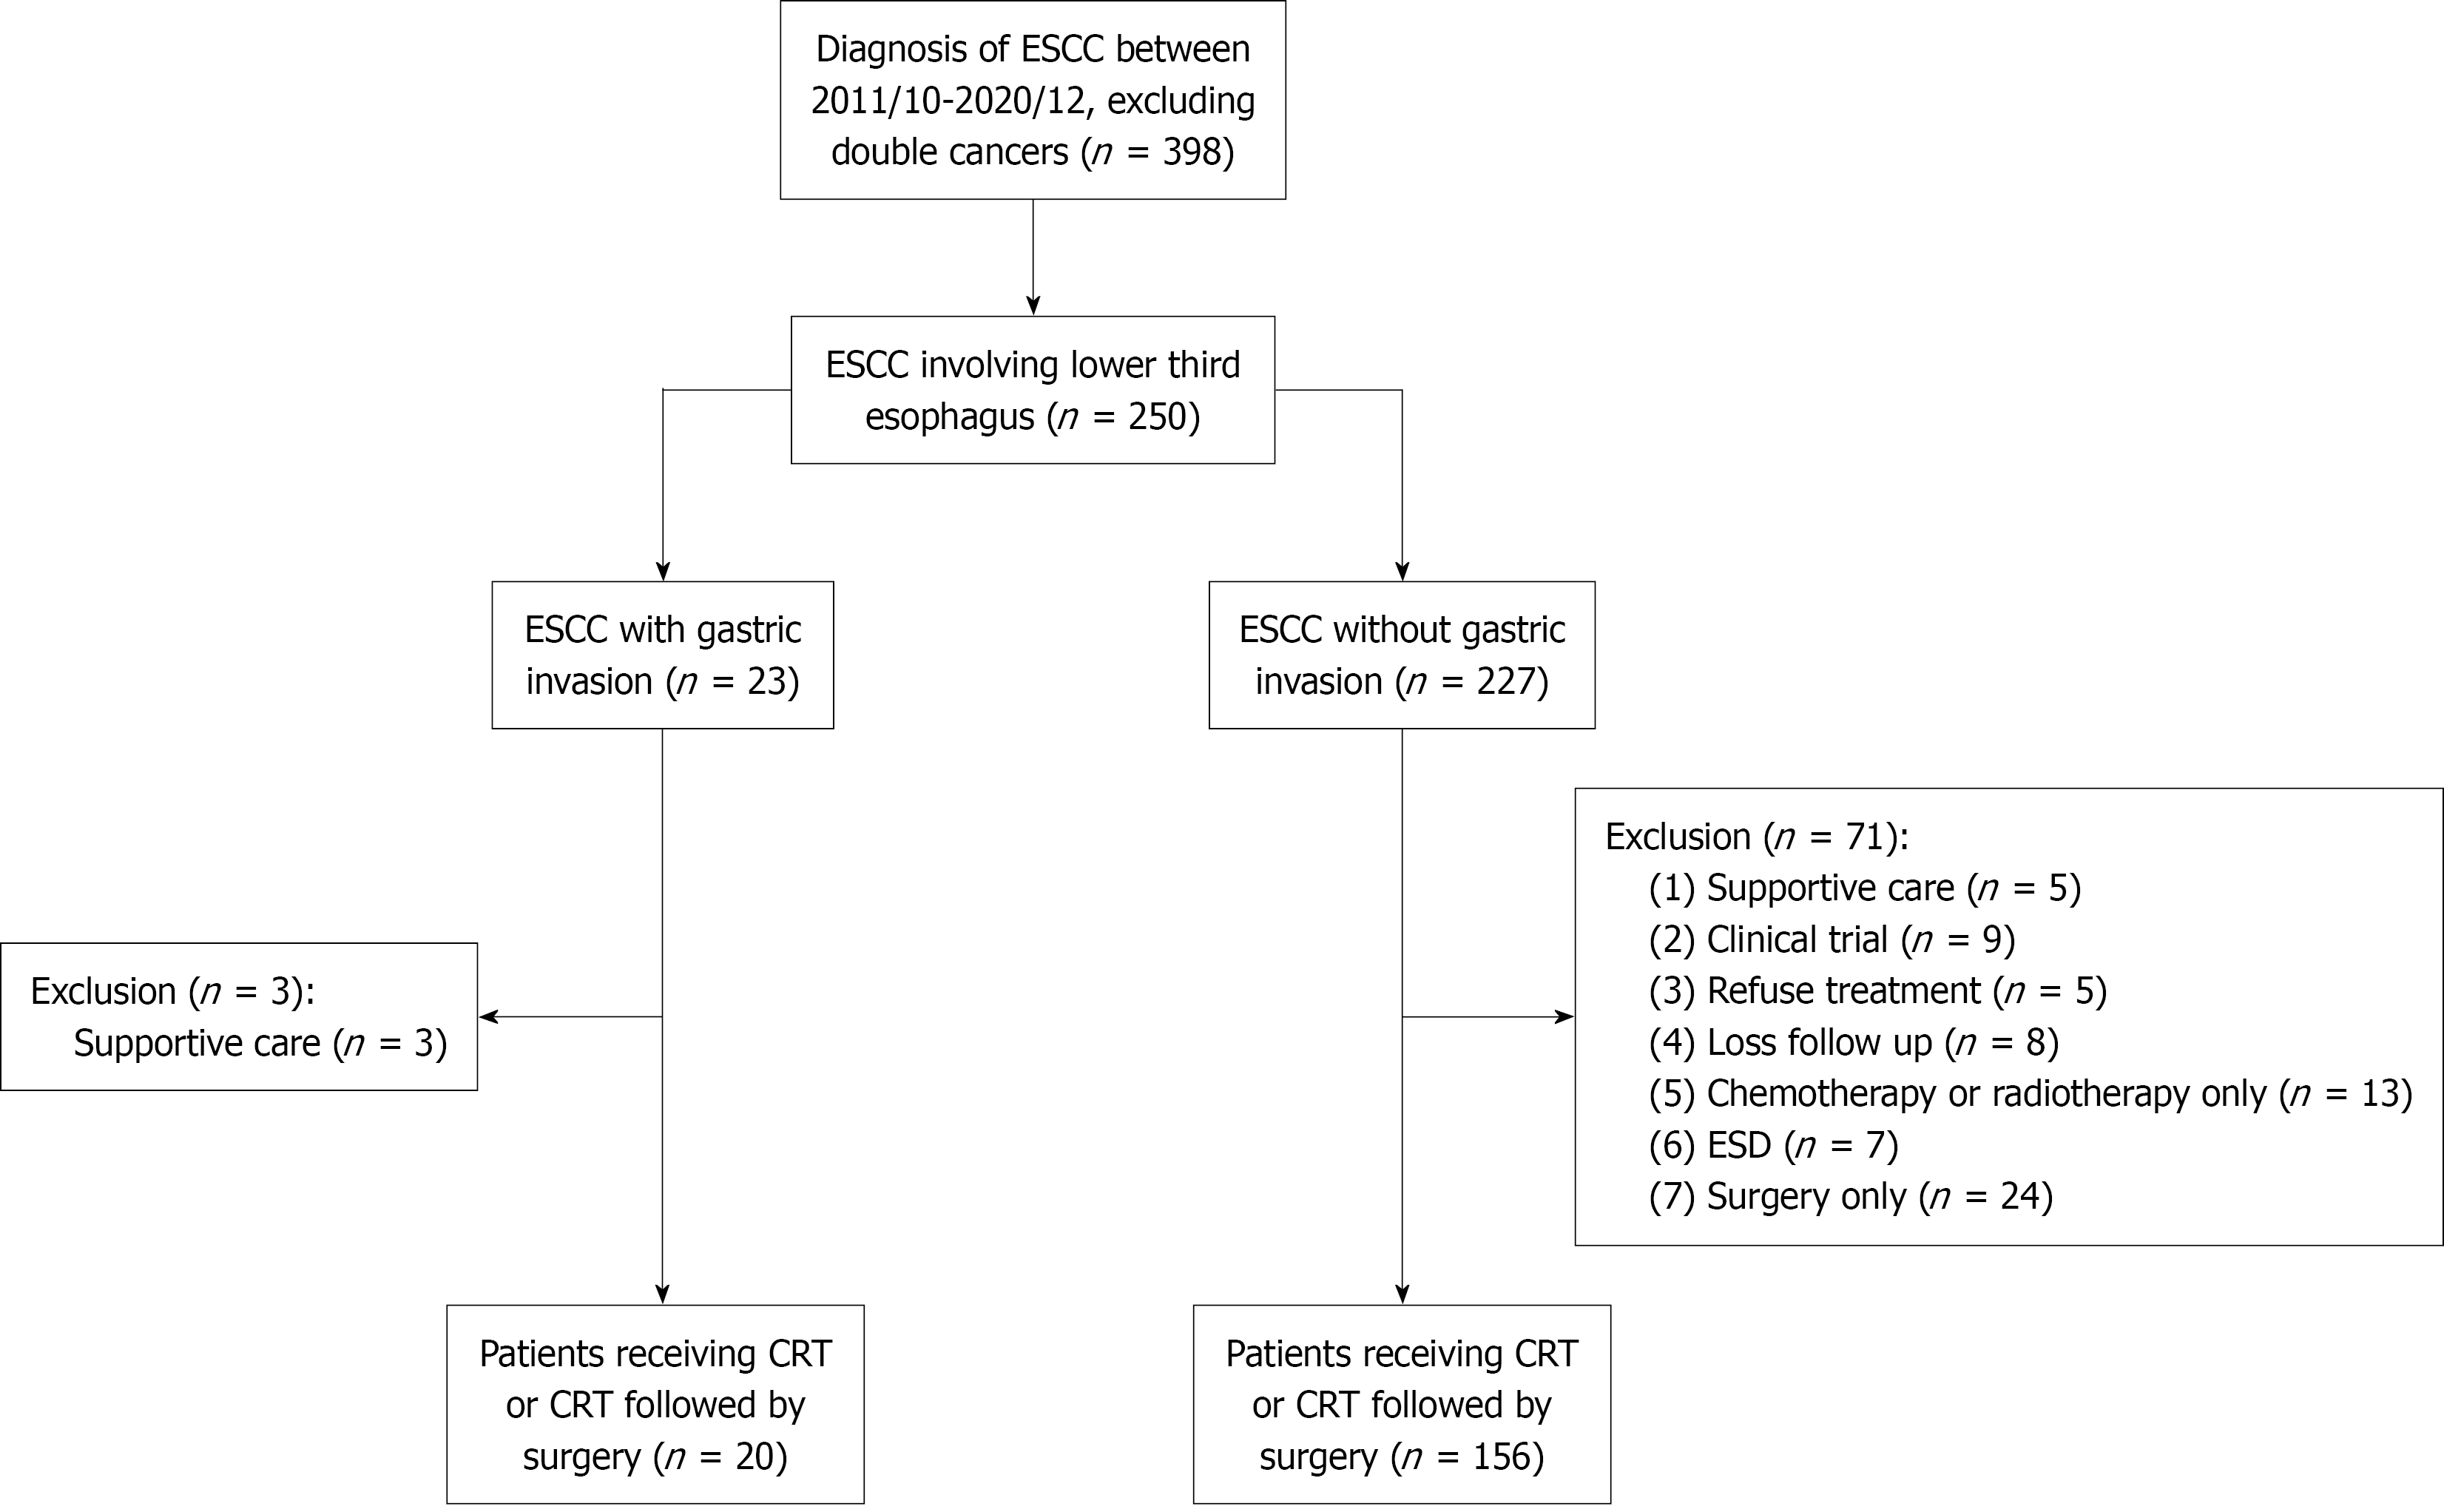
Figure 1 Study flow chart.
CRT: Chemoradiotherapy; ESCC: Esophageal squamous cell carcinoma; ESD: Endoscopic submucosal dissection.
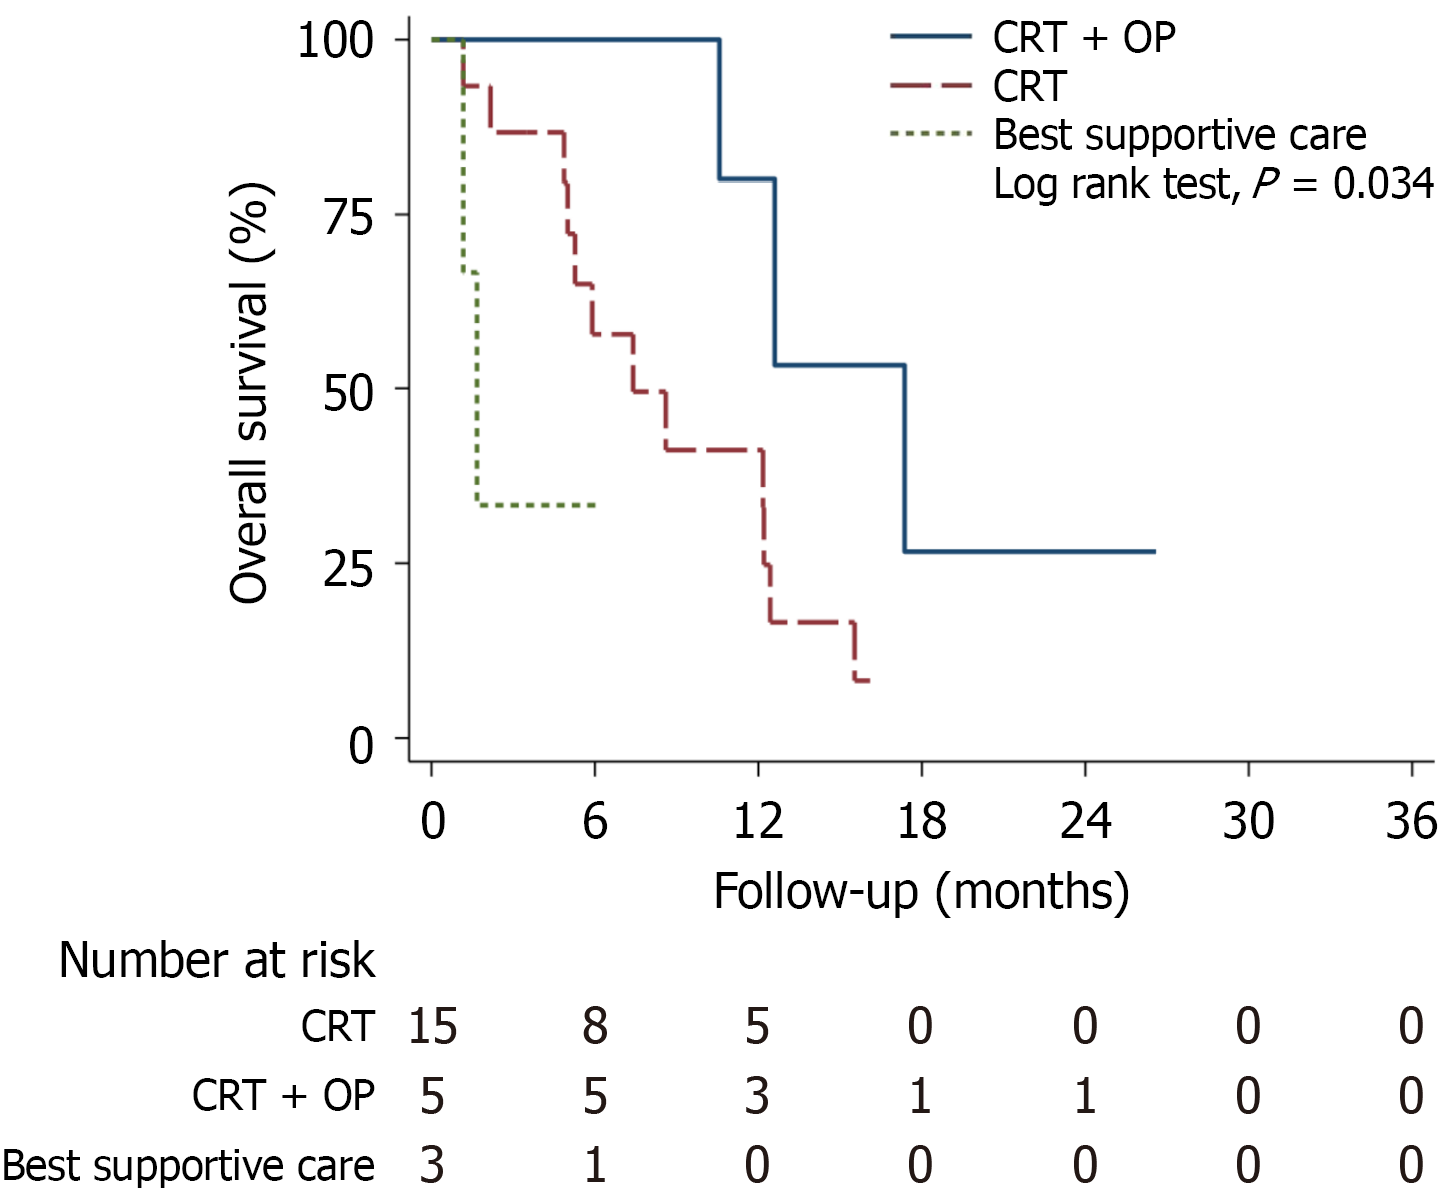
Figure 2 Kaplan-Meier survival curves for overall survival according to treatment modality among 23 patients with esophageal squamous cell carcinoma and direct gastric invasion.
CRT: Chemoradiotherapy; CRT + OP: Chemoradiotherapy followed by surgery.
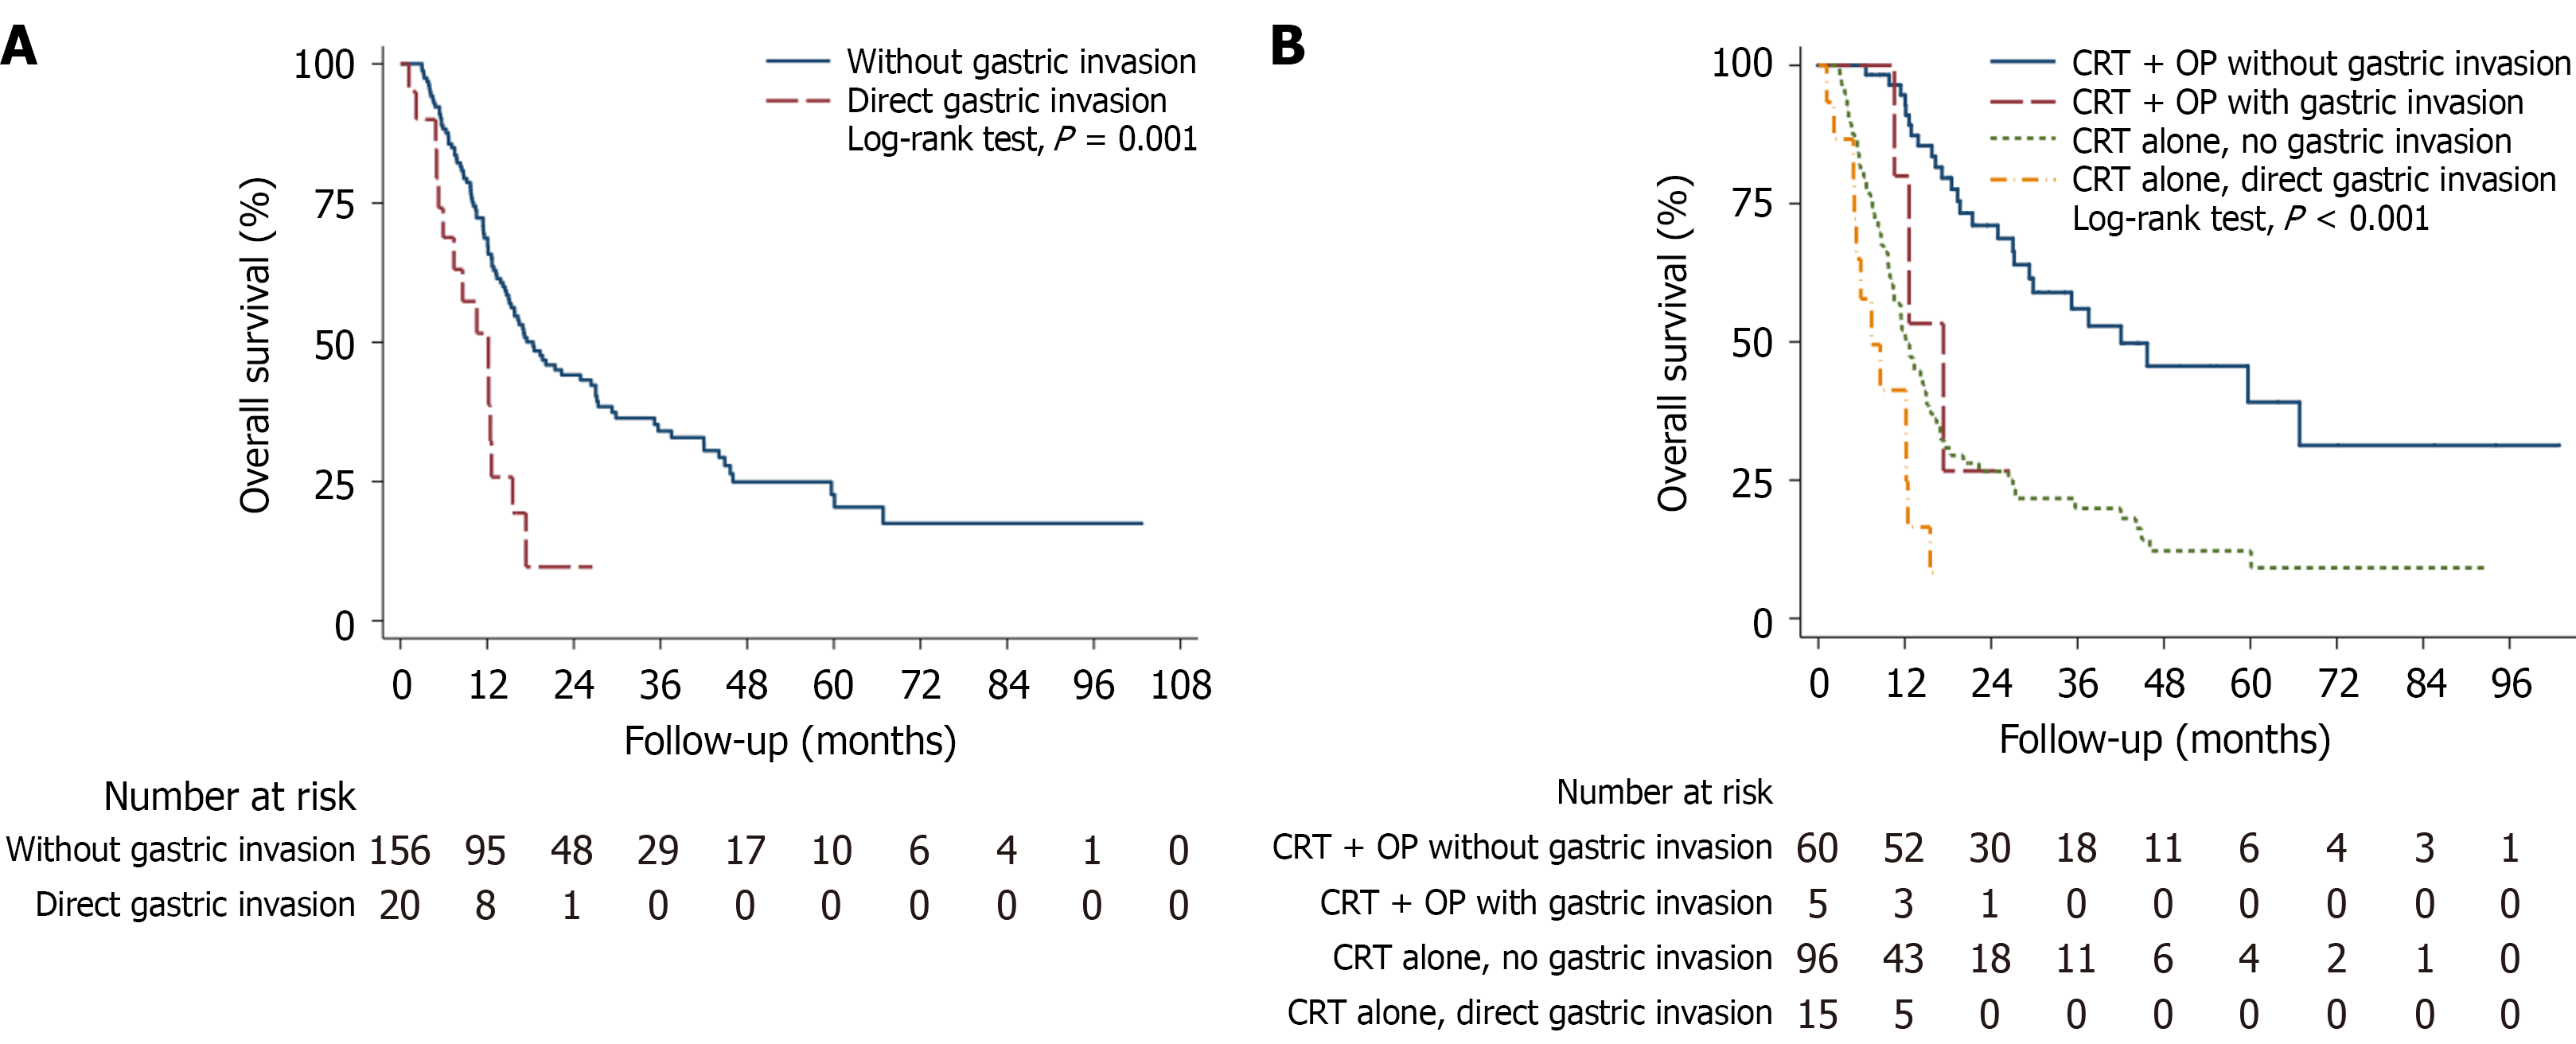
Figure 3 Kaplan-Meier curves for overall survival among 176 patients with esophageal squamous cell carcinoma involving the lower third of the esophagus who received chemoradiotherapy alone or chemoradiotherapy followed by surgery.
A: Overall survival according to the presence or absence of gastric invasion; B: Overall survival according to gastric invasion status and treatment modality. CRT: Chemoradiotherapy; CRT + OP: Chemoradiotherapy followed by surgery.
- Citation: Wang YK, Shen CS, Yu FJ, Chen YH, Chen WC, Lee JY, Wu MT, Wu IC. Direct gastric invasion is associated with poor prognosis in esophageal squamous cell carcinoma involving the lower-third esophagus. World J Gastrointest Oncol 2026; 18(11): 122992
- URL: https://www.wjgnet.com/1948-5204/full/v18/i11/122992.htm
- DOI: https://dx.doi.org/10.4251/wjgo.122992