
















Copyright: ©Author(s) 2026.
World J Gastrointest Oncol. Oct 15, 2026; 18(10): 122724
Published online Oct 15, 2026. doi: 10.4251/wjgo.122724
Published online Oct 15, 2026. doi: 10.4251/wjgo.122724
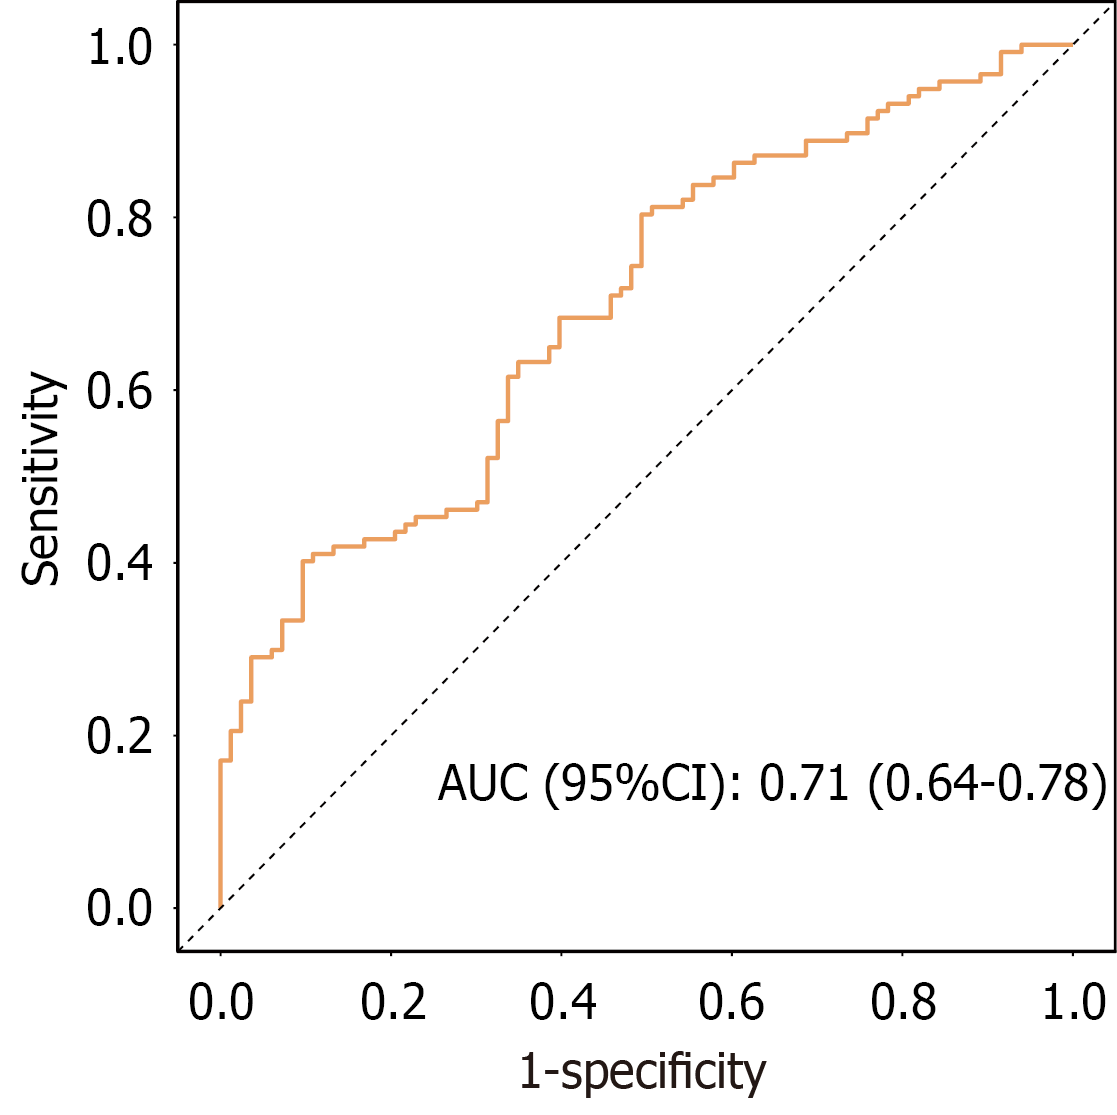
Figure 1 Receiver operating characteristic curve of predictive ability of prognostic immune-inflammatory-nutritional score.
AUC: Area under the curve.
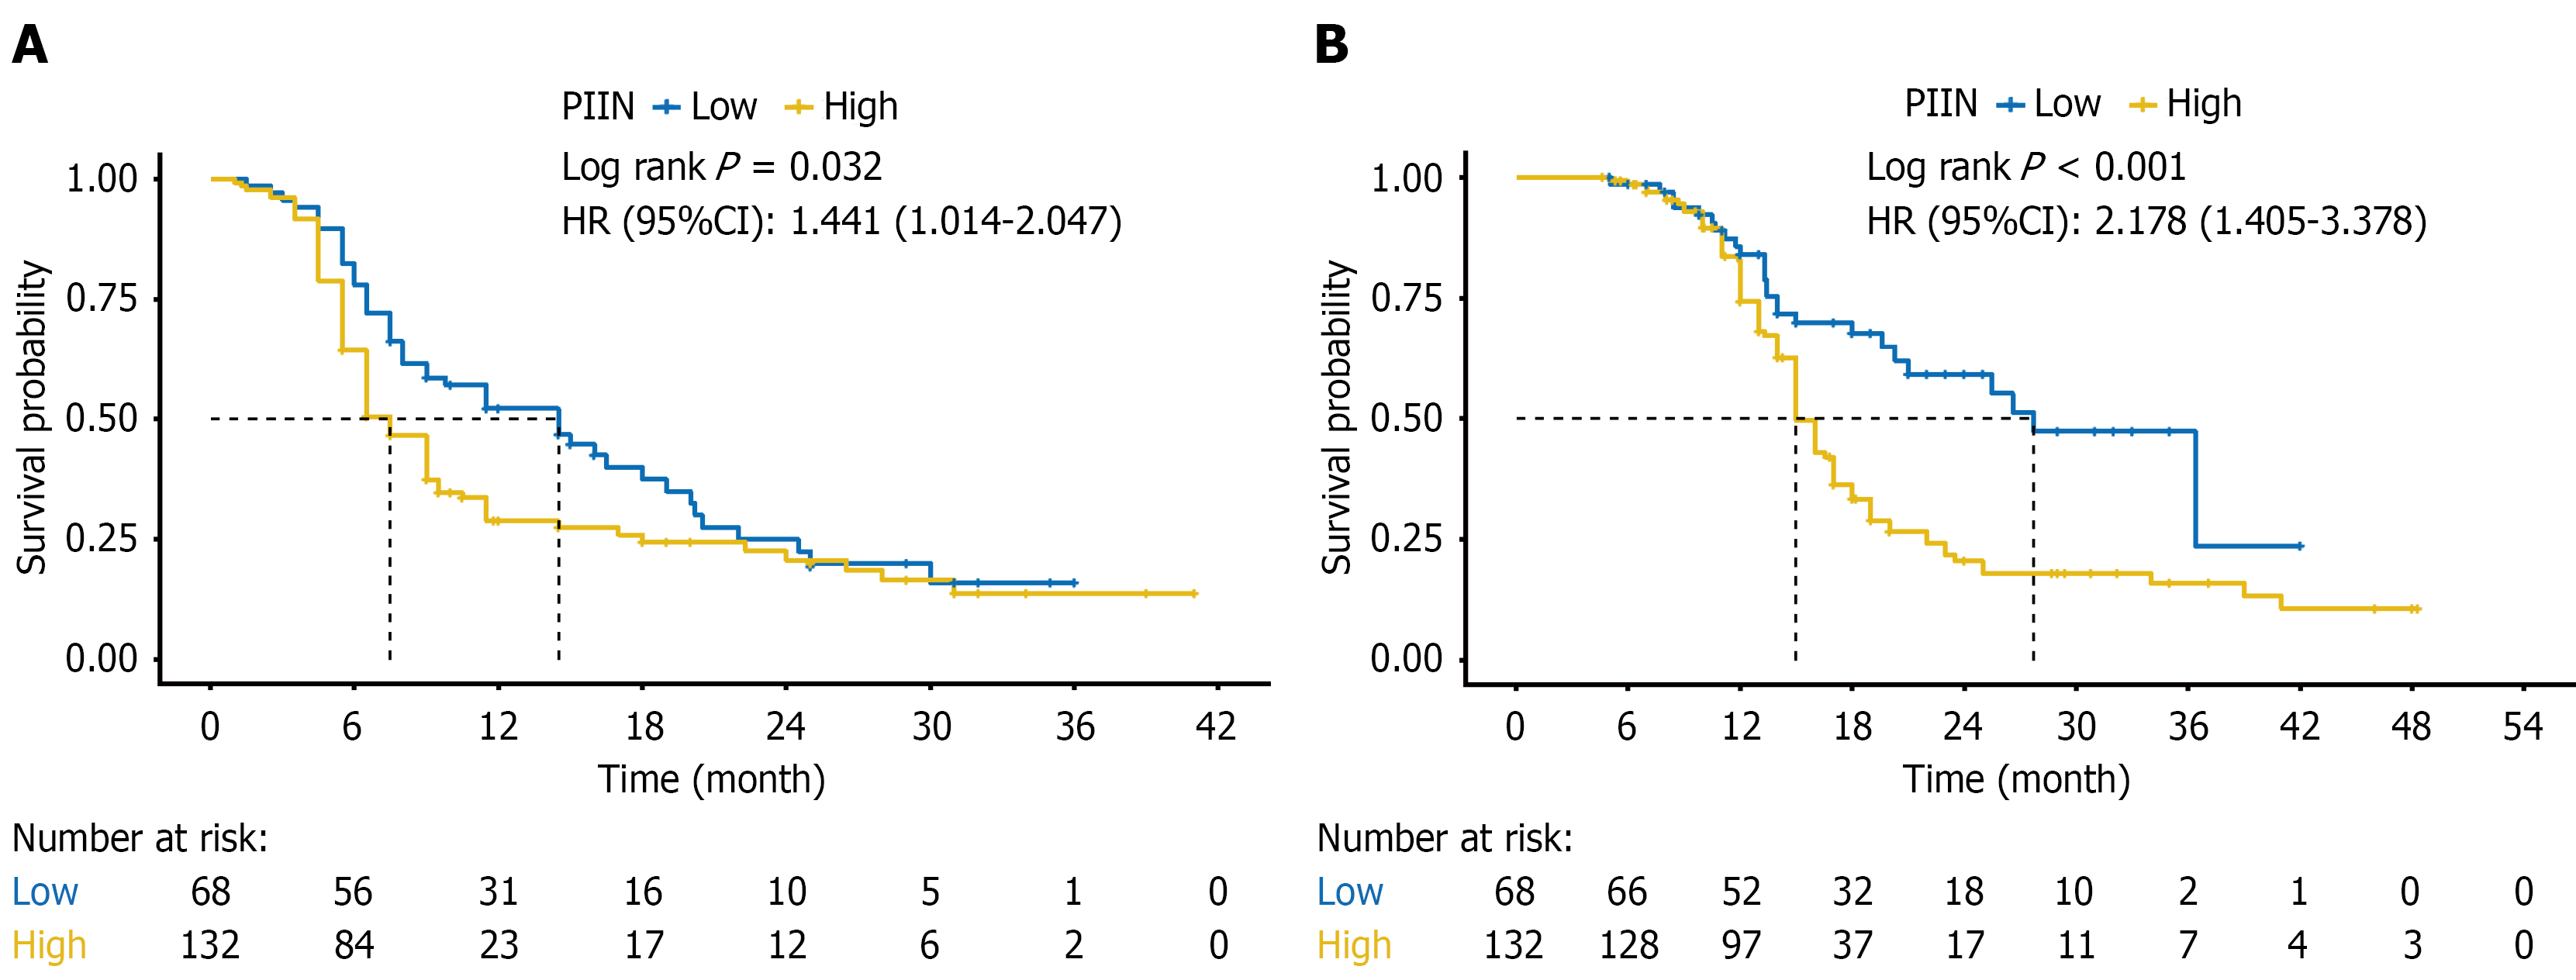
Figure 2 Effects of different prognostic immune-inflammatory-nutritional score on the long-term prognosis of advanced gastric cancer patients.
A: Kaplan-Meier plot of progression-free survival in the prognostic immune-inflammatory-nutritional (PIIN) score < 25.69 groups and PIIN score ≥ 25.69 groups; B: Kaplan-Meier plot of overall survival in PIIN score < 25.69 groups and PIIN score ≥ 25.69 groups. PIIN: Prognostic immune-inflammatory-nutritional; HR: Hazard ratio.
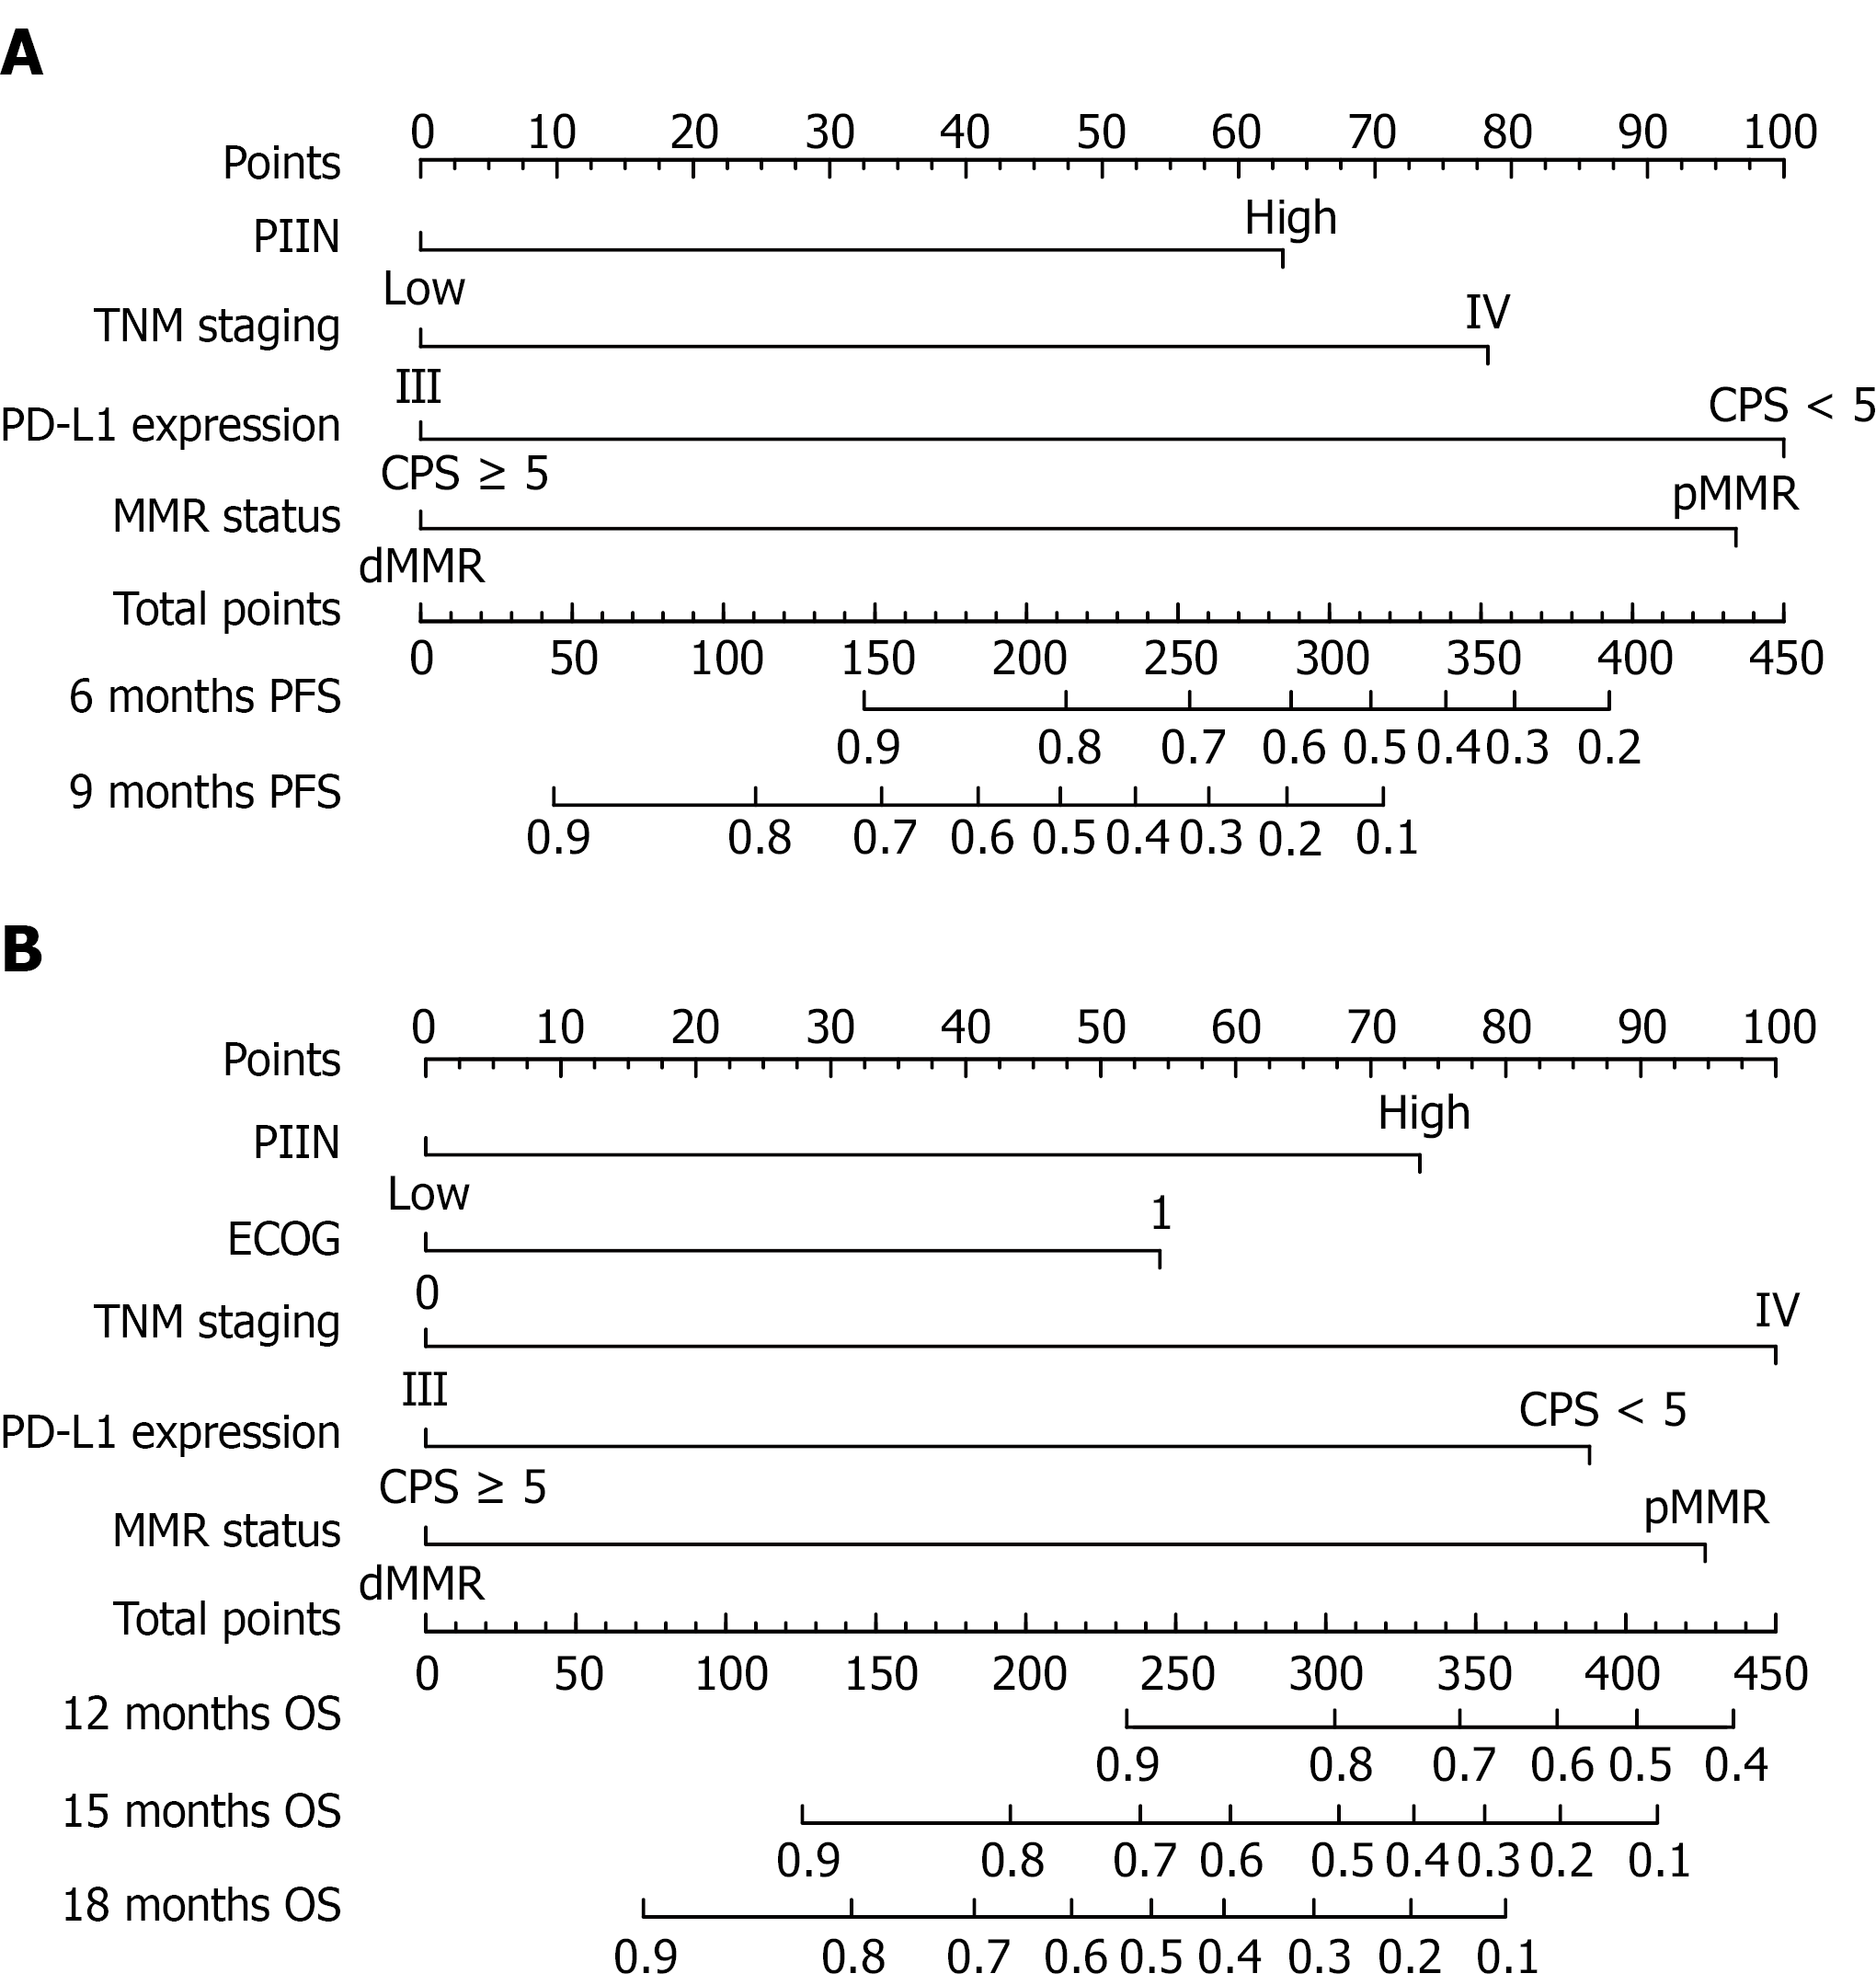
Figure 3 The prognostic model for predicting survival.
A: The prognostic model for predicting 6-month and 9-month progression-free survival; B: The prognostic model for predicting 12-month, 15-month, and 18-month overall survival. PD-L1: Programmed death-ligand 1; PIIN score: Prognostic immune-inflammatory-nutritional score; MMR: Mismatch repair; PFS: Progression-free survival; ECOG: Eastern Cooperative Oncology Group; OS: Overall survival; CPS: Combined positive score; pMMR: Proficient mismatch repair; dMMR: Deficient mismatch repair.
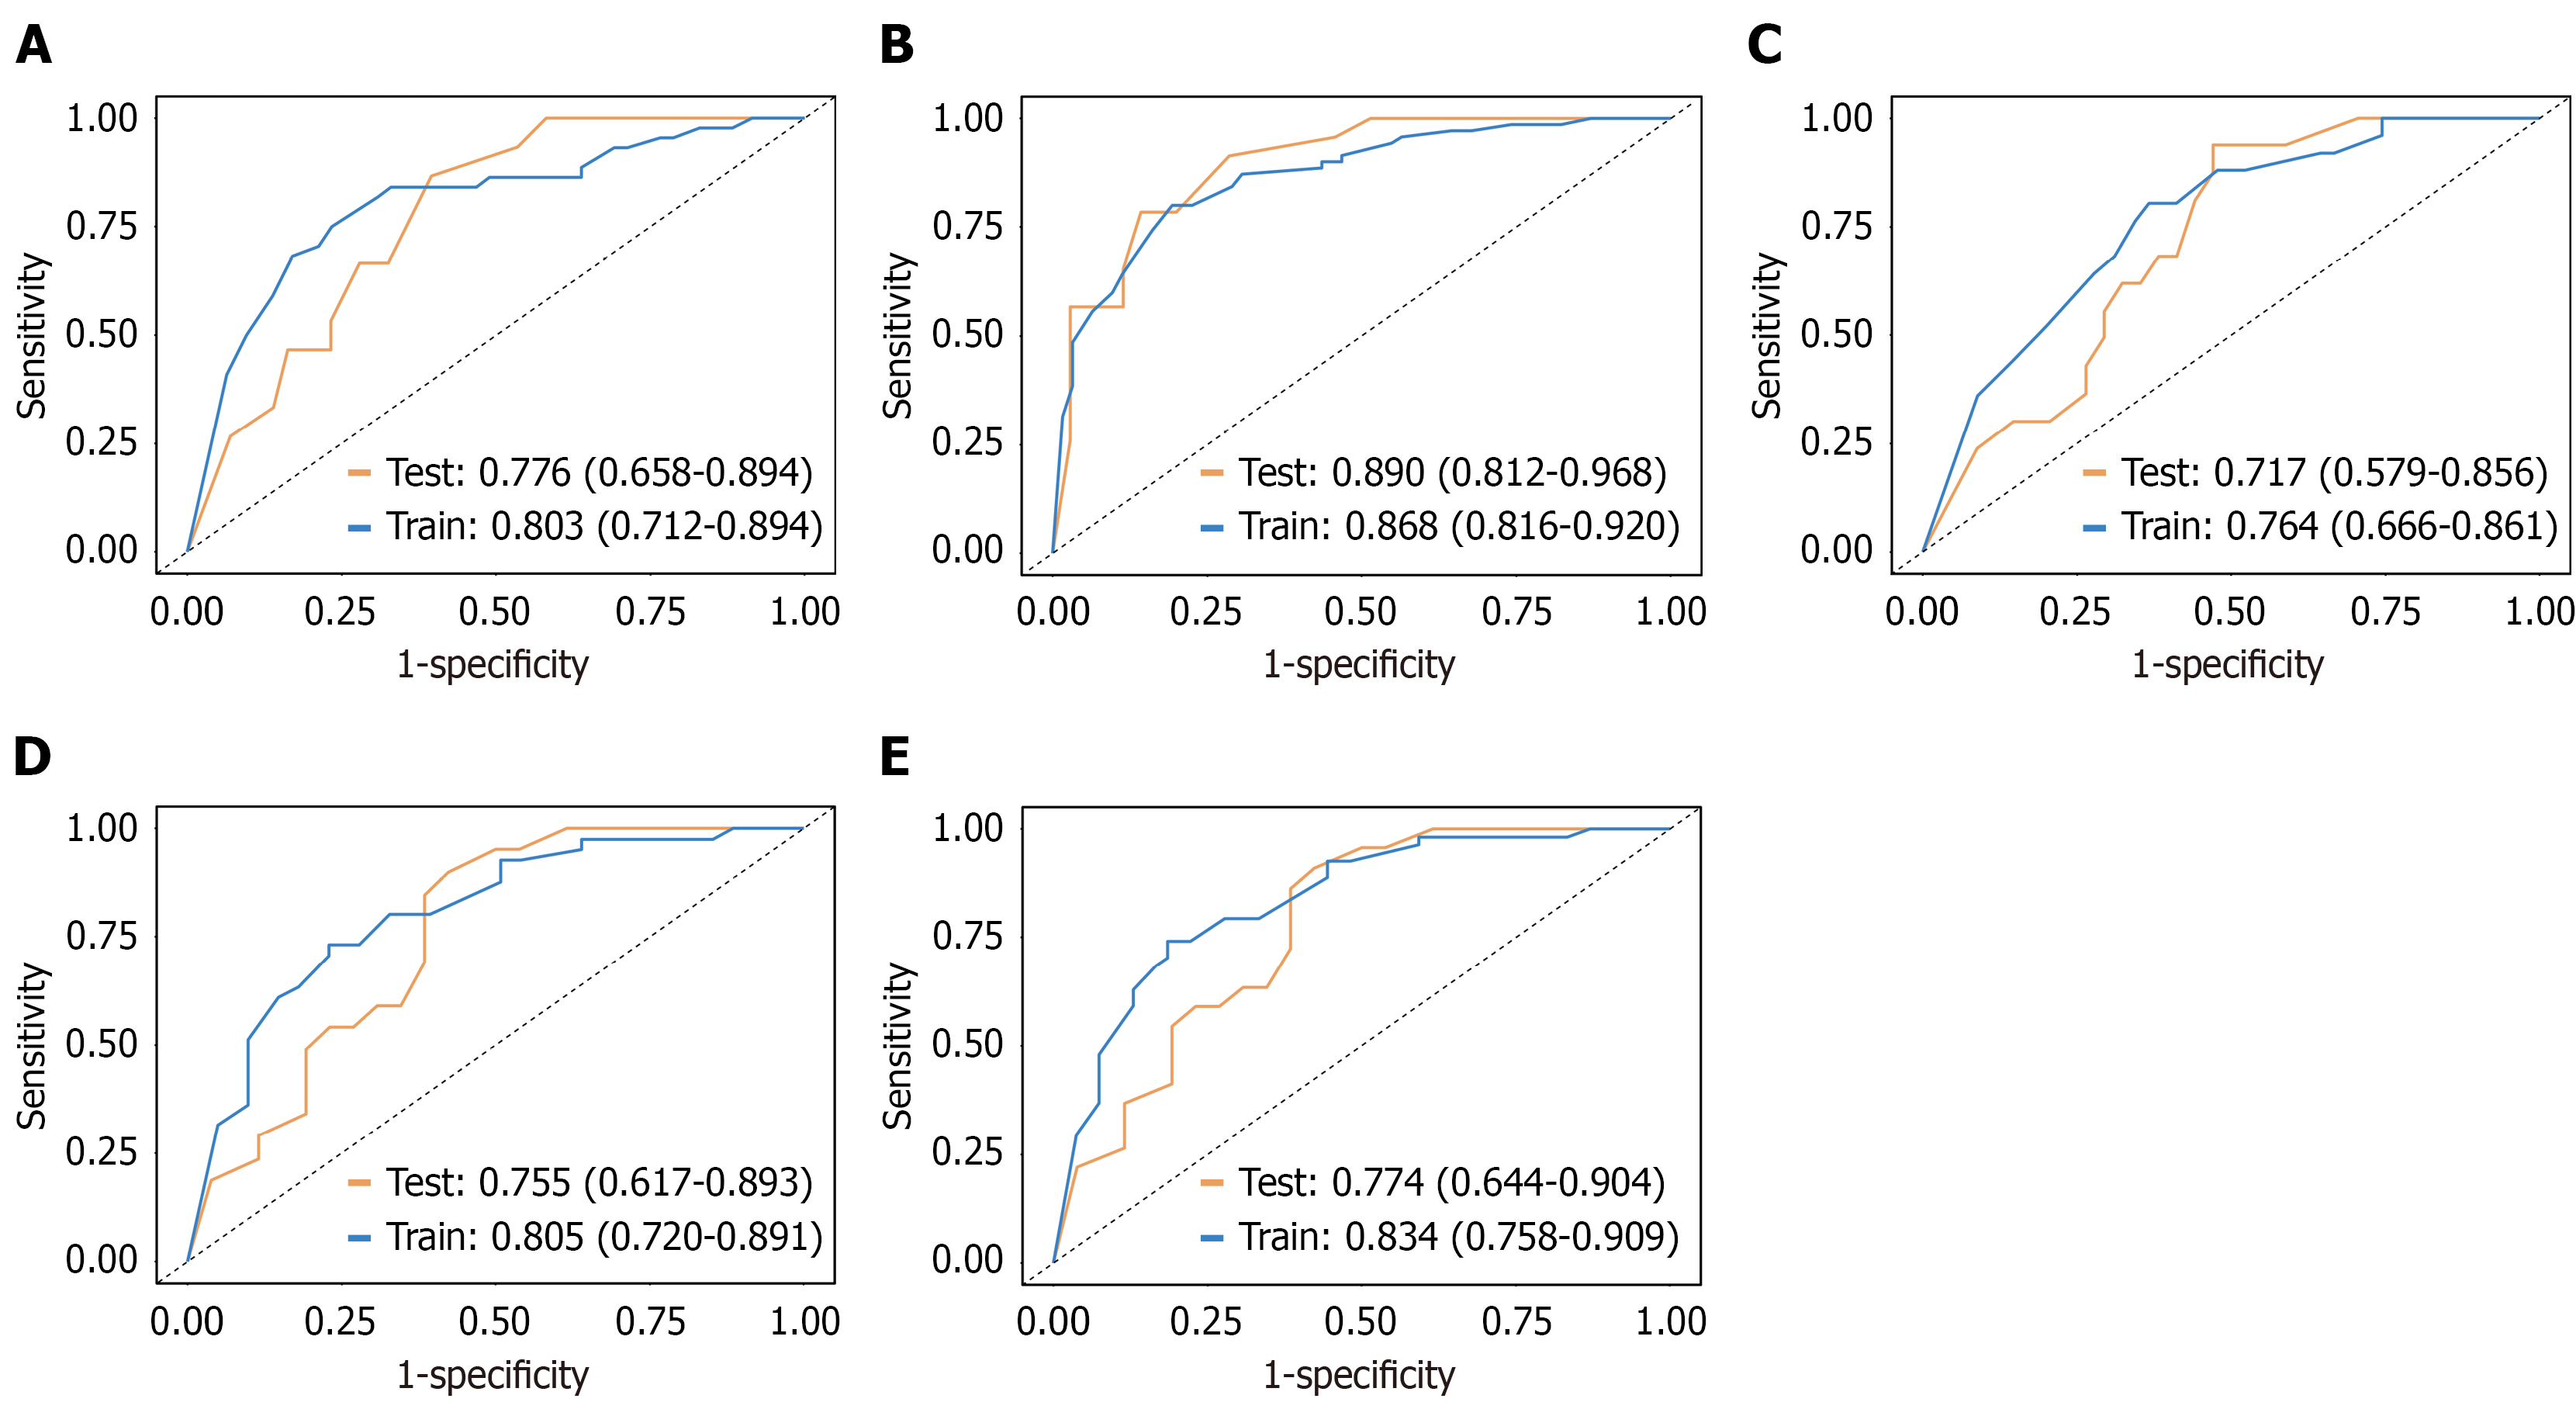
Figure 4 The operating characteristic evaluation plot for prognostic models.
A: The training set and validation receiver operating characteristic (ROC) evaluation plots for 6-month progression-free survival prognostic prediction model; B: The training set and validation set ROC evaluation plots for 9-month progression-free survival prognostic prediction model; C: The training set and validation set ROC evaluation plots for 12-month overall survival (OS) prognostic prediction model; D: The training set and validation set ROC evaluation plots for 15-month OS prognostic prediction model; E: The training set and validation set ROC evaluation plots for 18-month OS prognostic prediction model.
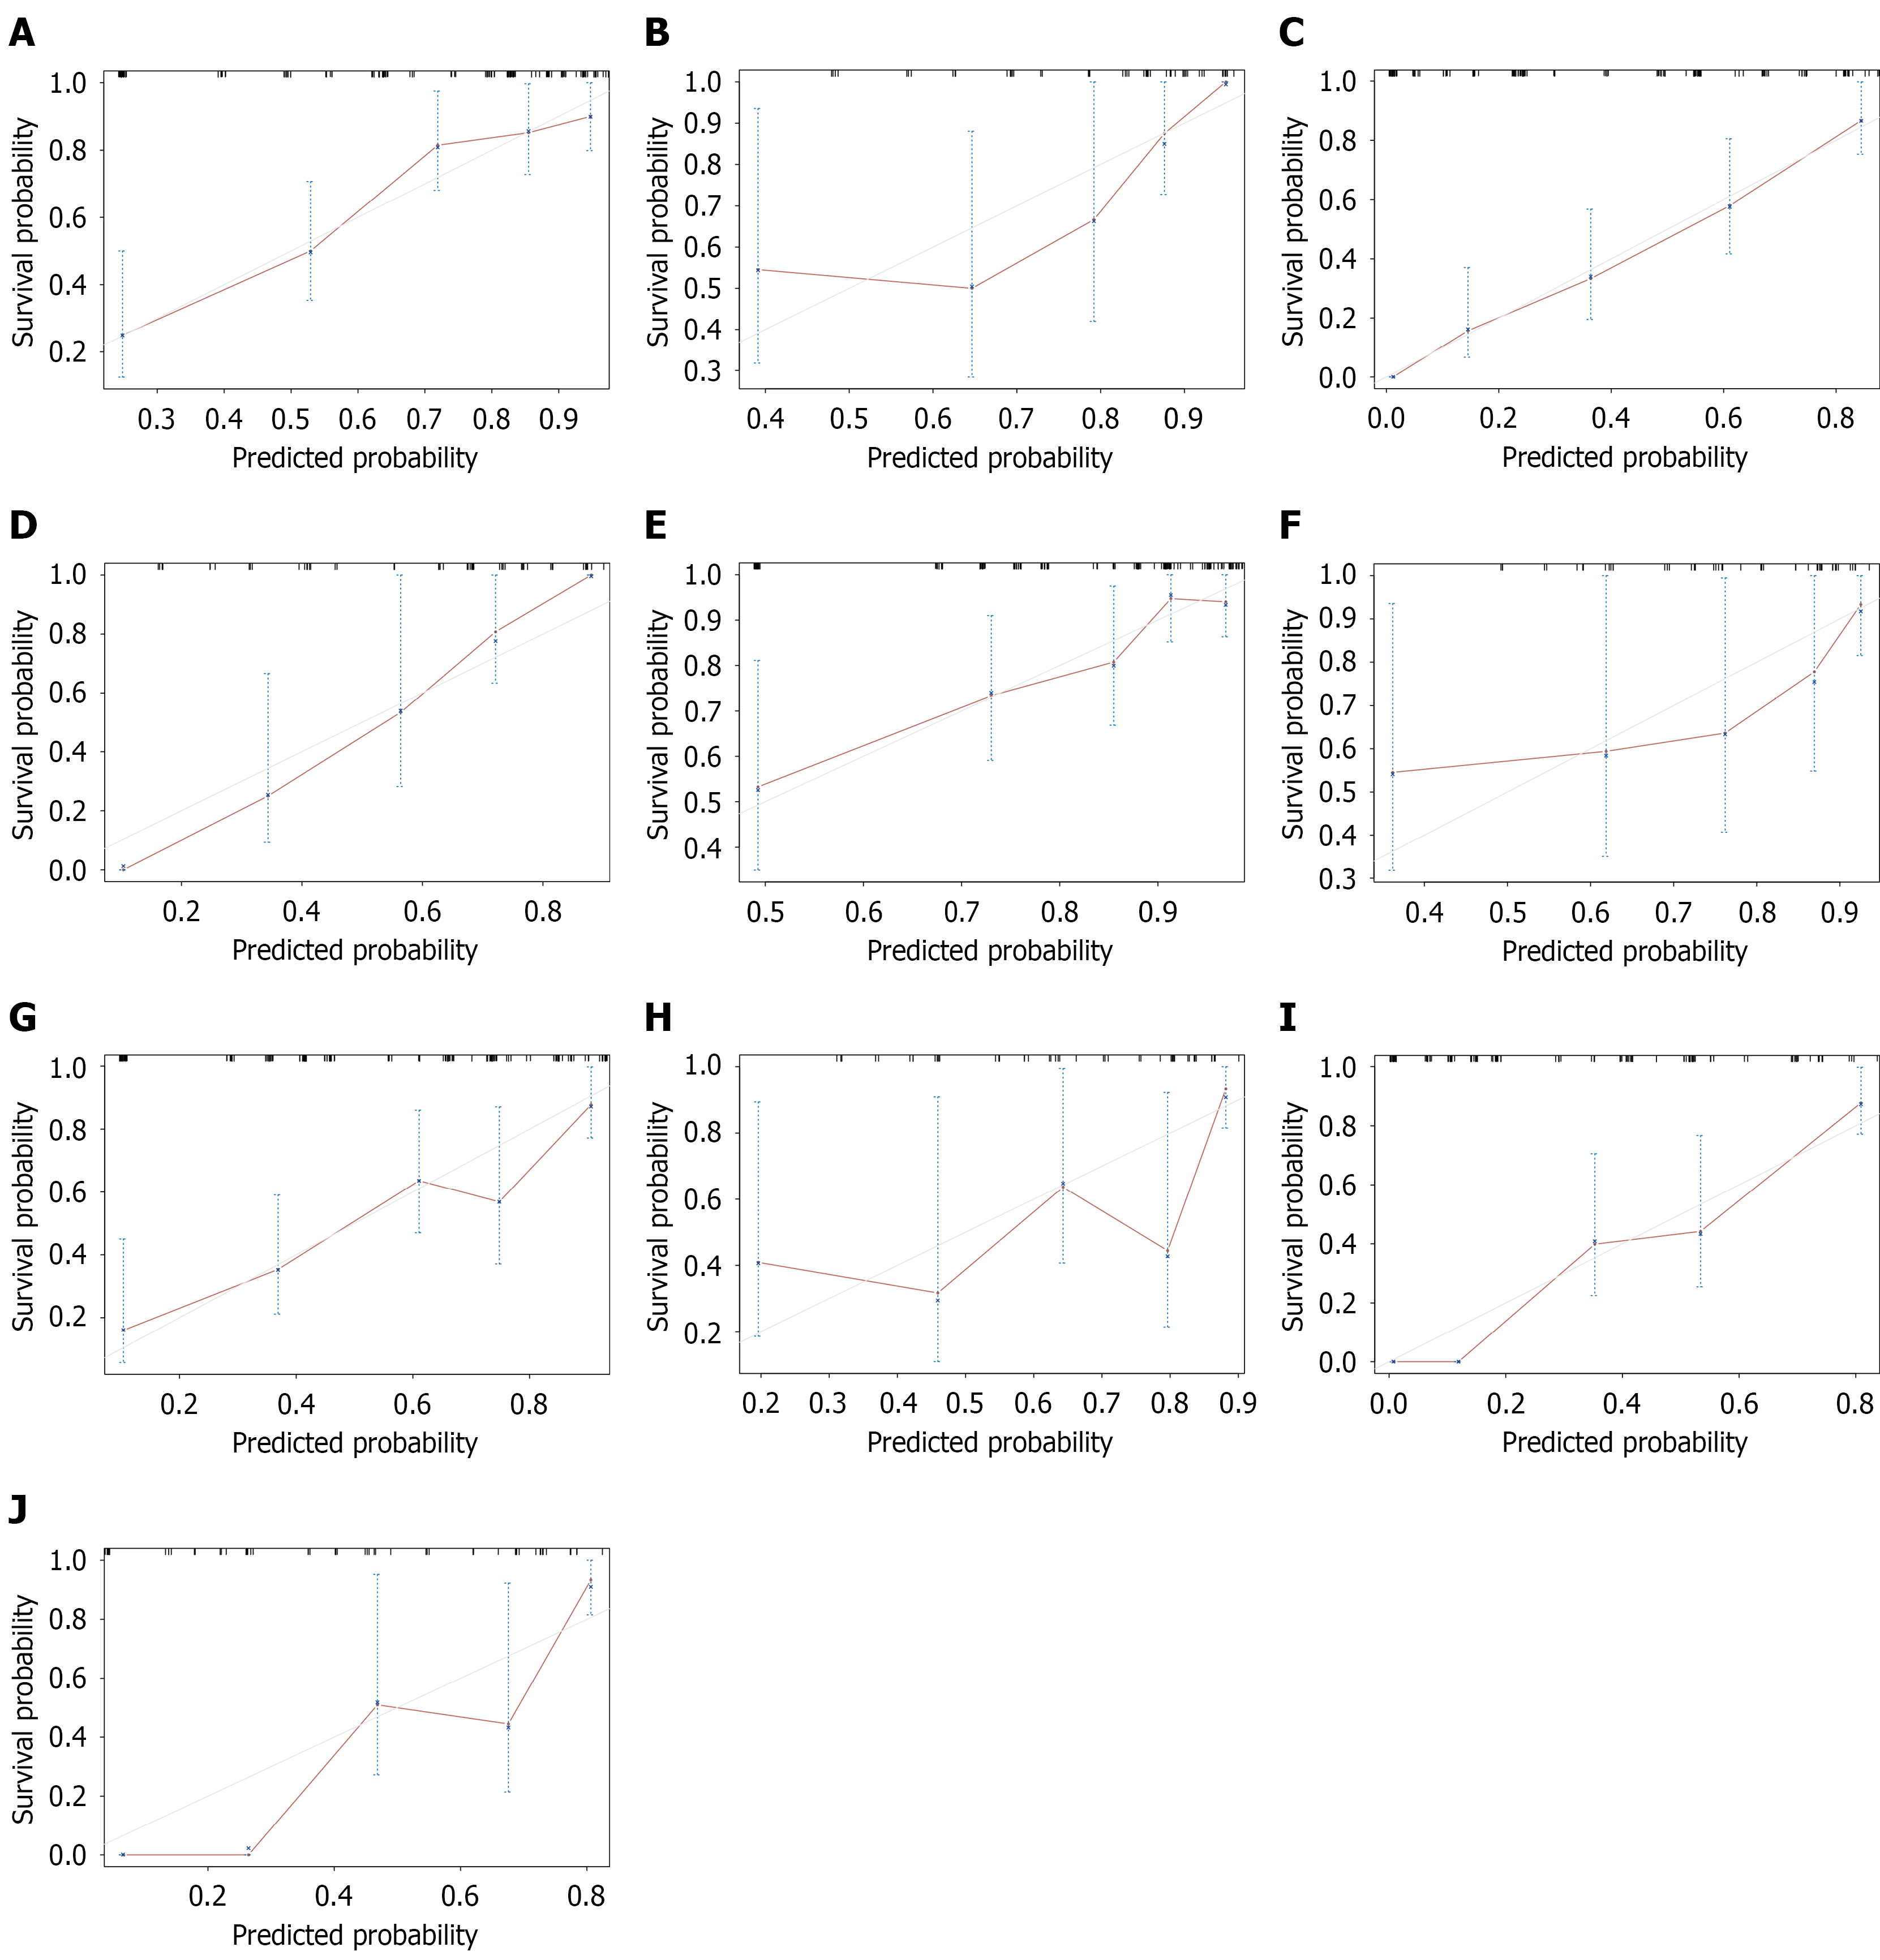
Figure 5 The calibration plots for prognostic models.
A: Calibration plots for the training set 6-month progression-free survival (PFS); B: Calibration plots for the validation set 6-month PFS; C: Calibration plots for the training set 9-month PFS; D: Calibration plots for the validation set 9-month PFS; E: Calibration plots for the training set 12-month overall survival (OS); F: Calibration plots for the validation set 12-month OS; G: Calibration plots for the training set 15-month OS; H: Calibration plots for the validation set 15-month OS; I: Calibration plots for the training set 18-month OS; J: Calibration plots for the validation set 18-month OS.
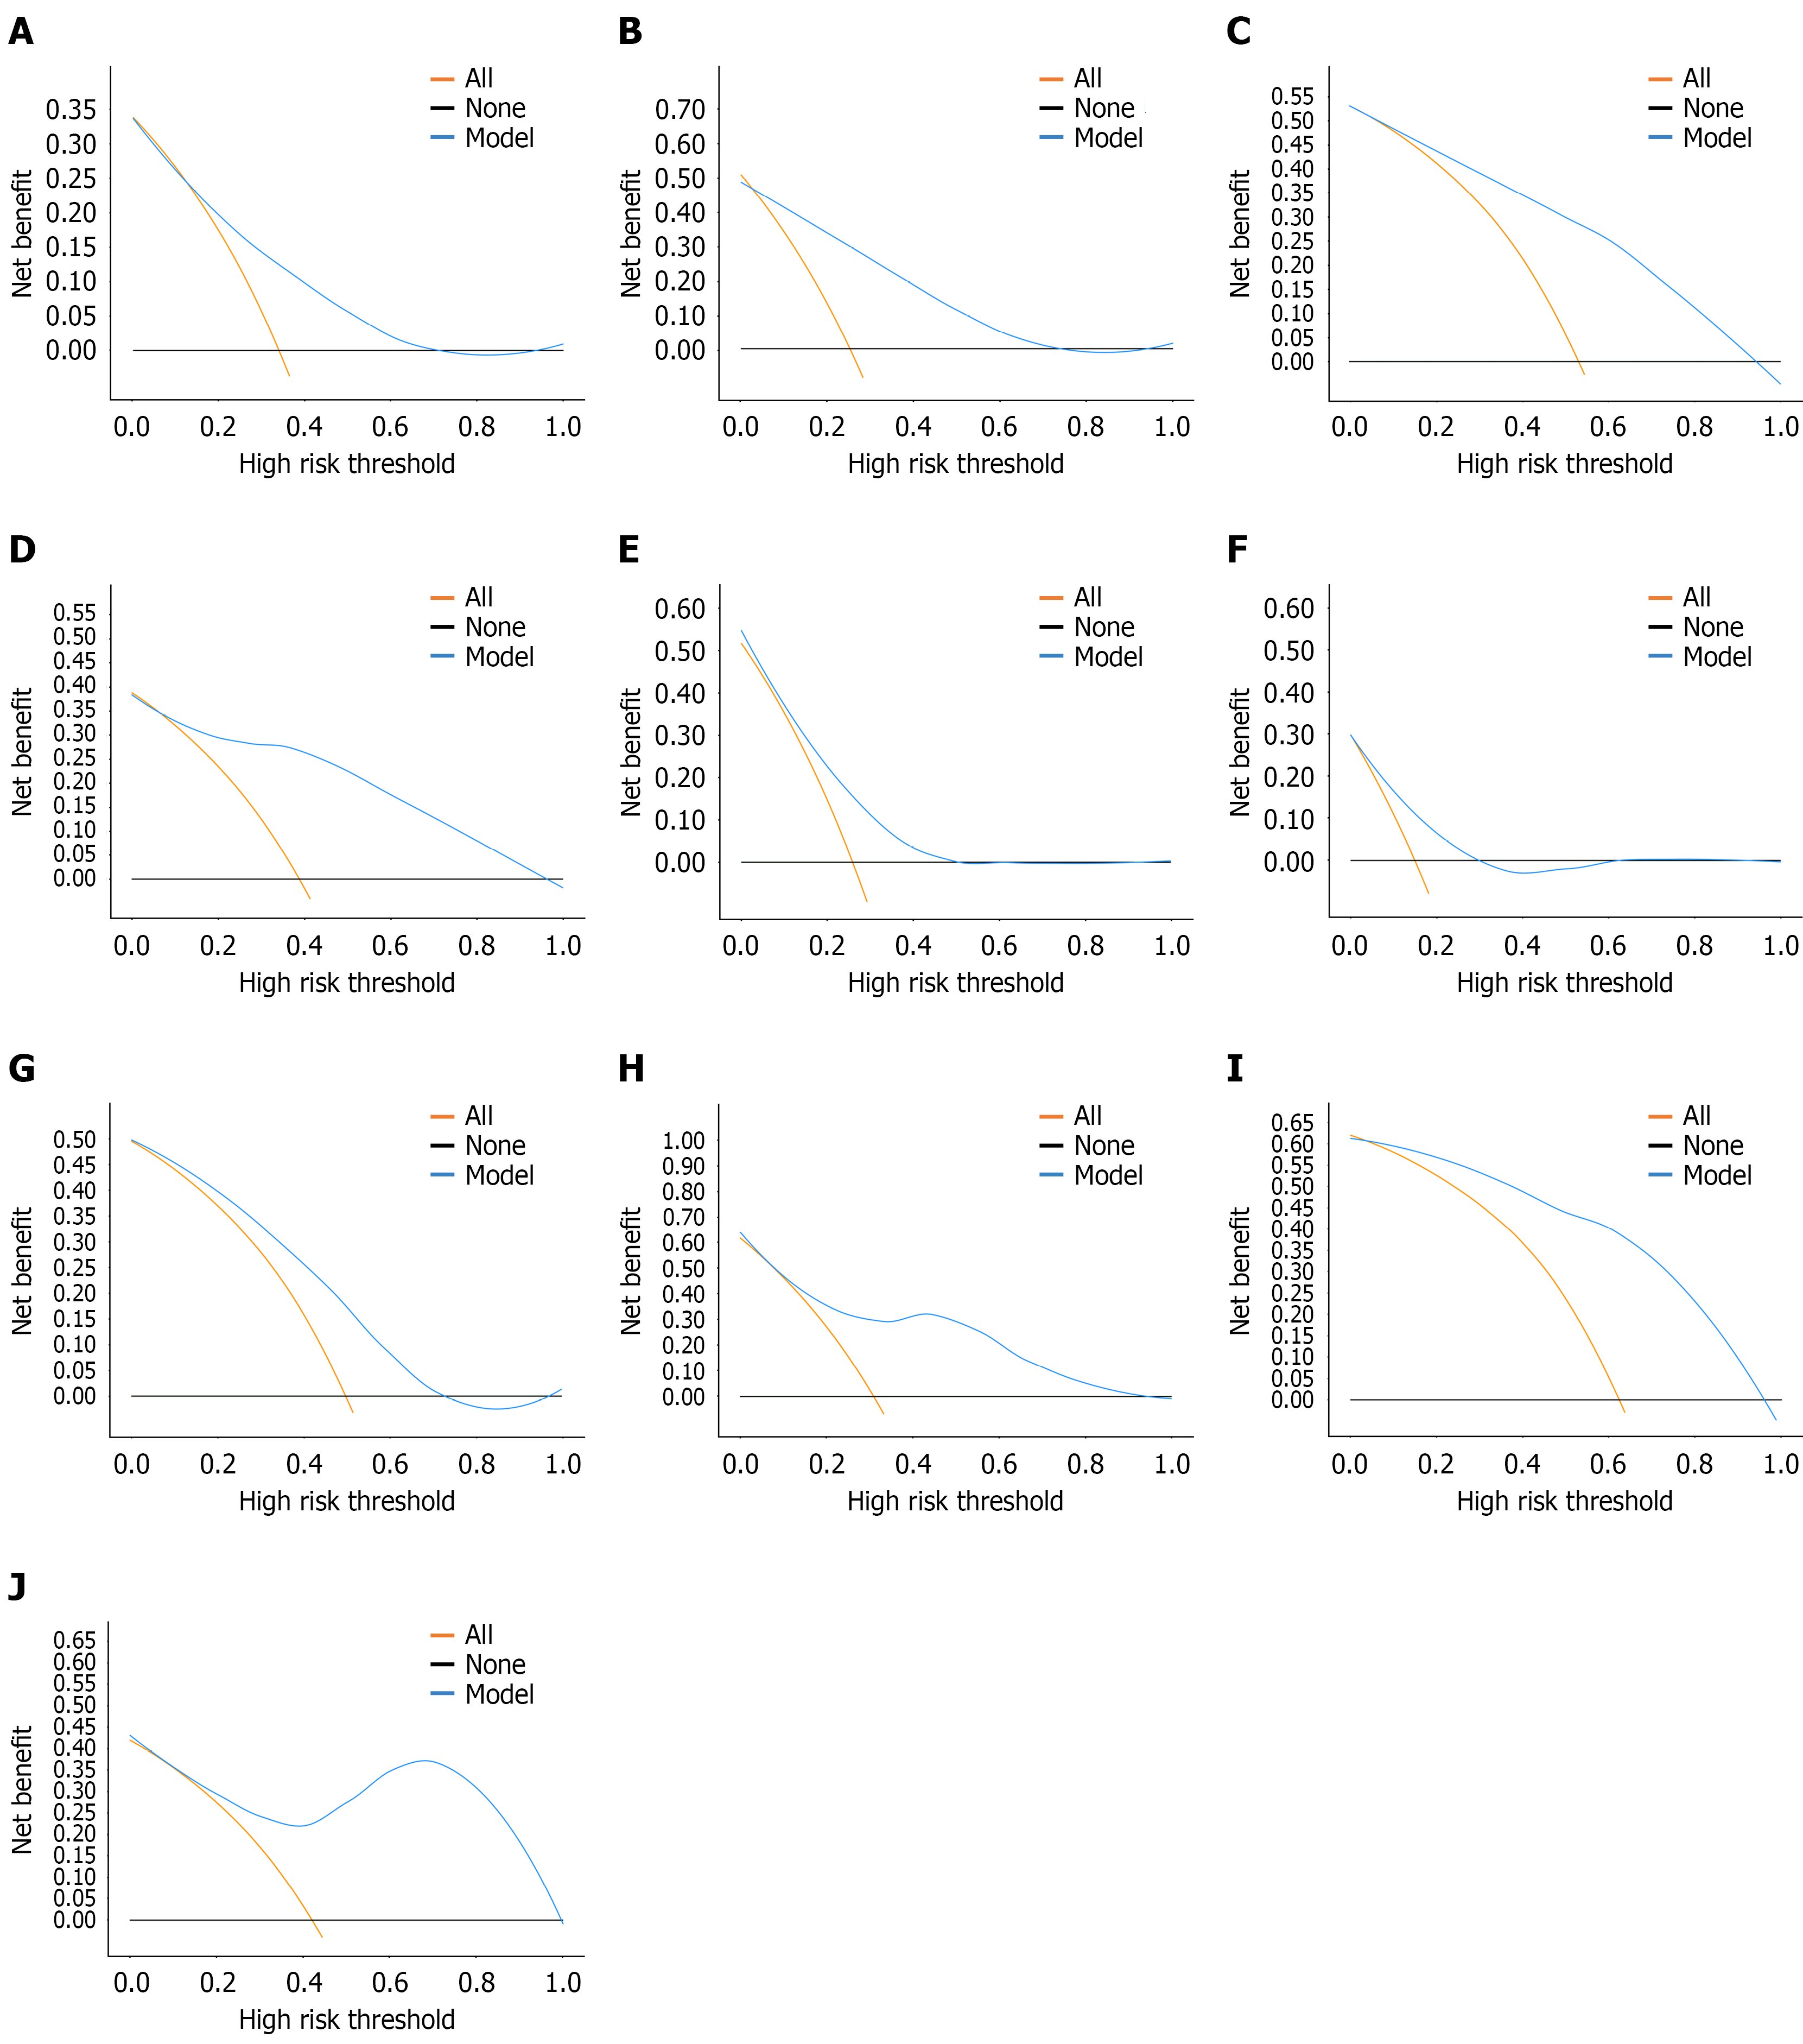
Figure 6 The decision curve analysis of prognostic models.
A: Decision curve analysis (DCA) of the training set 6-month progression-free survival (PFS); B: DCA of the validation set 6-month PFS; C: DCA of the training set 9-month PFS; D: DCA of the validation set 9-month PFS; E: DCA of the training set 12-month overall survival (OS); F: DCA of the validation set 12-month OS; G: DCA of the training set 15-month OS; H: DCA of the validation set 15-month OS; I: DCA of the training set 18-month OS; J: DCA of the validation set 18-month OS.
- Citation: Hao QL, Li ZY, Yao ZY, Shen YM, Sun DS, Gao C, Jiang RR. Prognostic value of the prognostic immune-inflammatory-nutritional score in patients with advanced gastric cancer treated with immunochemotherapy. World J Gastrointest Oncol 2026; 18(10): 122724
- URL: https://www.wjgnet.com/1948-5204/full/v18/i10/122724.htm
- DOI: https://dx.doi.org/10.4251/wjgo.122724