
















Copyright: ©Author(s) 2026.
World J Gastrointest Oncol. Oct 15, 2026; 18(10): 122608
Published online Oct 15, 2026. doi: 10.4251/wjgo.122608
Published online Oct 15, 2026. doi: 10.4251/wjgo.122608
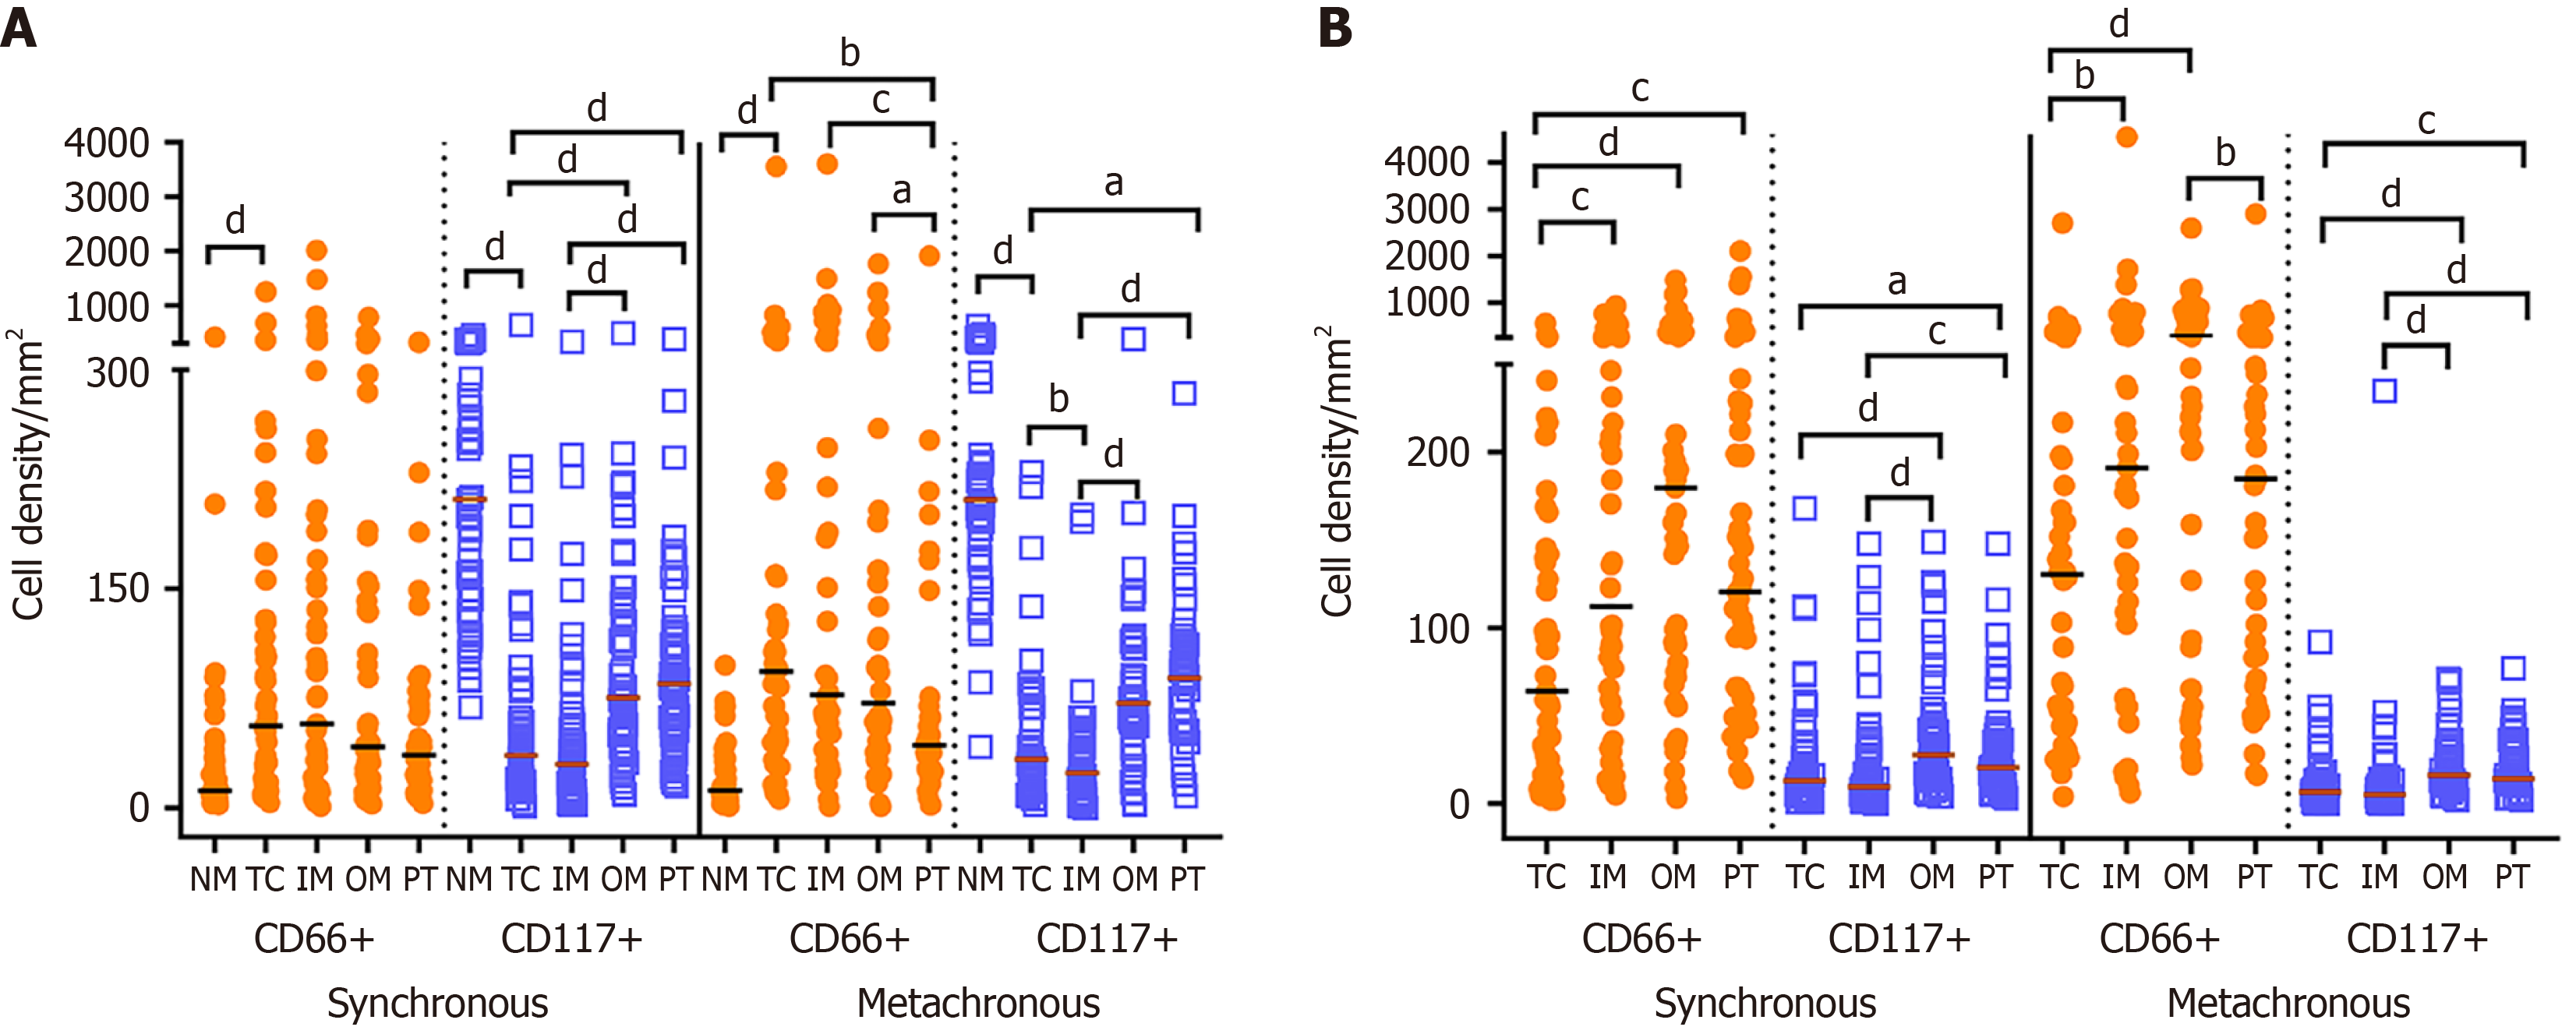
Figure 1 Distribution of CD66b+ polymorphonuclear neutrophils and CD117+ mast cells in non-tumor mucosa, primary colorectal cancer and liver metastasis.
A: Cell densities between non-tumor mucosa and all regions of interest of primary colorectal cancer in synchronous group and metachronous group; B: Cell densities between all regions of interest of liver metastasis (LM) in synchronous group and metachronous group. Friedman ANOVA with Dunn’s post hoc test were used for comparisons between regions of interest. aP < 0.05; bP < 0.01; cP < 0.005; dP < 0.001. NM: Non-tumor mucosa; TC: Tumor center; IM: Inner margin; OM: Outer margin; PT: Peritumor zone.
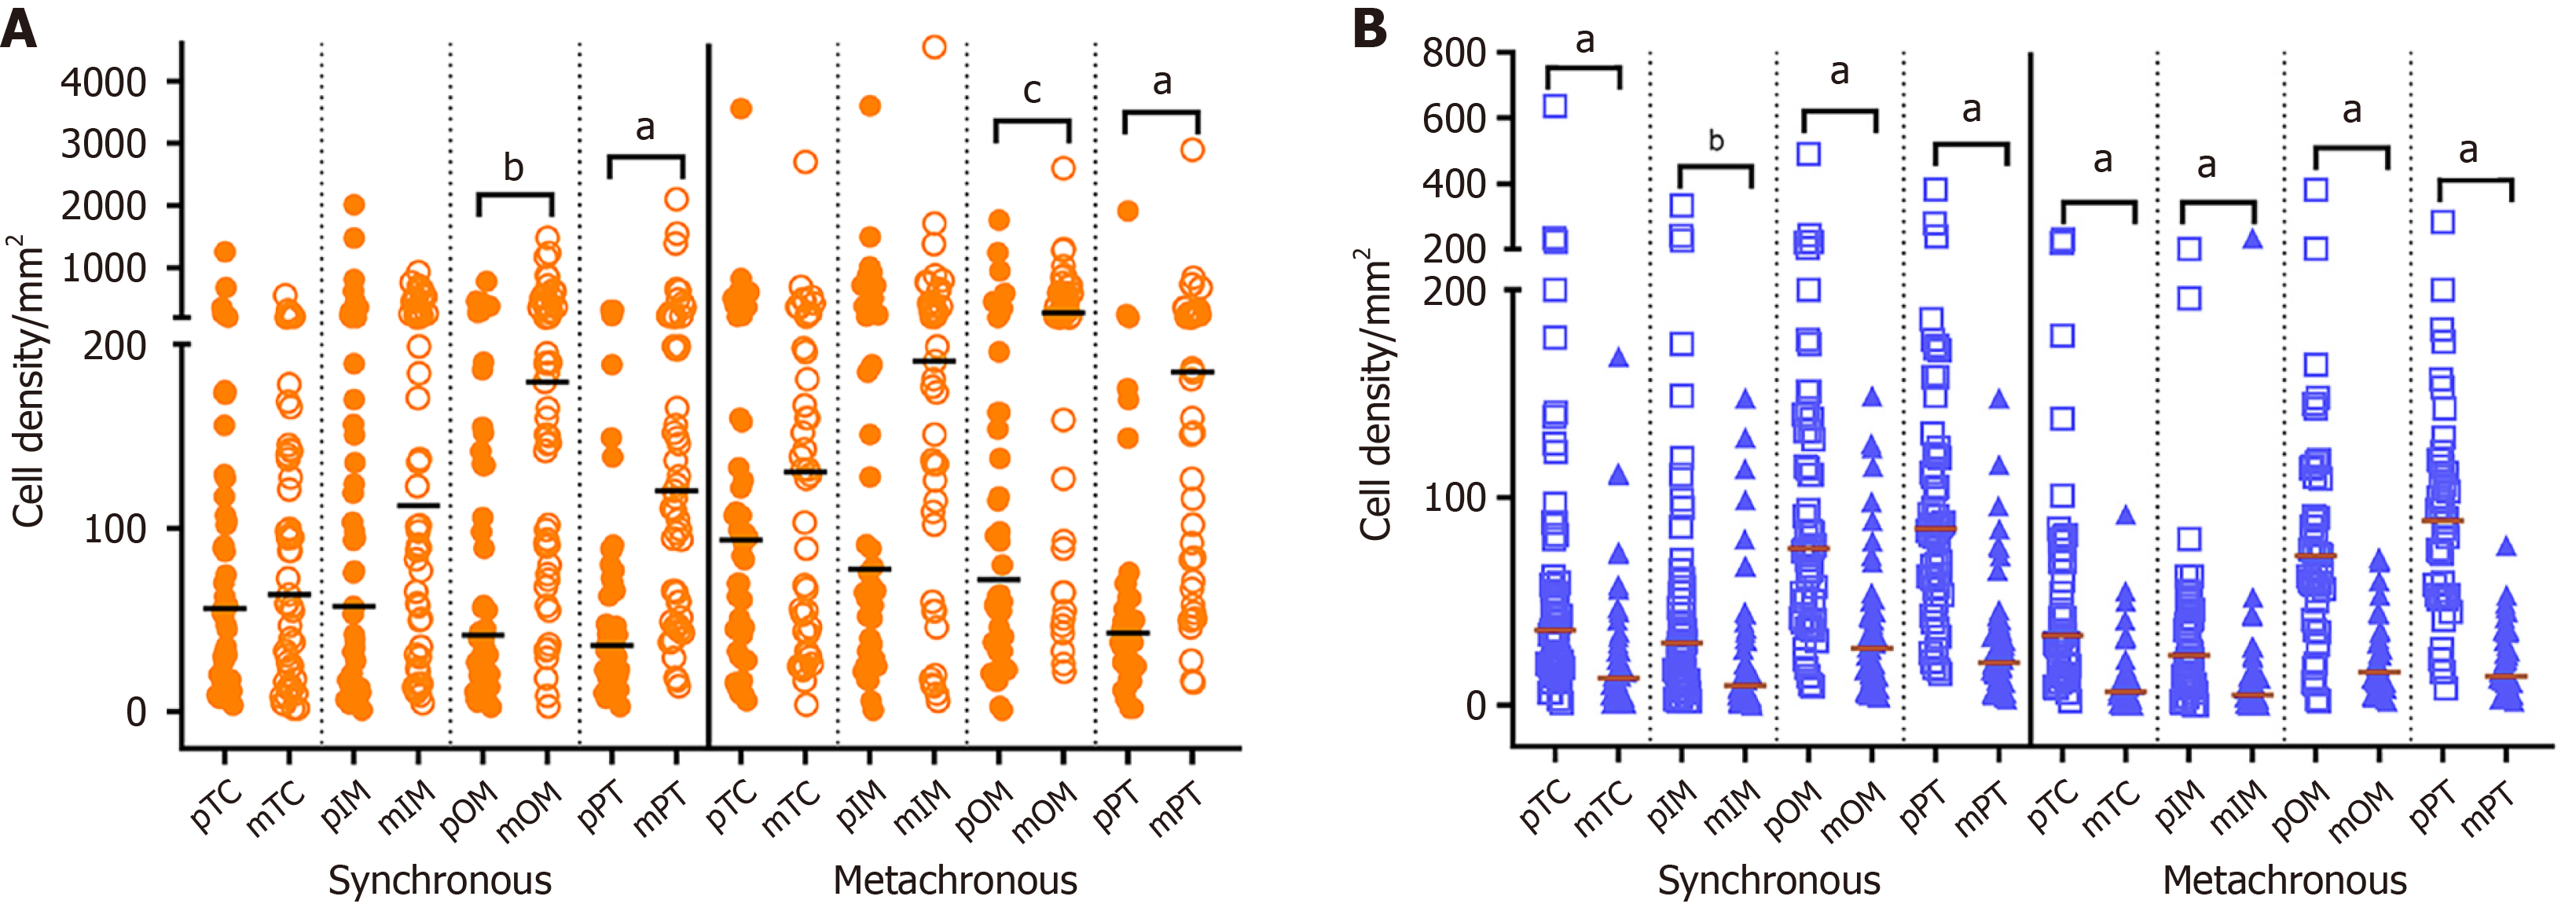
Figure 2 Distribution of CD66b+ polymorphonuclear neutrophils and CD117+ mast cells between different regions of interest of primary colorectal cancer and liver metastasis in synchronous and metachronous groups.
A: CD66b+ polymorphonuclear neutrophils; B: CD117+ mast cells. Friedman ANOVA with Dunn’s post hoc test were used for comparisons between regions of interest. aP < 0.001; bP < 0.01; cP < 0.005. pTC: Tumor center of primary colorectal cancer; mTC: Tumor center of liver metastasis; pIM: Inner margin of primary colorectal cancer; mIM: Inner margin of liver metastasis; pOM: Outer margin of primary colorectal cancer; mOM: Outer margin of liver metastasis; pPT: Peritumor zone of primary colorectal cancer; mPT: Peritumor zone of liver metastasis.
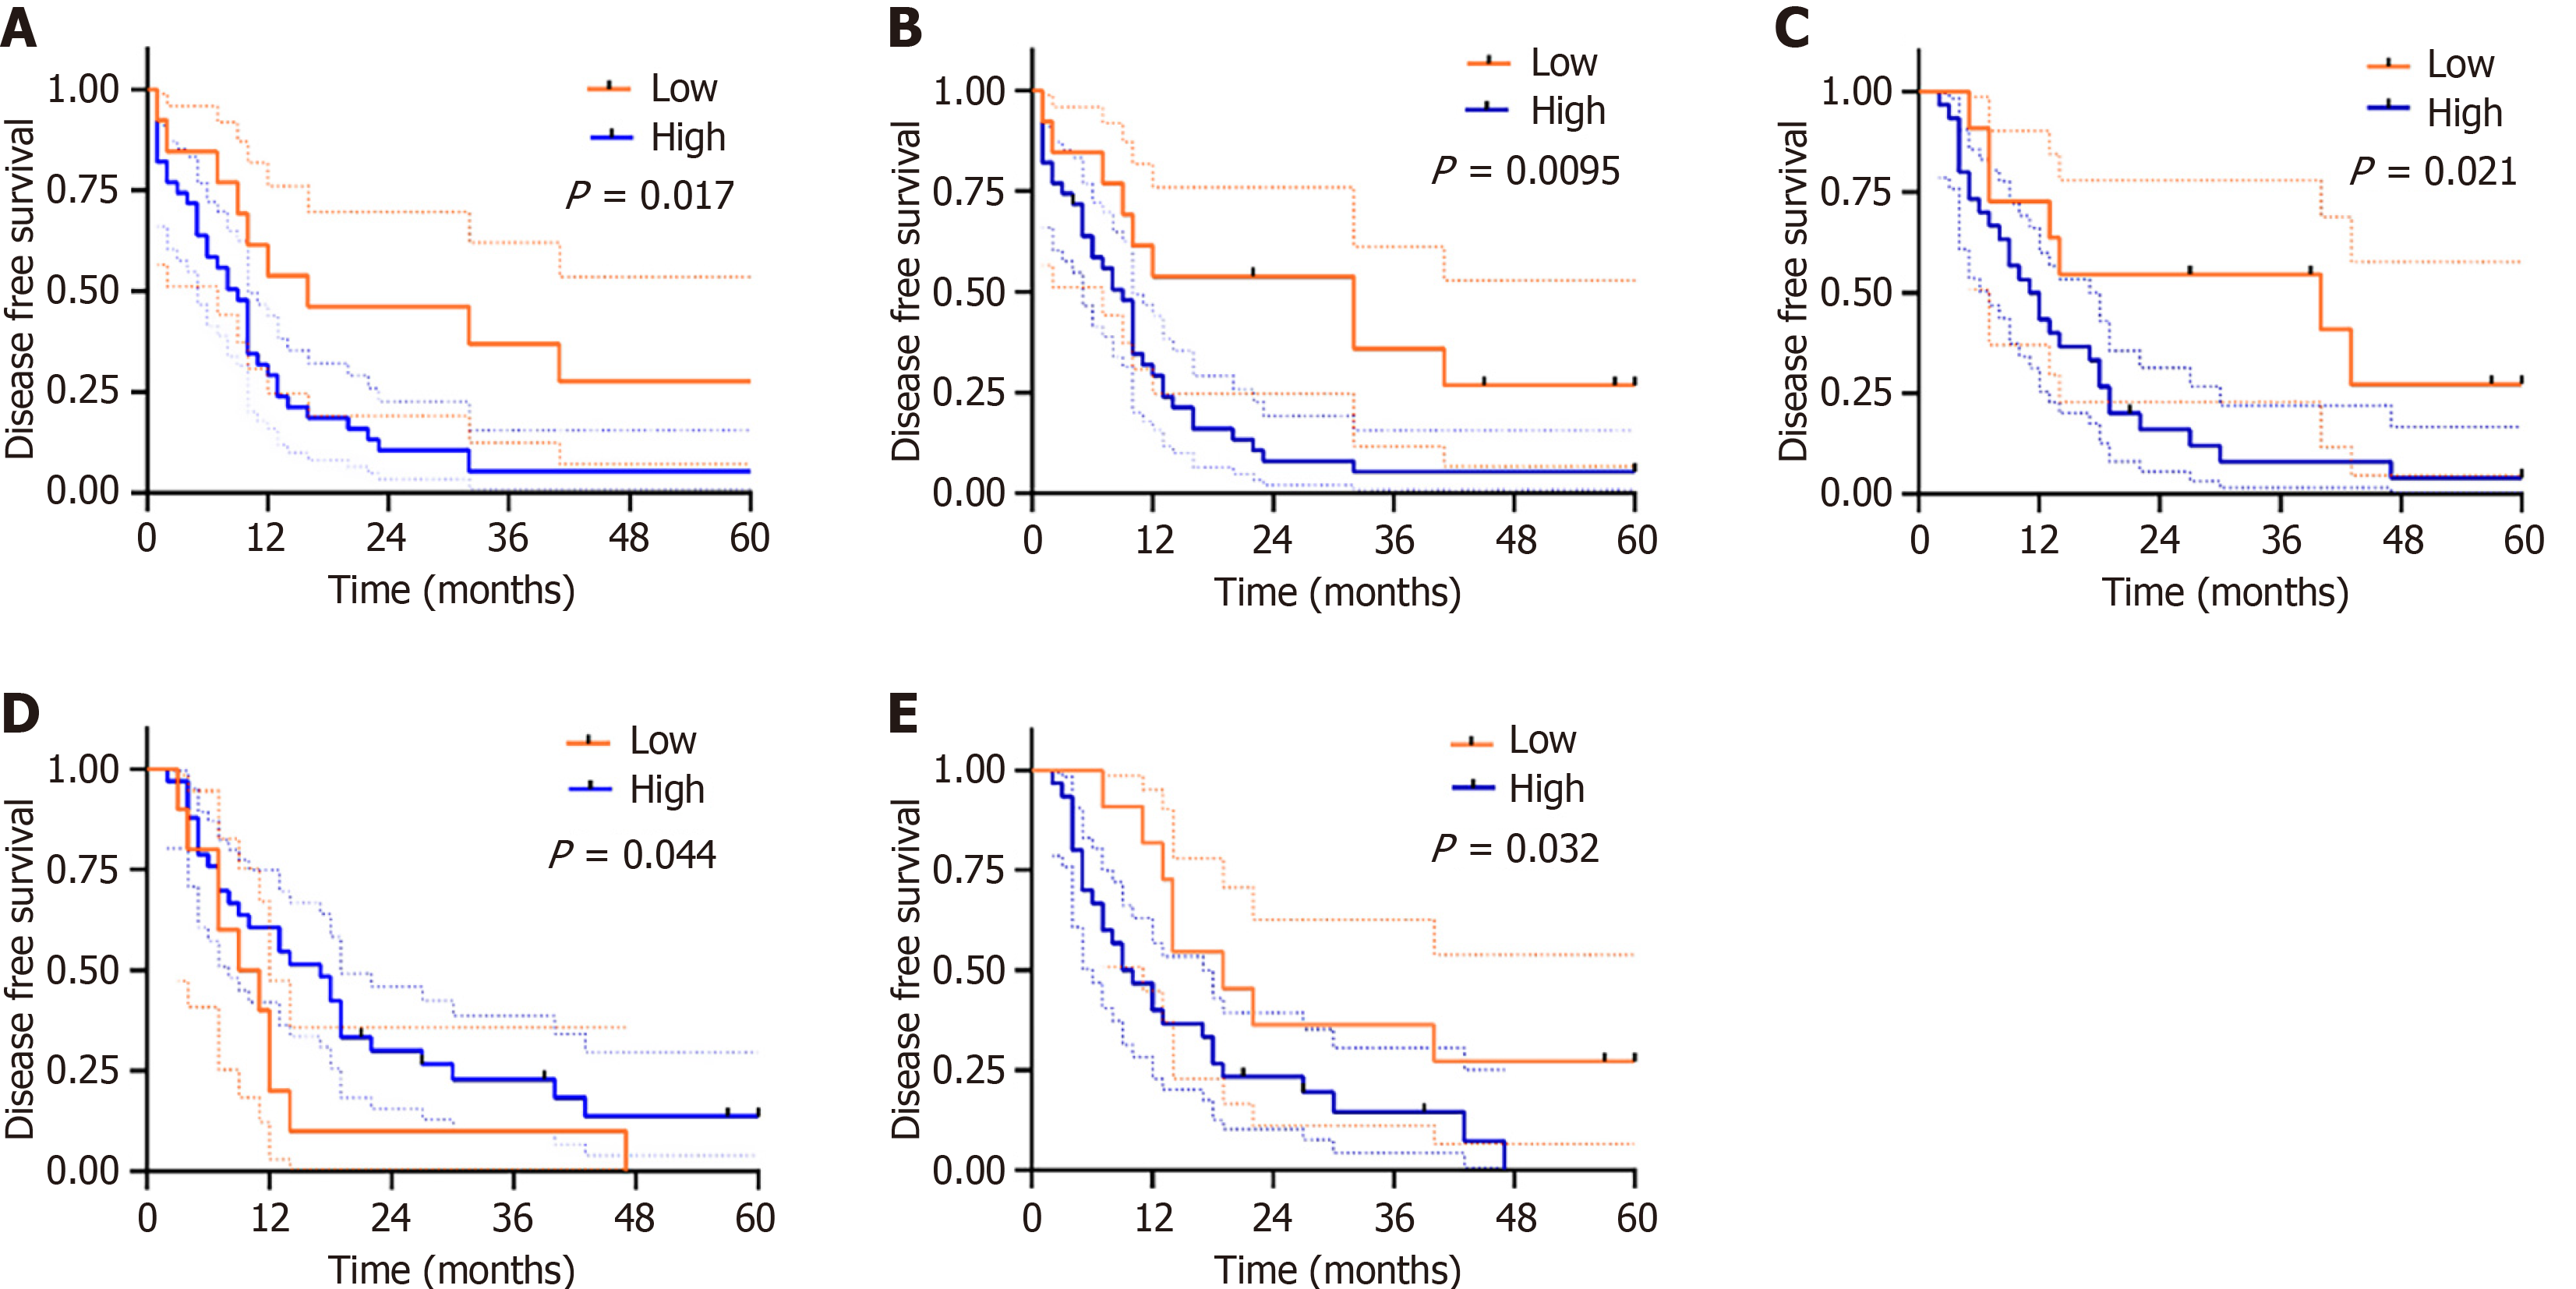
Figure 3 Associations between disease-free survival and high vs low densities of CD66b+ polymorphonuclear neutrophils and CD117+ mast cells in regions of interest of primary colorectal cancer and liver metastasis.
A: Polymorphonuclear neutrophils (PMNs) in outer margin (OM) of synchronous liver metastasis (LM); B: PMNs in peritumor zone of synchronous LM; C: PMNs in OM of primary colorectal cancer (pCRC) in the metachronous group; D: PMNs in tumor center (TC) of LM in the metachronous group; E: Mast cells in TC of pCRC in the metachronous group. Orange and blue dotted lines: 95%CIs of Kaplan-Meier curves in “low” and “high” groups.
- Citation: Ye WJ, Ali E, Pavlov S, Červenková L, Ambrozkiewicz F, Vyčítal O, Hošek P, Daum O, Liška V, Hemminki K, Trailin A. Context-dependent prognostic role of neutrophils and mast cells in primary colorectal cancer and liver metastases. World J Gastrointest Oncol 2026; 18(10): 122608
- URL: https://www.wjgnet.com/1948-5204/full/v18/i10/122608.htm
- DOI: https://dx.doi.org/10.4251/wjgo.122608