
















Copyright: ©Author(s) 2026.
World J Gastrointest Oncol. Oct 15, 2026; 18(10): 121850
Published online Oct 15, 2026. doi: 10.4251/wjgo.121850
Published online Oct 15, 2026. doi: 10.4251/wjgo.121850
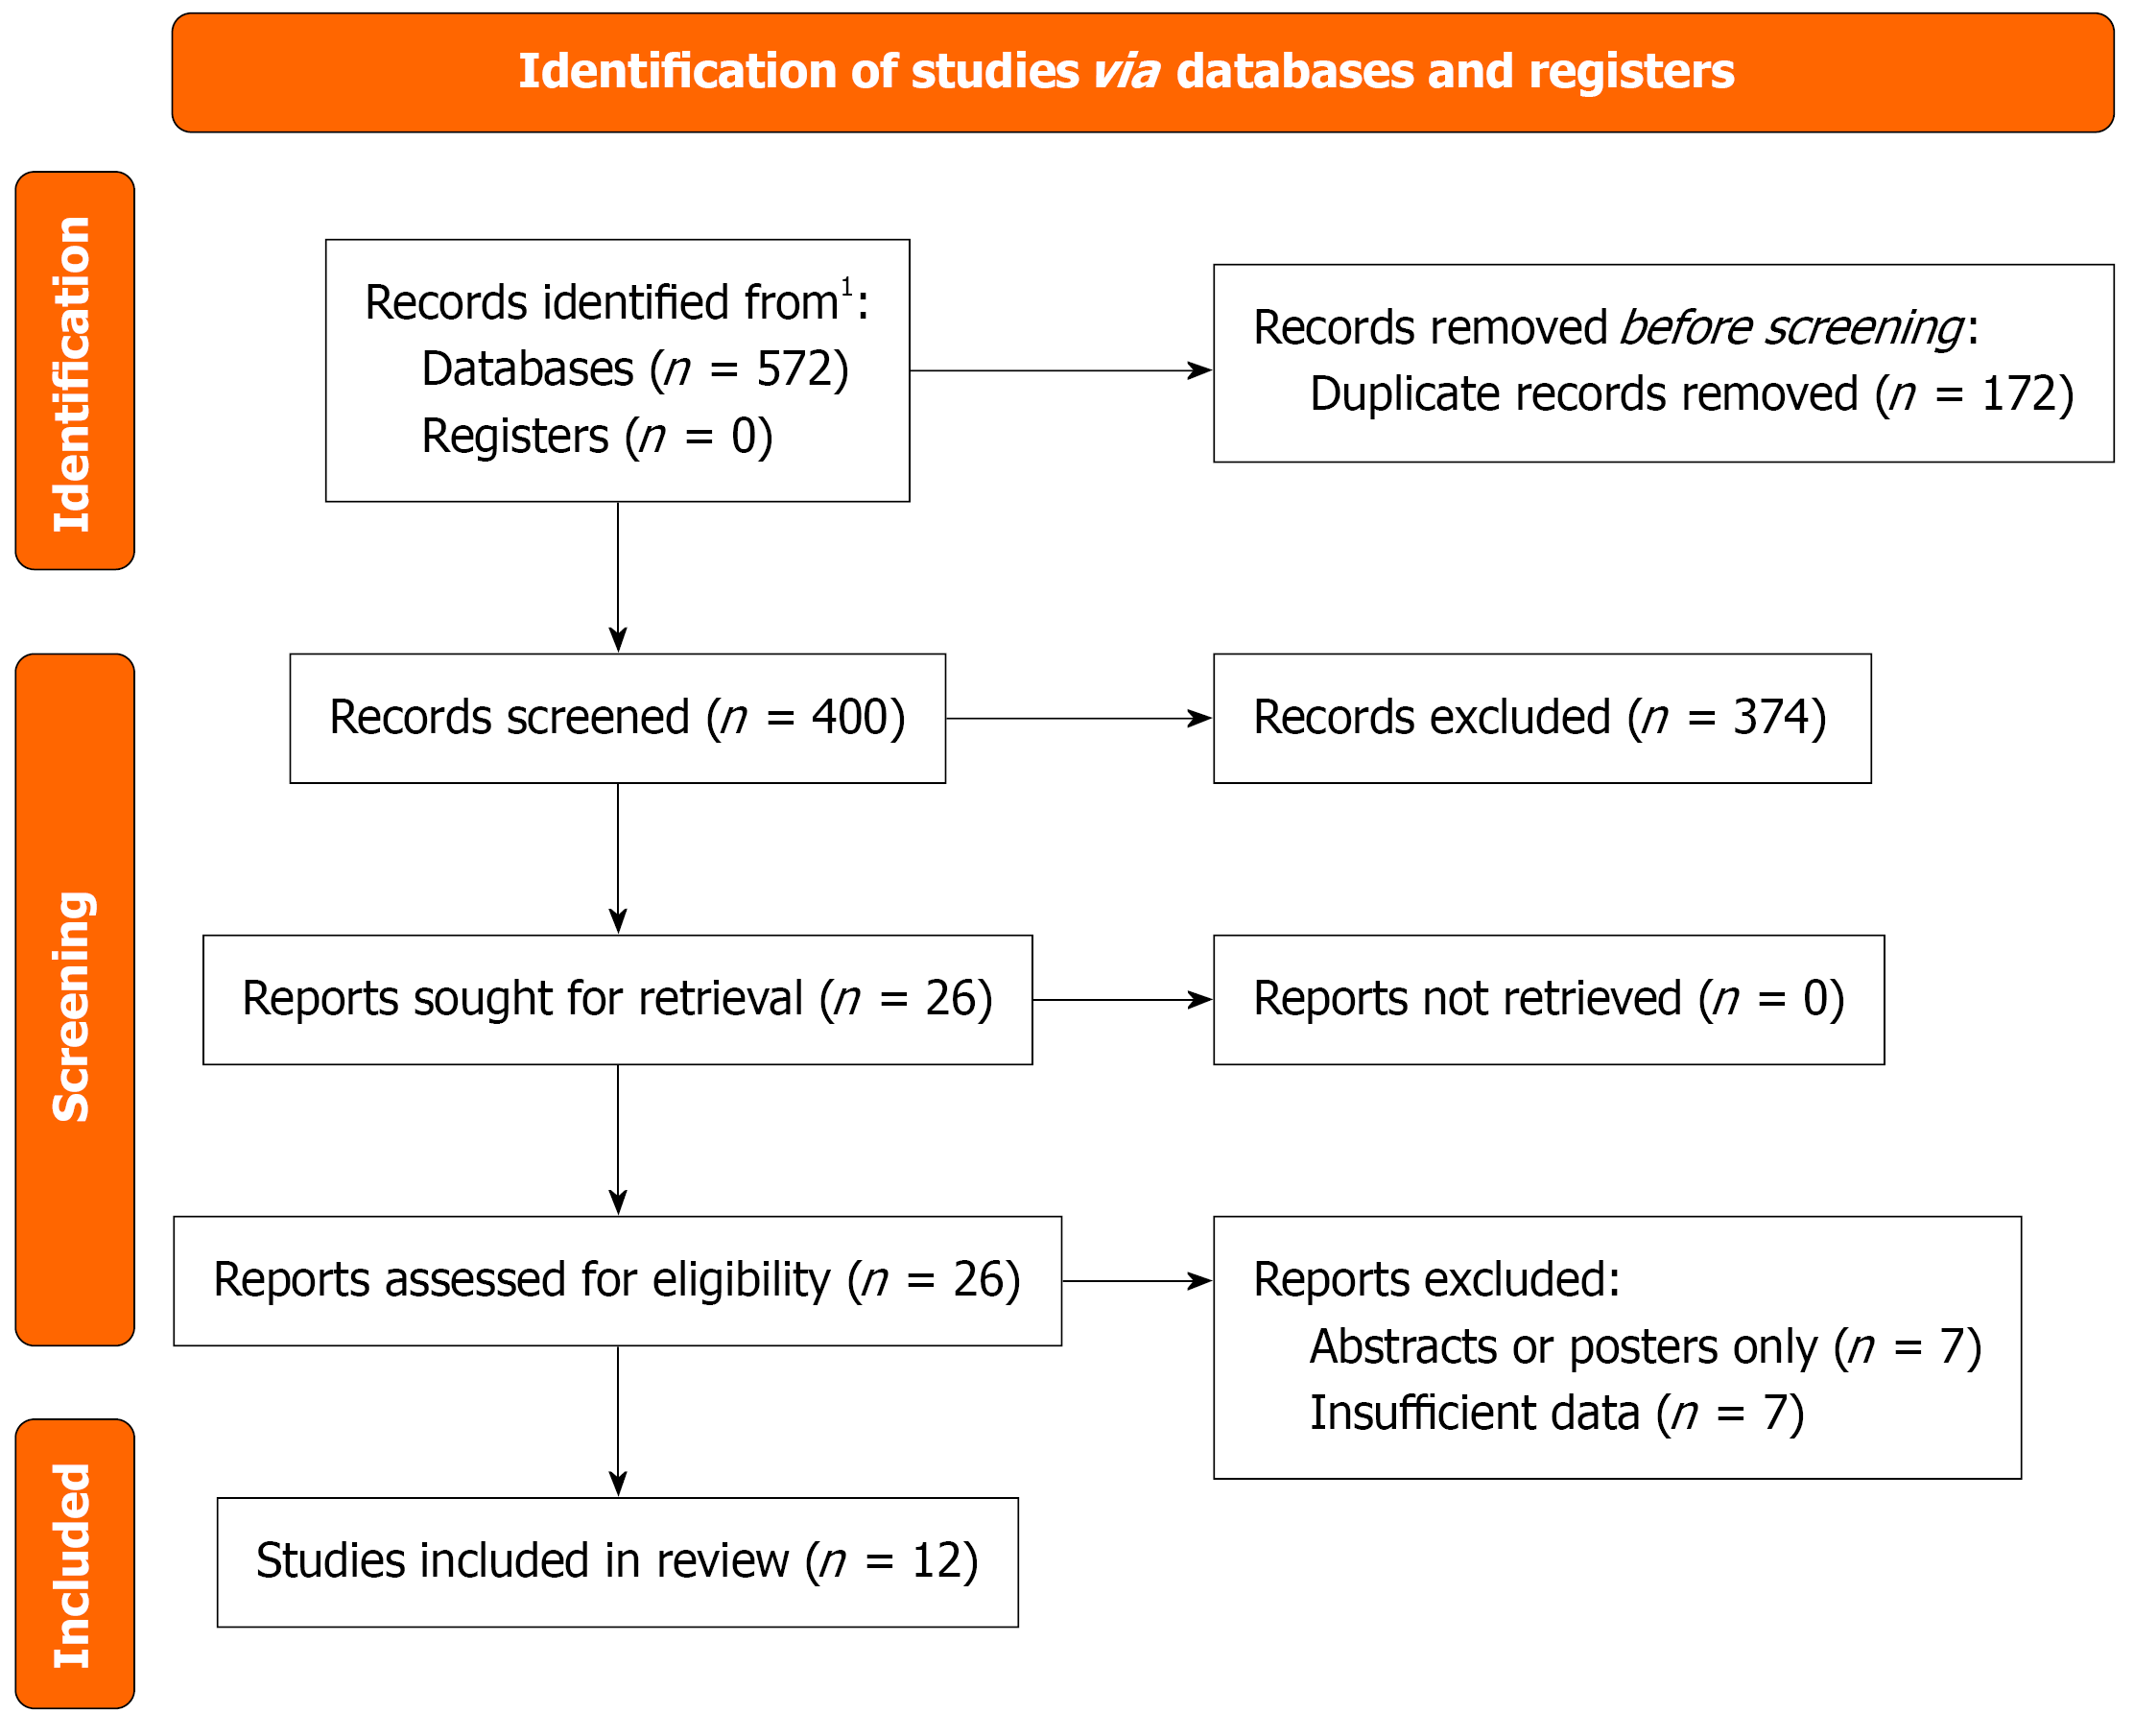
Figure 1 PRISMA flow diagram of study selection.
1The number of records identified from each database is reported separately.
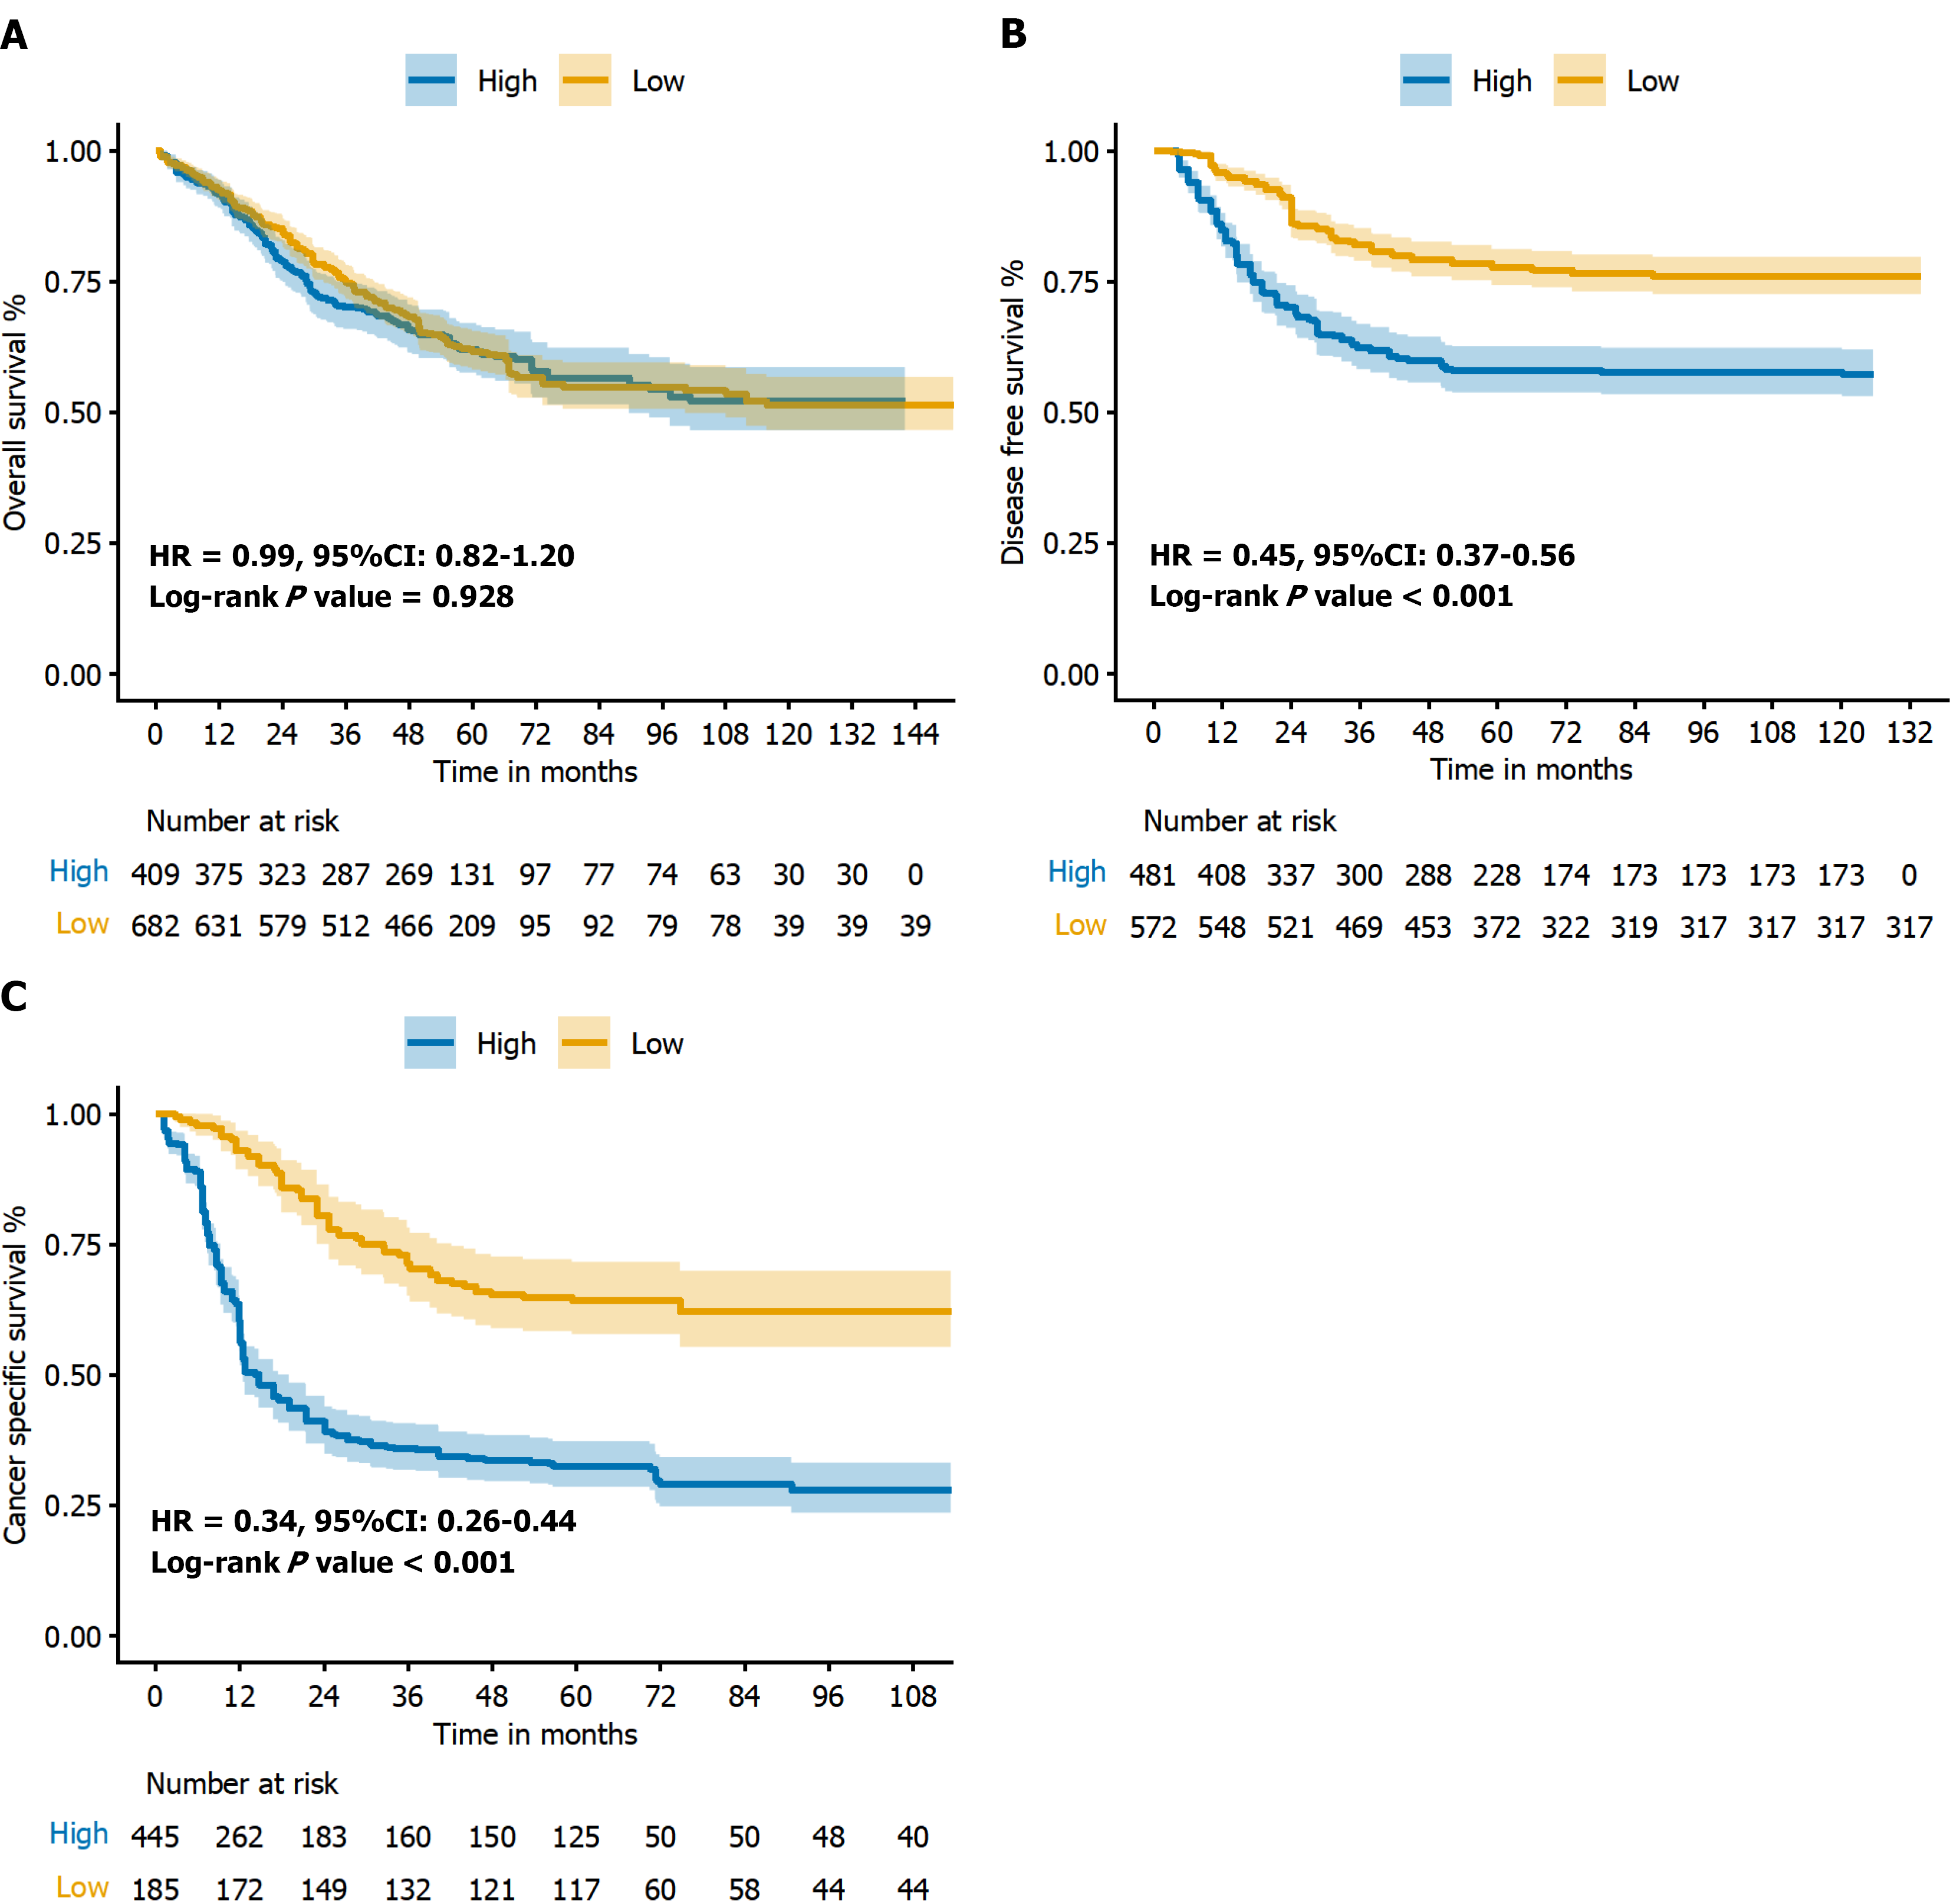
Figure 2 Kaplan–Meier survival curves stratified by tissue Fusobacterium nucleatum expression.
A: Overall survival; B: Disease-free survival; C: Cancer-specific survival. CI: Confidence interval; HR: Hazard ratio.
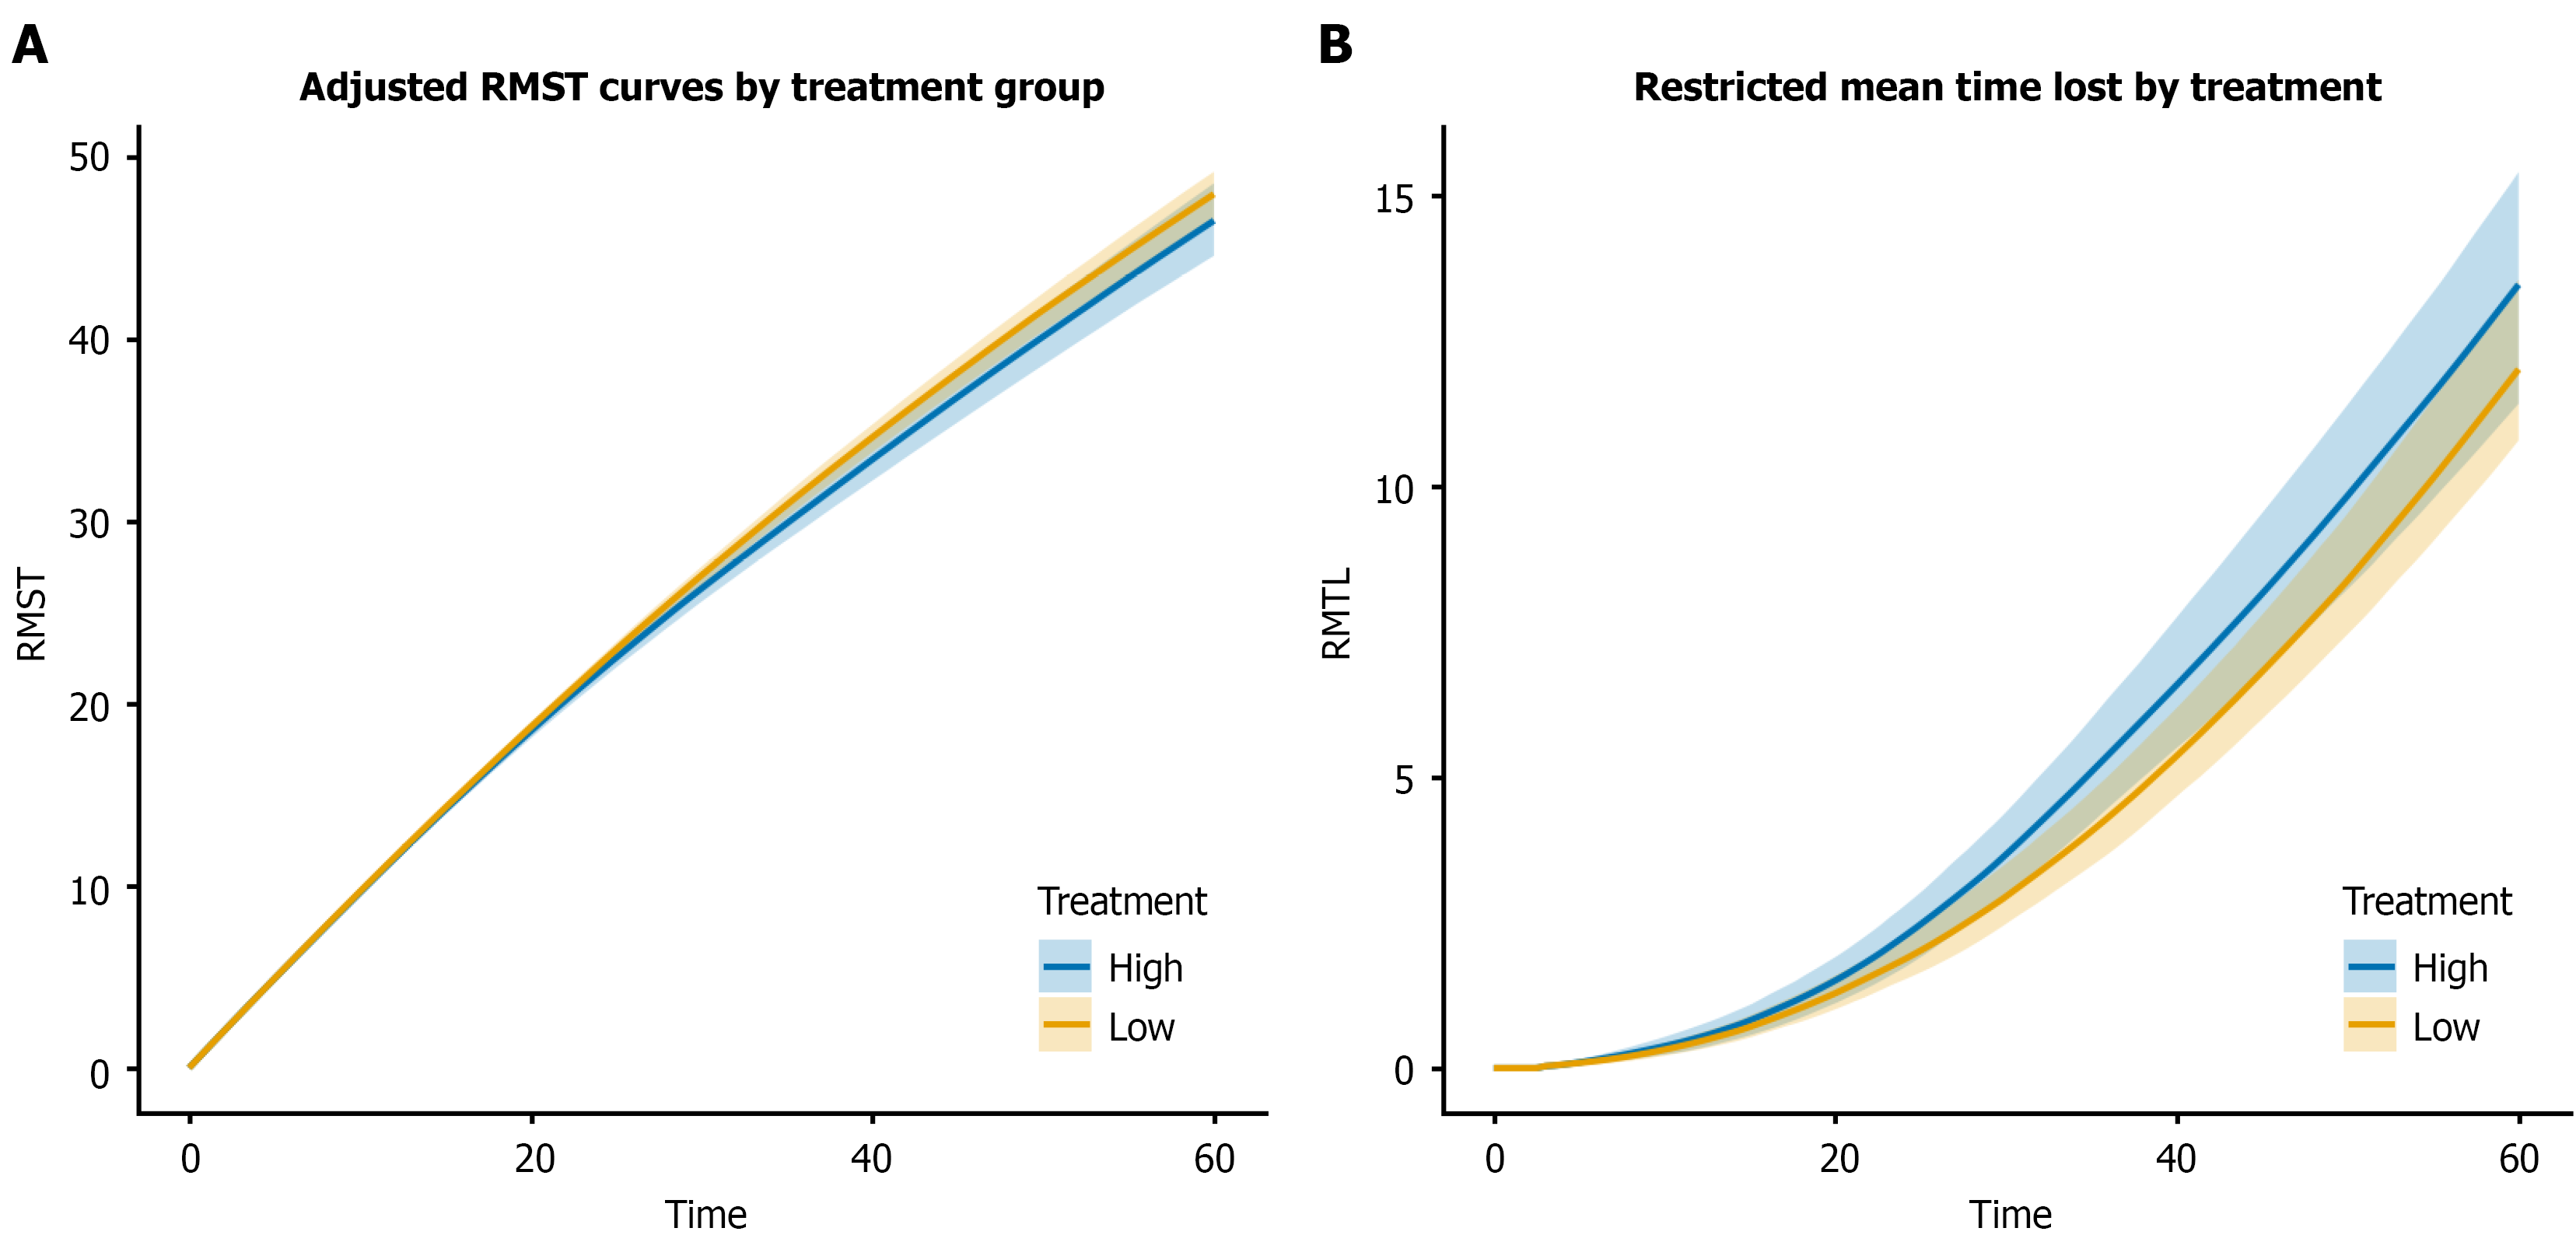
Figure 3 Restricted mean survival time and restricted mean time lost stratified by tissue Fusobacterium nucleatum expression.
A: Restricted mean survival time; B: Restricted mean time lost. RMST: Restricted mean survival time; RMTL: Restricted mean time lost.
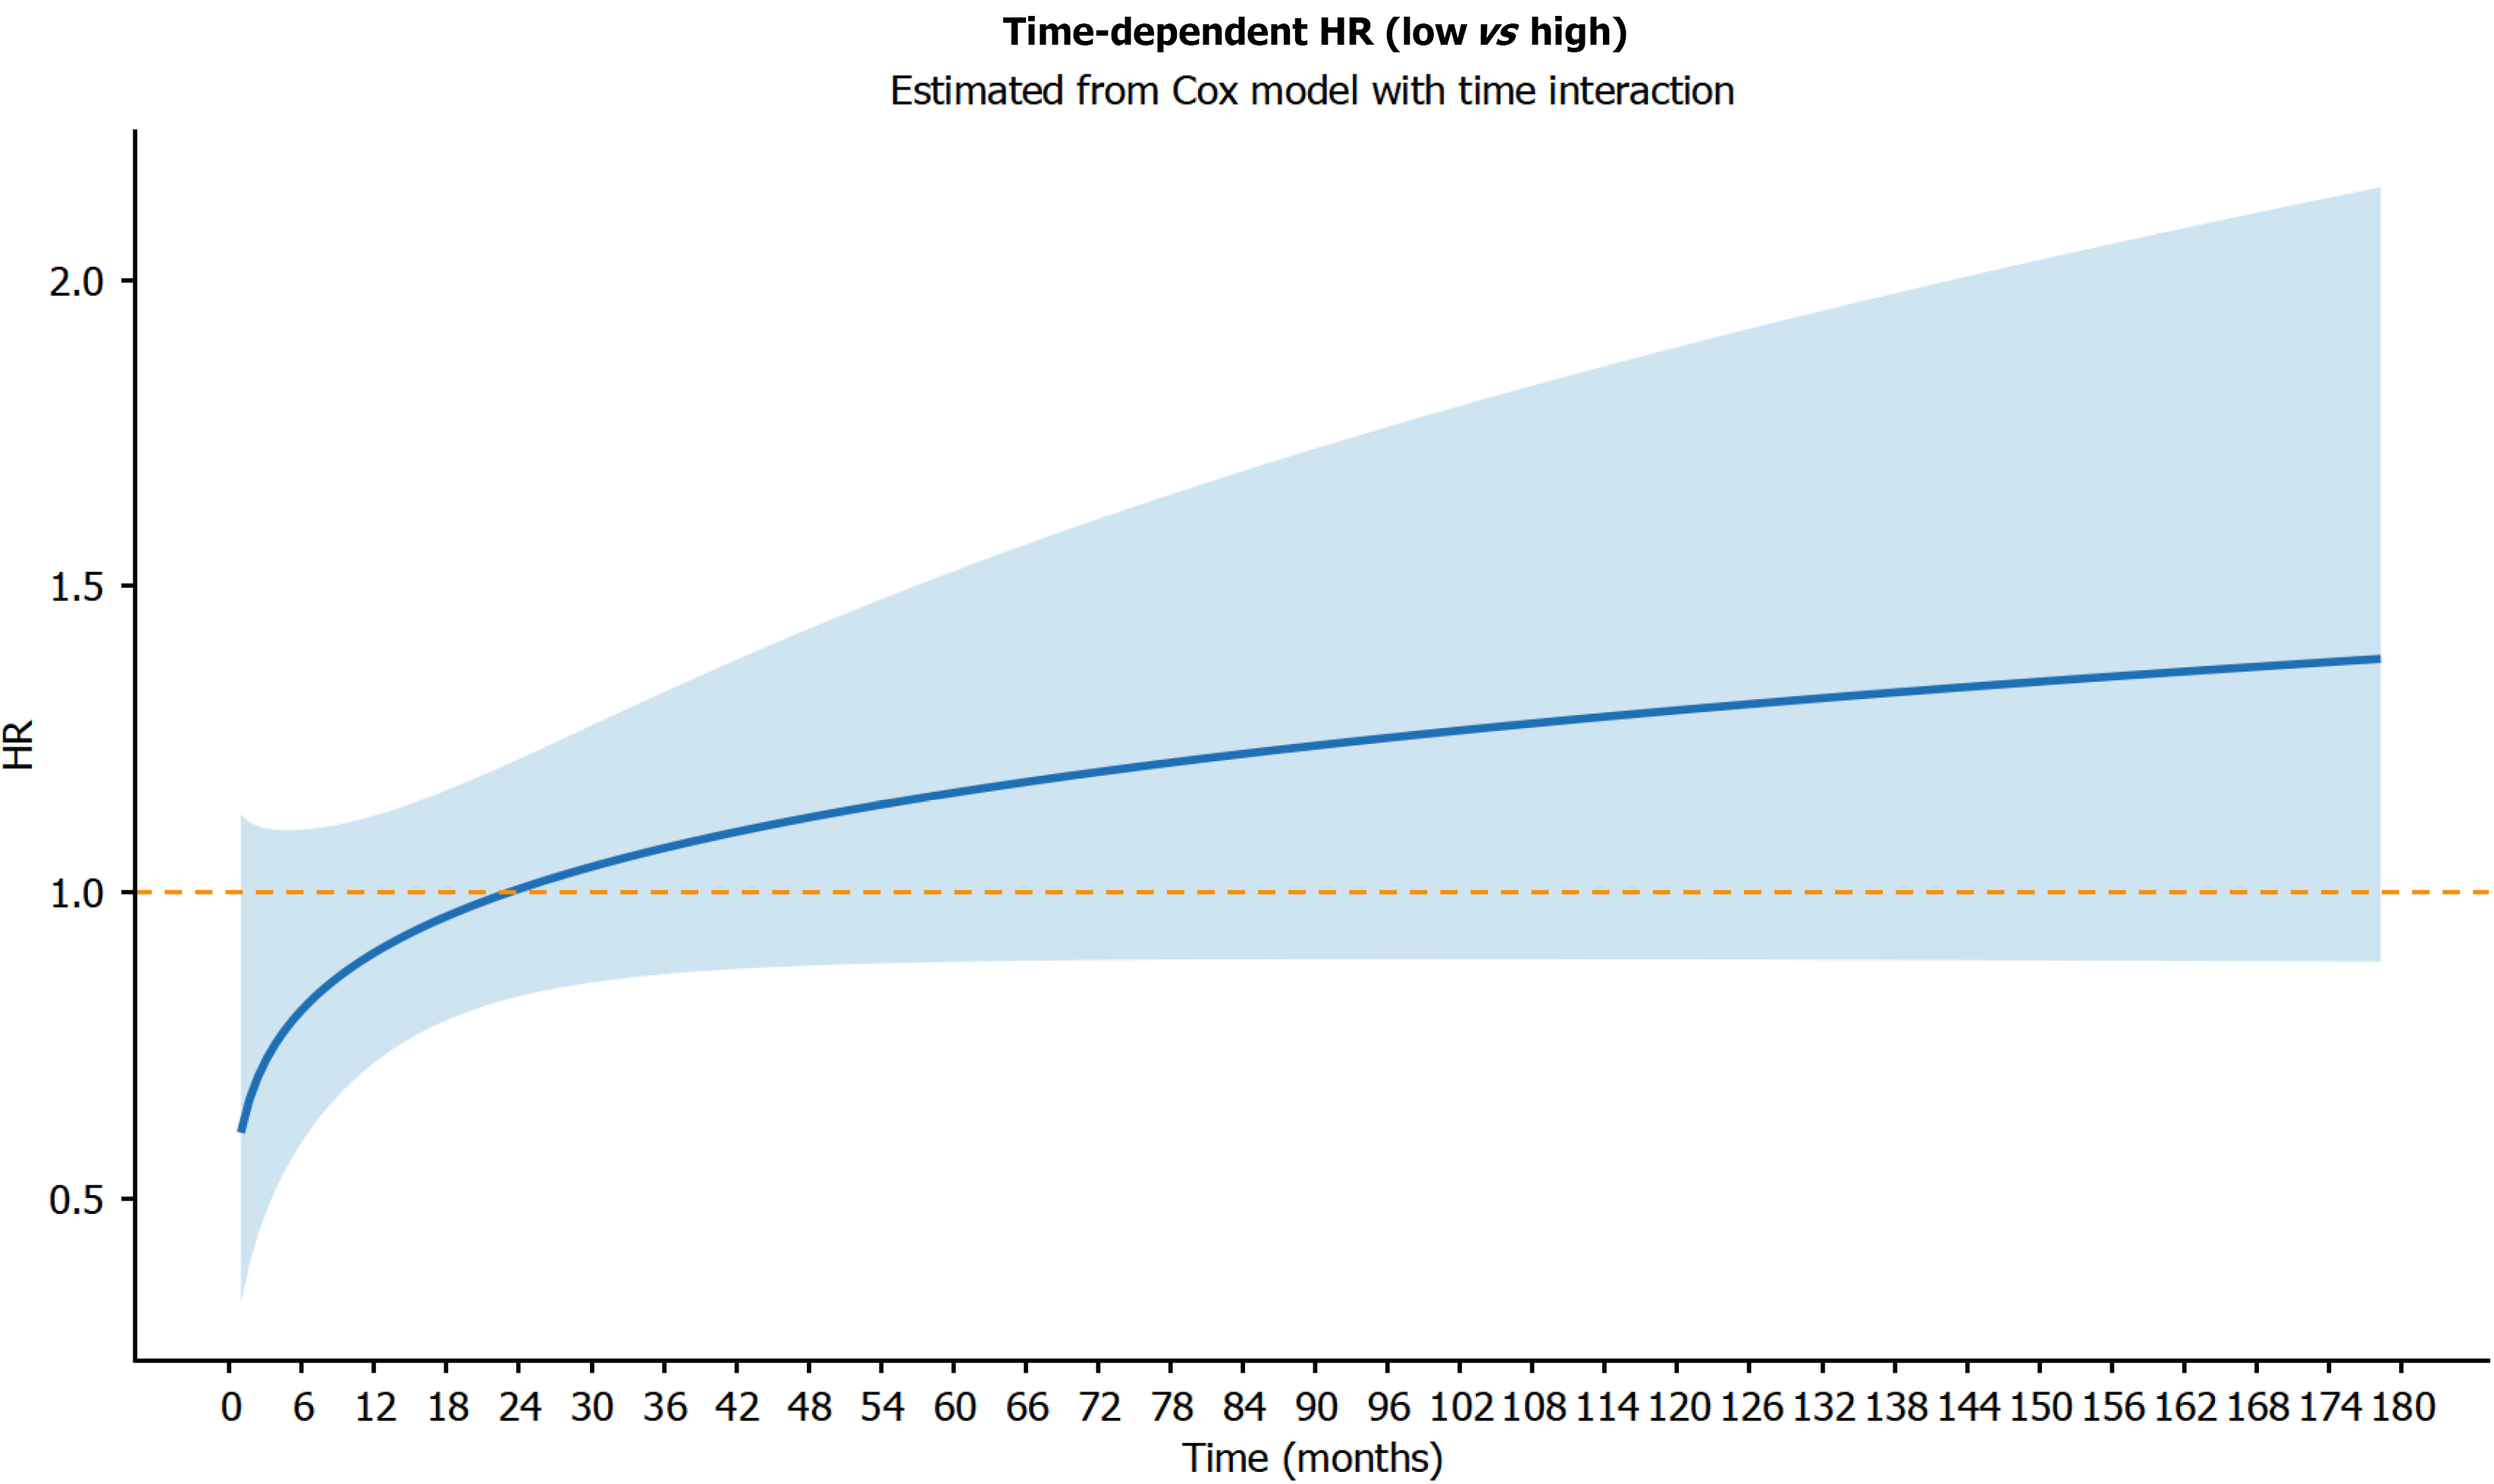
Figure 4 Time-varying hazard ratios for overall survival based on flexible parametric survival models with B-splines.
HR: Hazard ratio.
- Citation: Liu YX, Chen ZH, Dou GJ, Lu JJ, Zhou Y. Prognostic significance of Fusobacterium nucleatum in colorectal cancer using reconstructed survival data. World J Gastrointest Oncol 2026; 18(10): 121850
- URL: https://www.wjgnet.com/1948-5204/full/v18/i10/121850.htm
- DOI: https://dx.doi.org/10.4251/wjgo.121850