Copyright
©The Author(s) 2025.
World J Gastrointest Oncol. May 15, 2025; 17(5): 105148
Published online May 15, 2025. doi: 10.4251/wjgo.v17.i5.105148
Published online May 15, 2025. doi: 10.4251/wjgo.v17.i5.105148
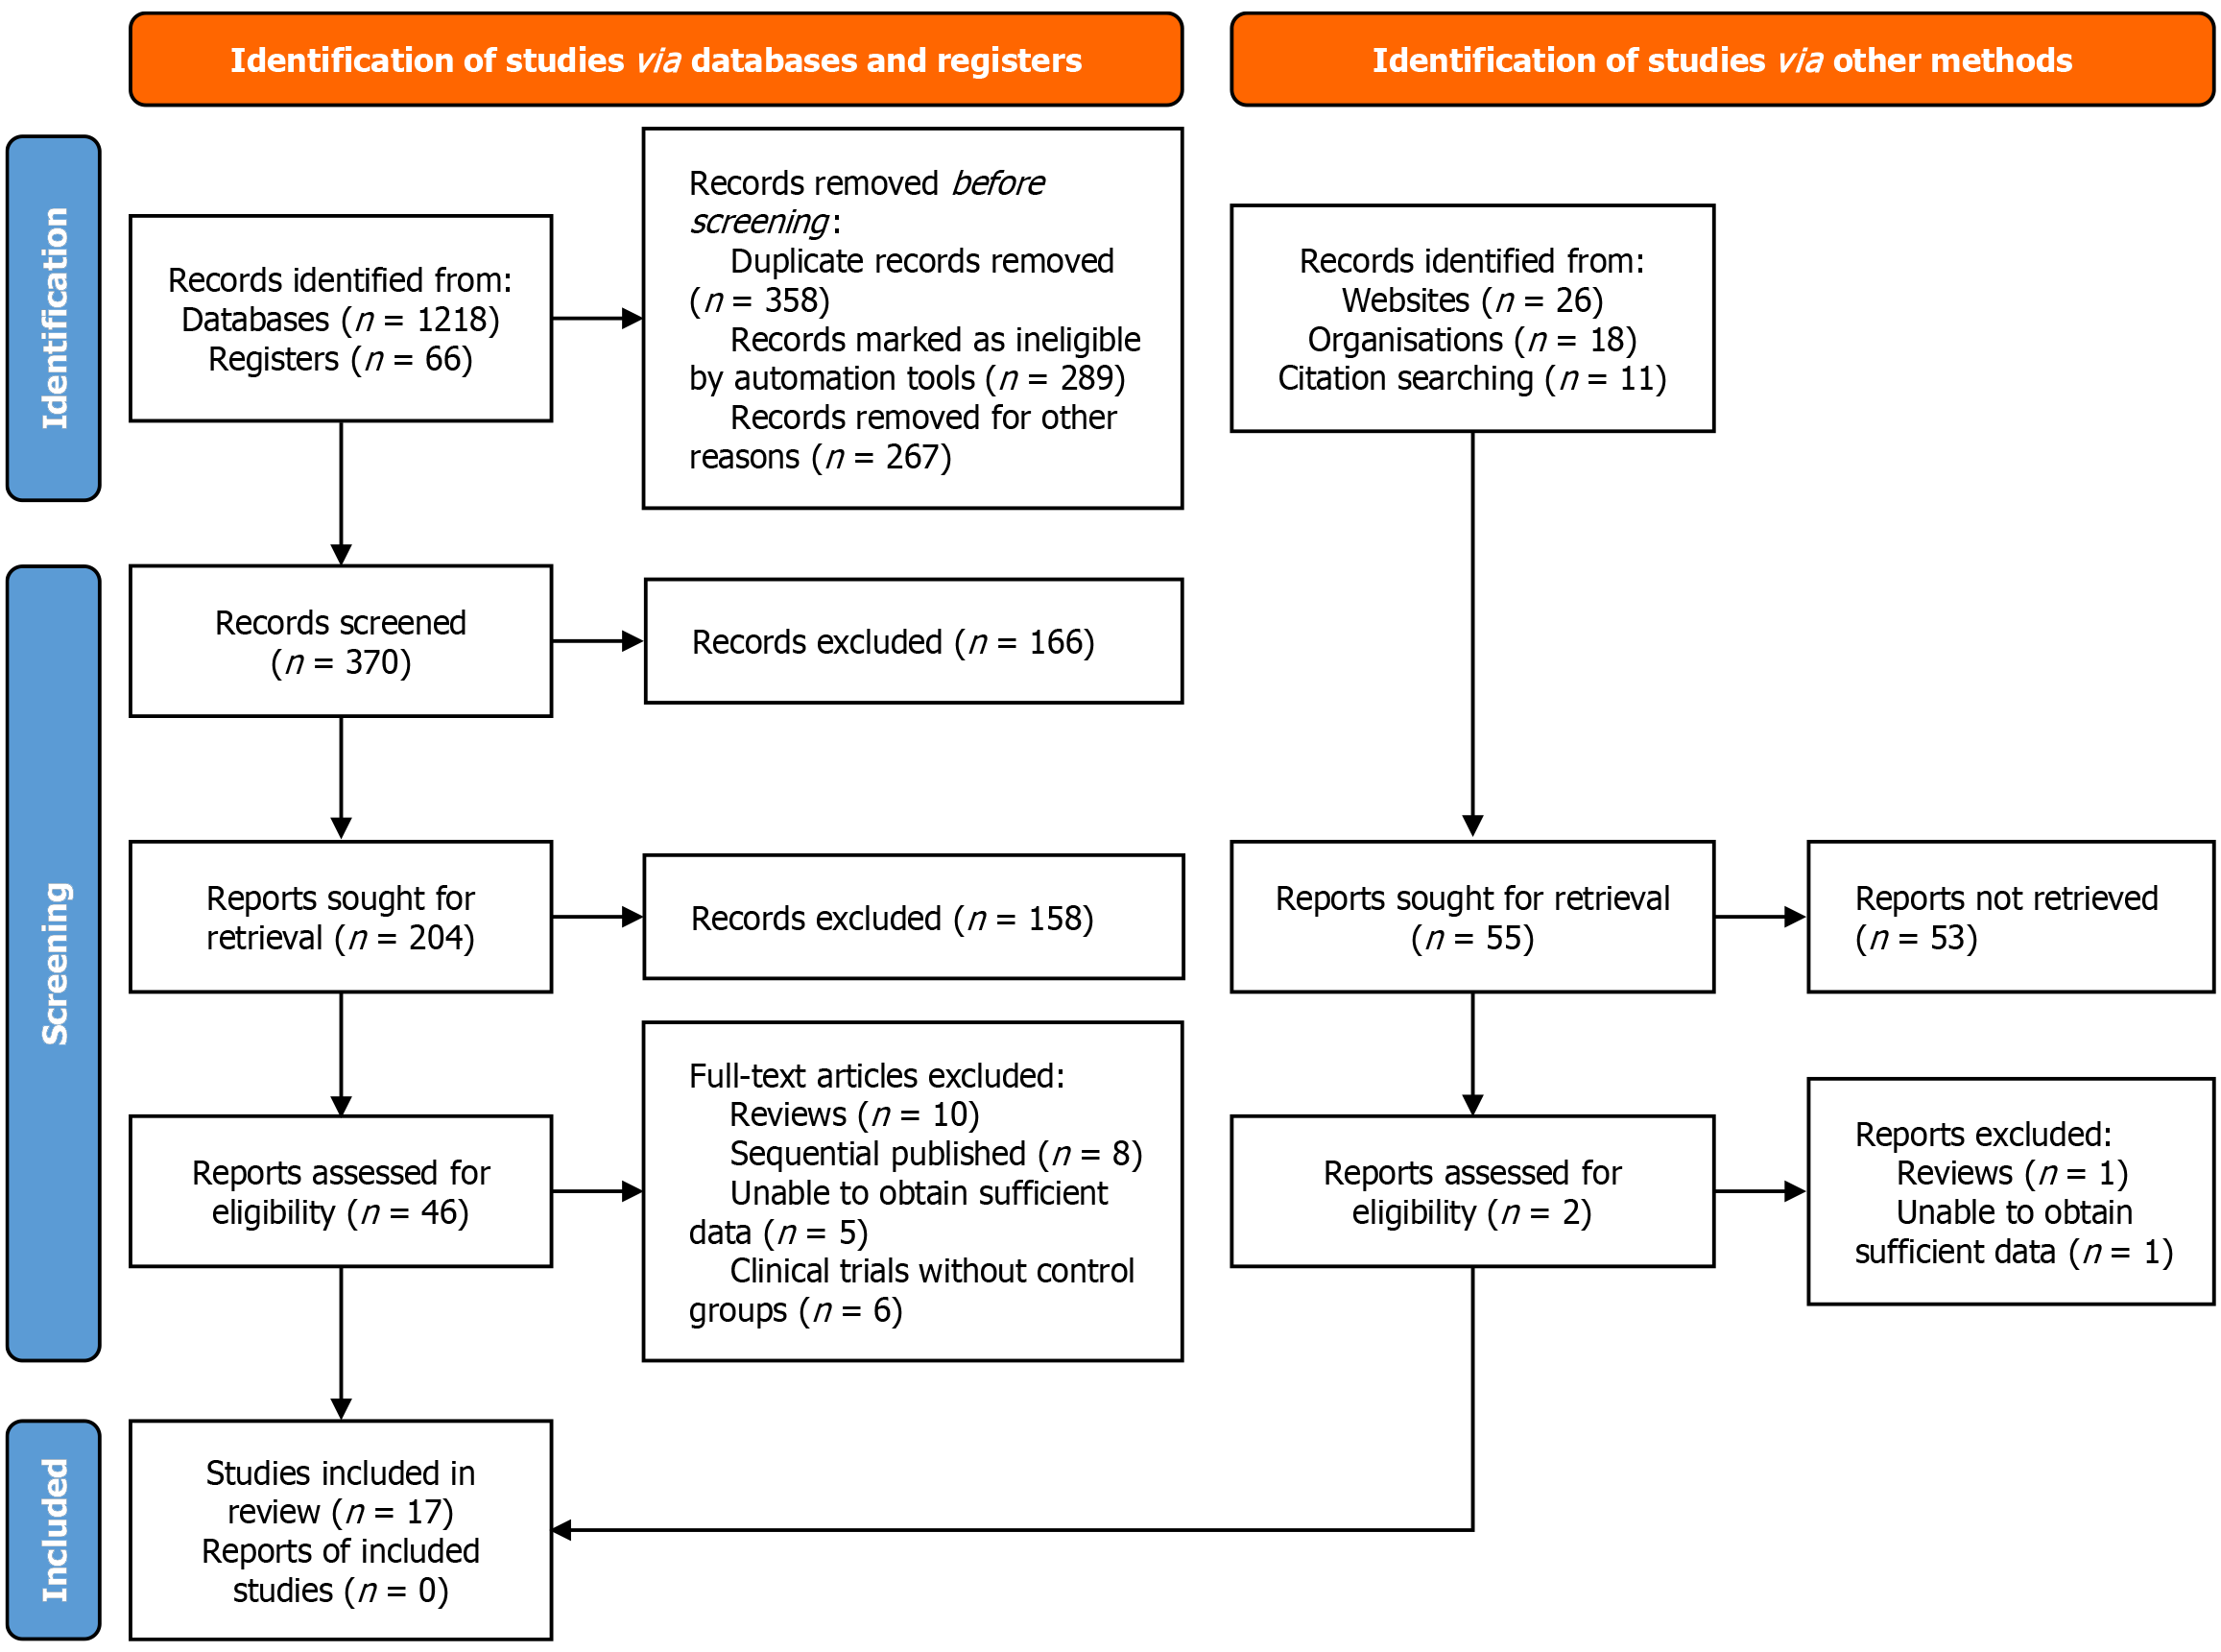
Figure 1
Flowchart showing the process of study selection for inclusion in the meta-analysis.
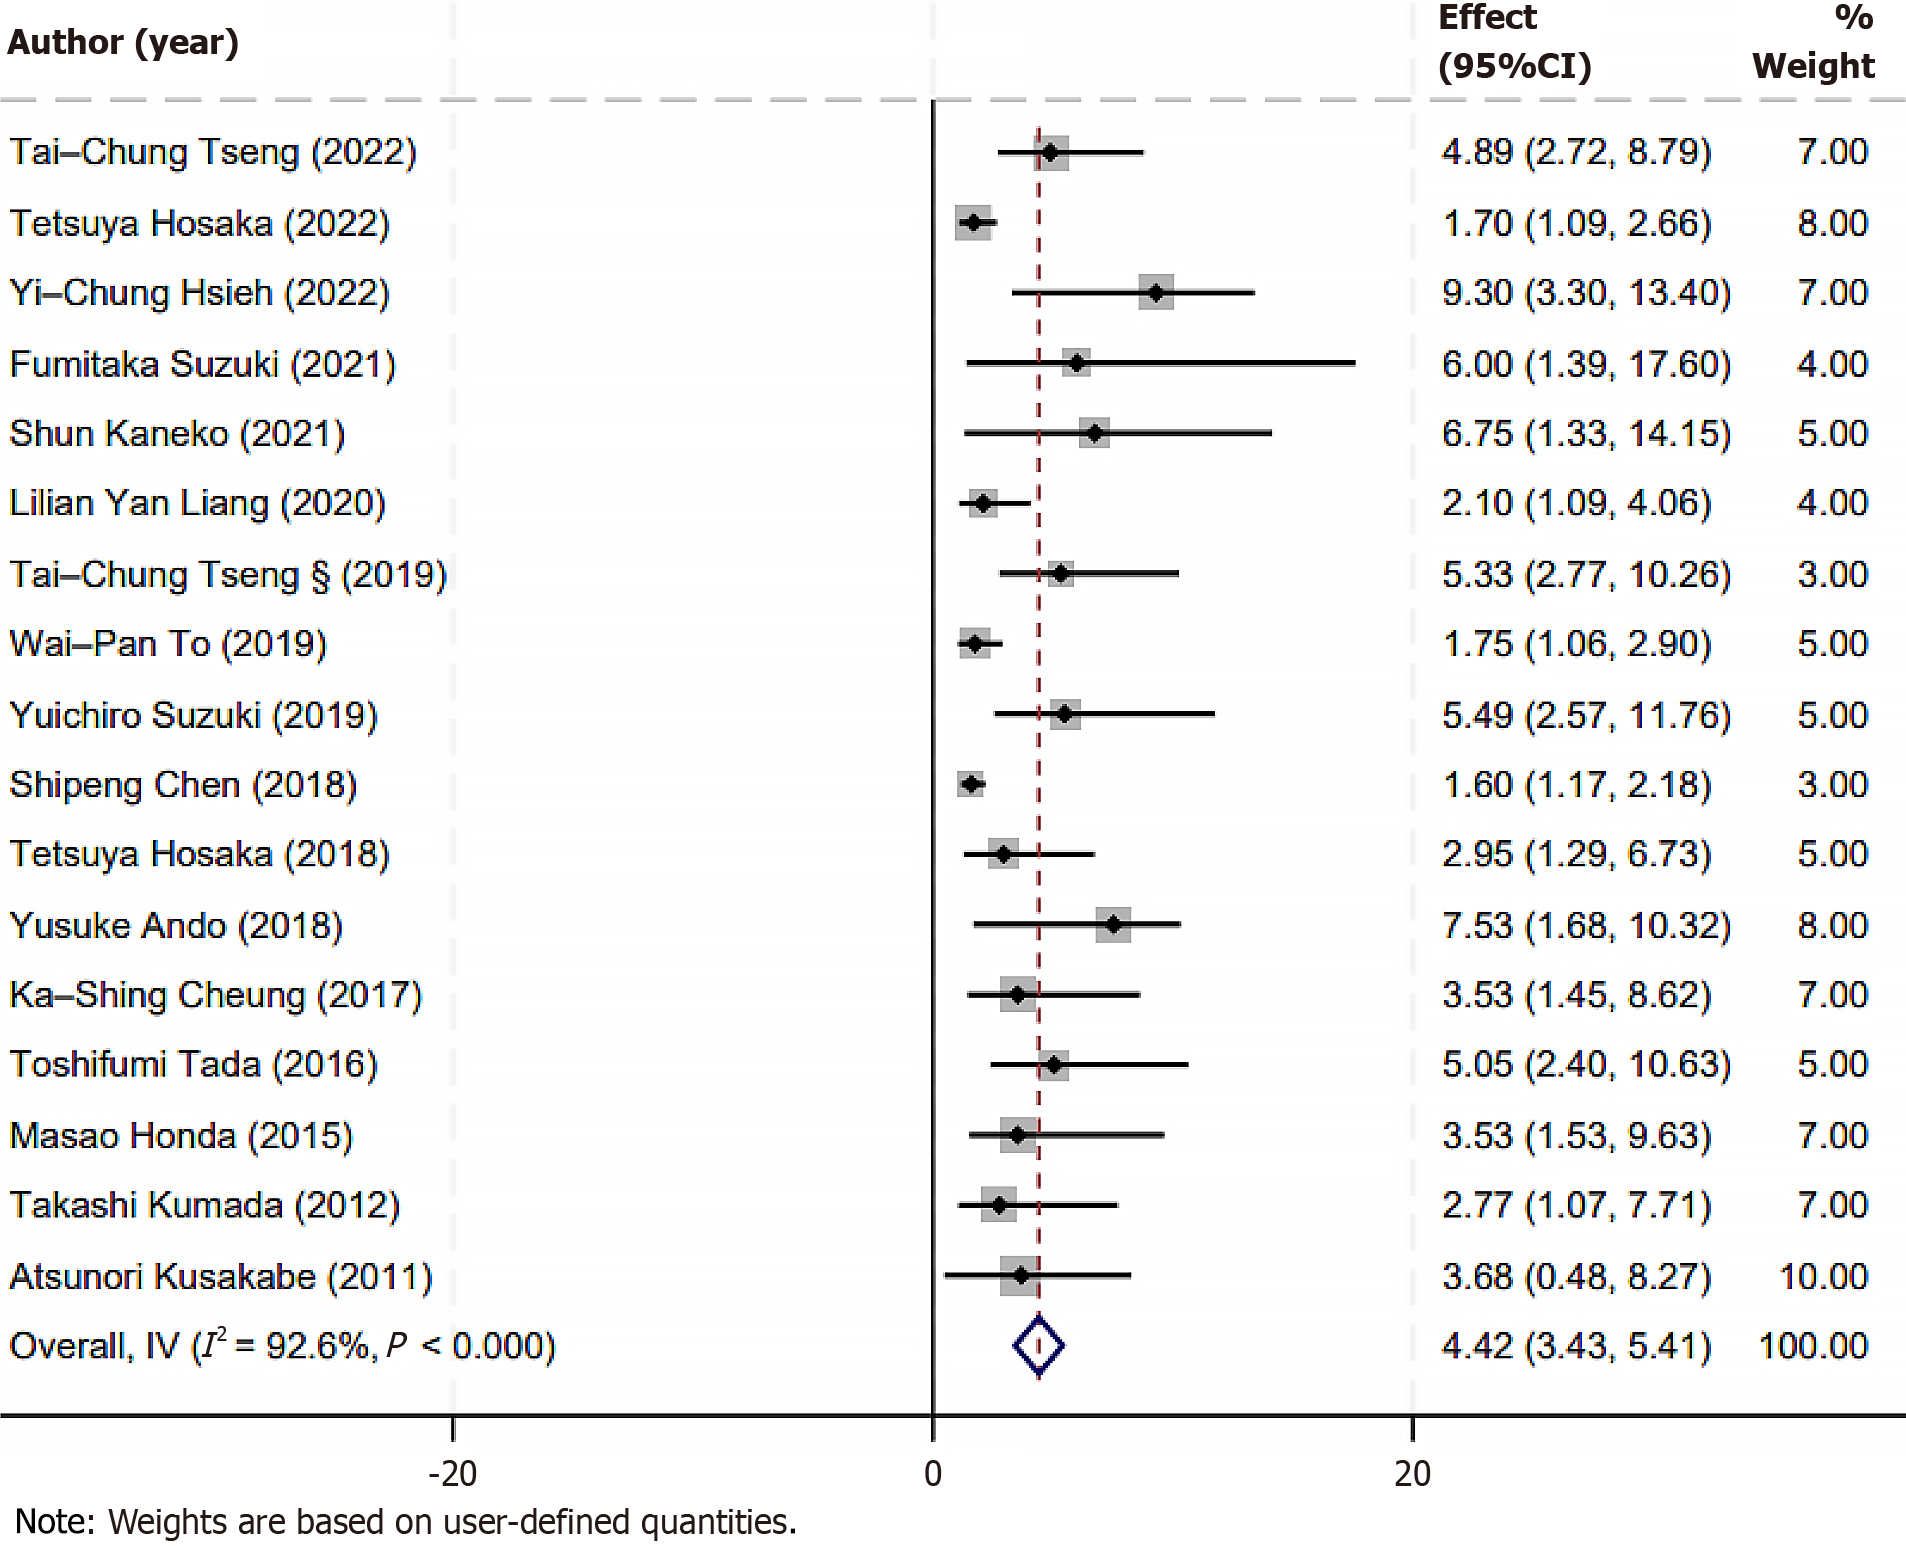
Figure 2 Forest plot displaying the association between hepatitis B core-related antigen and recurrence of primary hepatocellular carcinoma.
CI: Confidence interval.
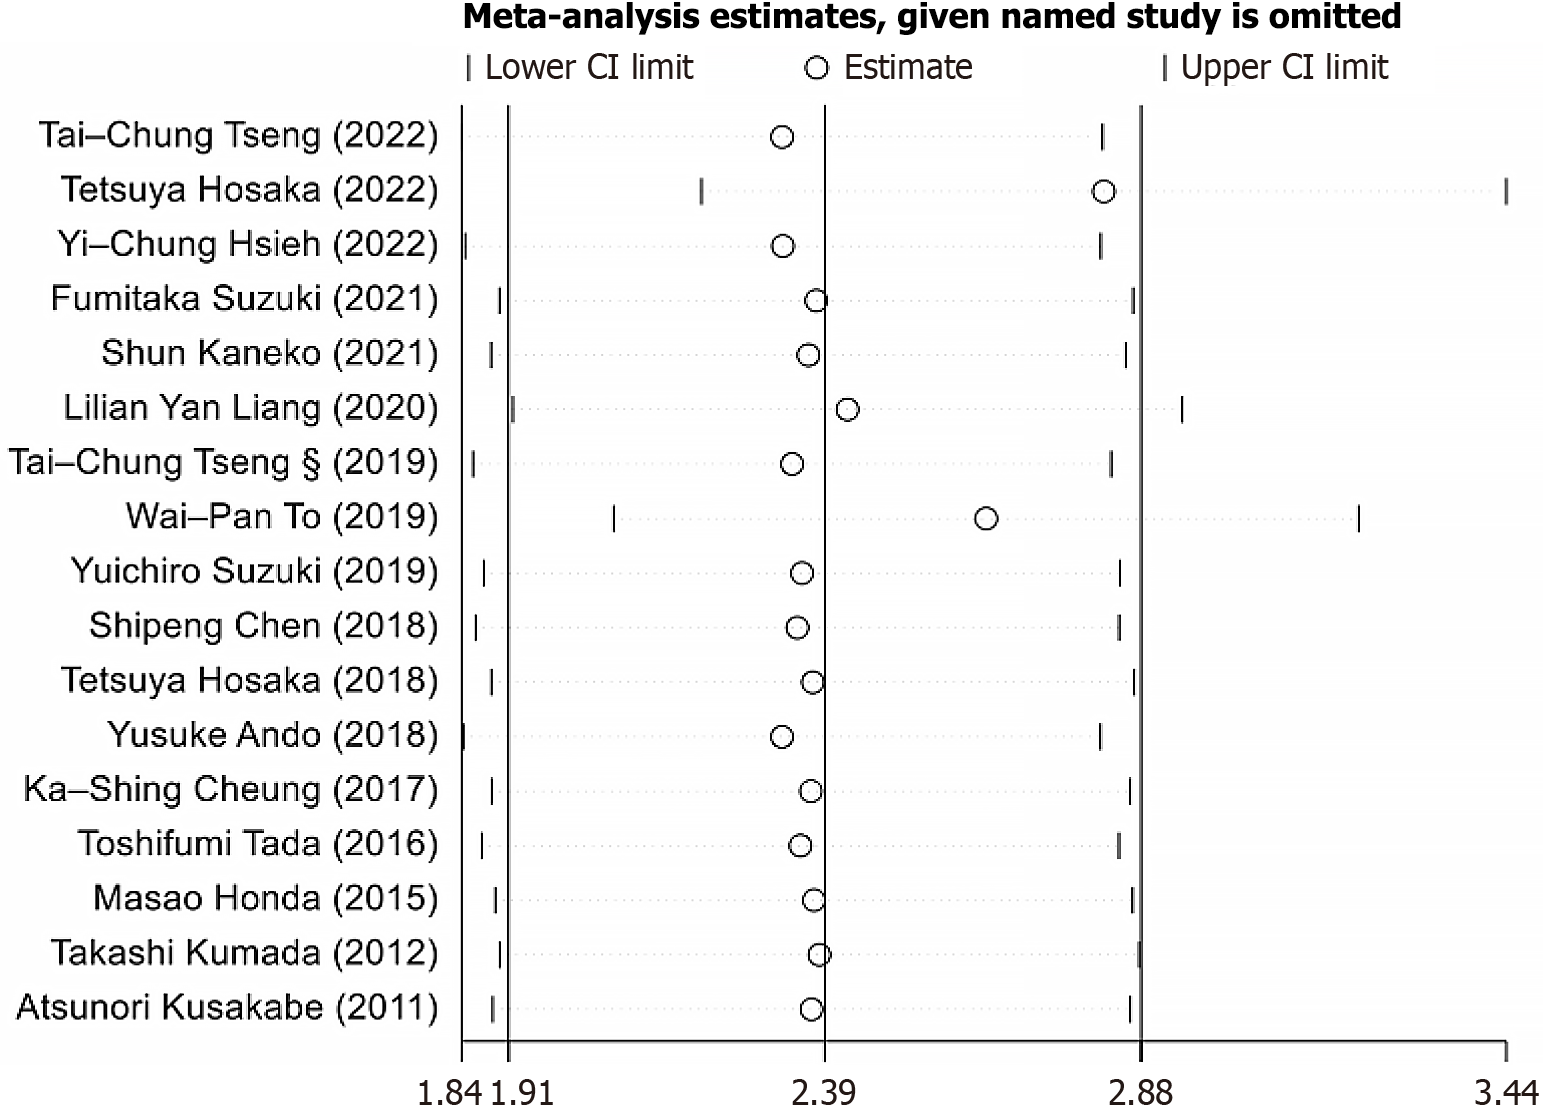
Figure 3 Sensitivity analysis graph evaluating the stability of the meta-analysis findings.
CI: Confidence interval.
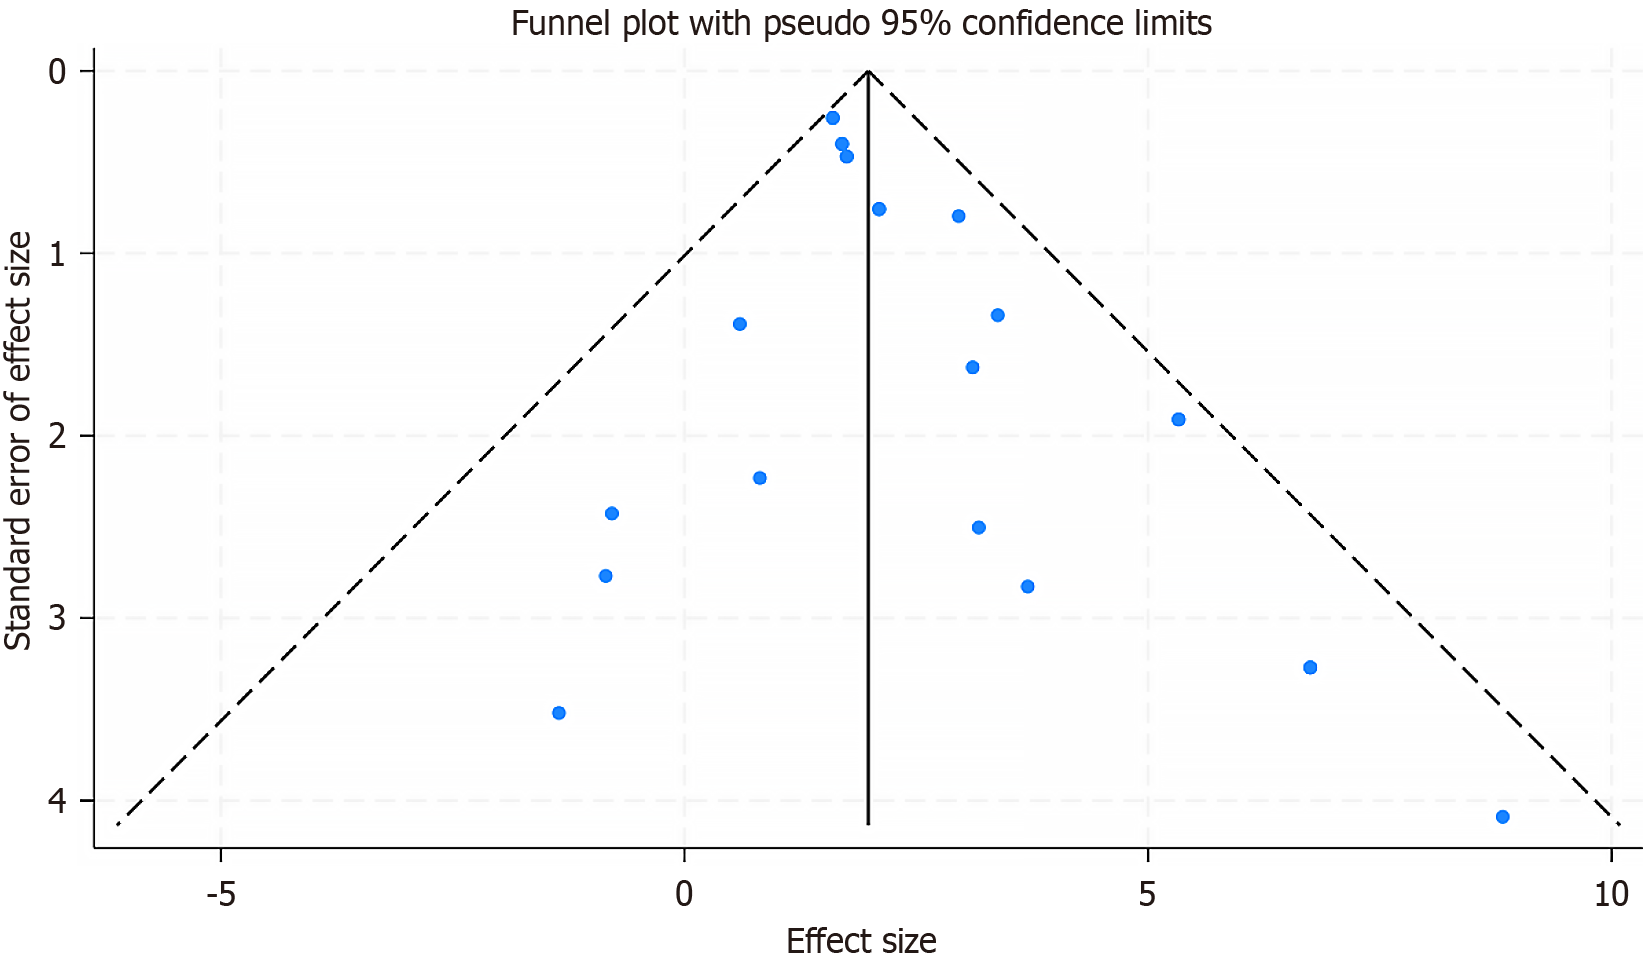
Figure 4
Funnel plot assessing the presence of publication bias among studies included in the meta-analysis.
- Citation: Liang LB, Zhang HJ, Liu F, Su QL. Hepatitis B core-related antigen as a predictive biomarker for recurrence in primary hepatocellular carcinoma: A meta-analysis. World J Gastrointest Oncol 2025; 17(5): 105148
- URL: https://www.wjgnet.com/1948-5204/full/v17/i5/105148.htm
- DOI: https://dx.doi.org/10.4251/wjgo.v17.i5.105148


