Copyright
©The Author(s) 2024.
World J Gastrointest Oncol. Feb 15, 2024; 16(2): 493-513
Published online Feb 15, 2024. doi: 10.4251/wjgo.v16.i2.493
Published online Feb 15, 2024. doi: 10.4251/wjgo.v16.i2.493
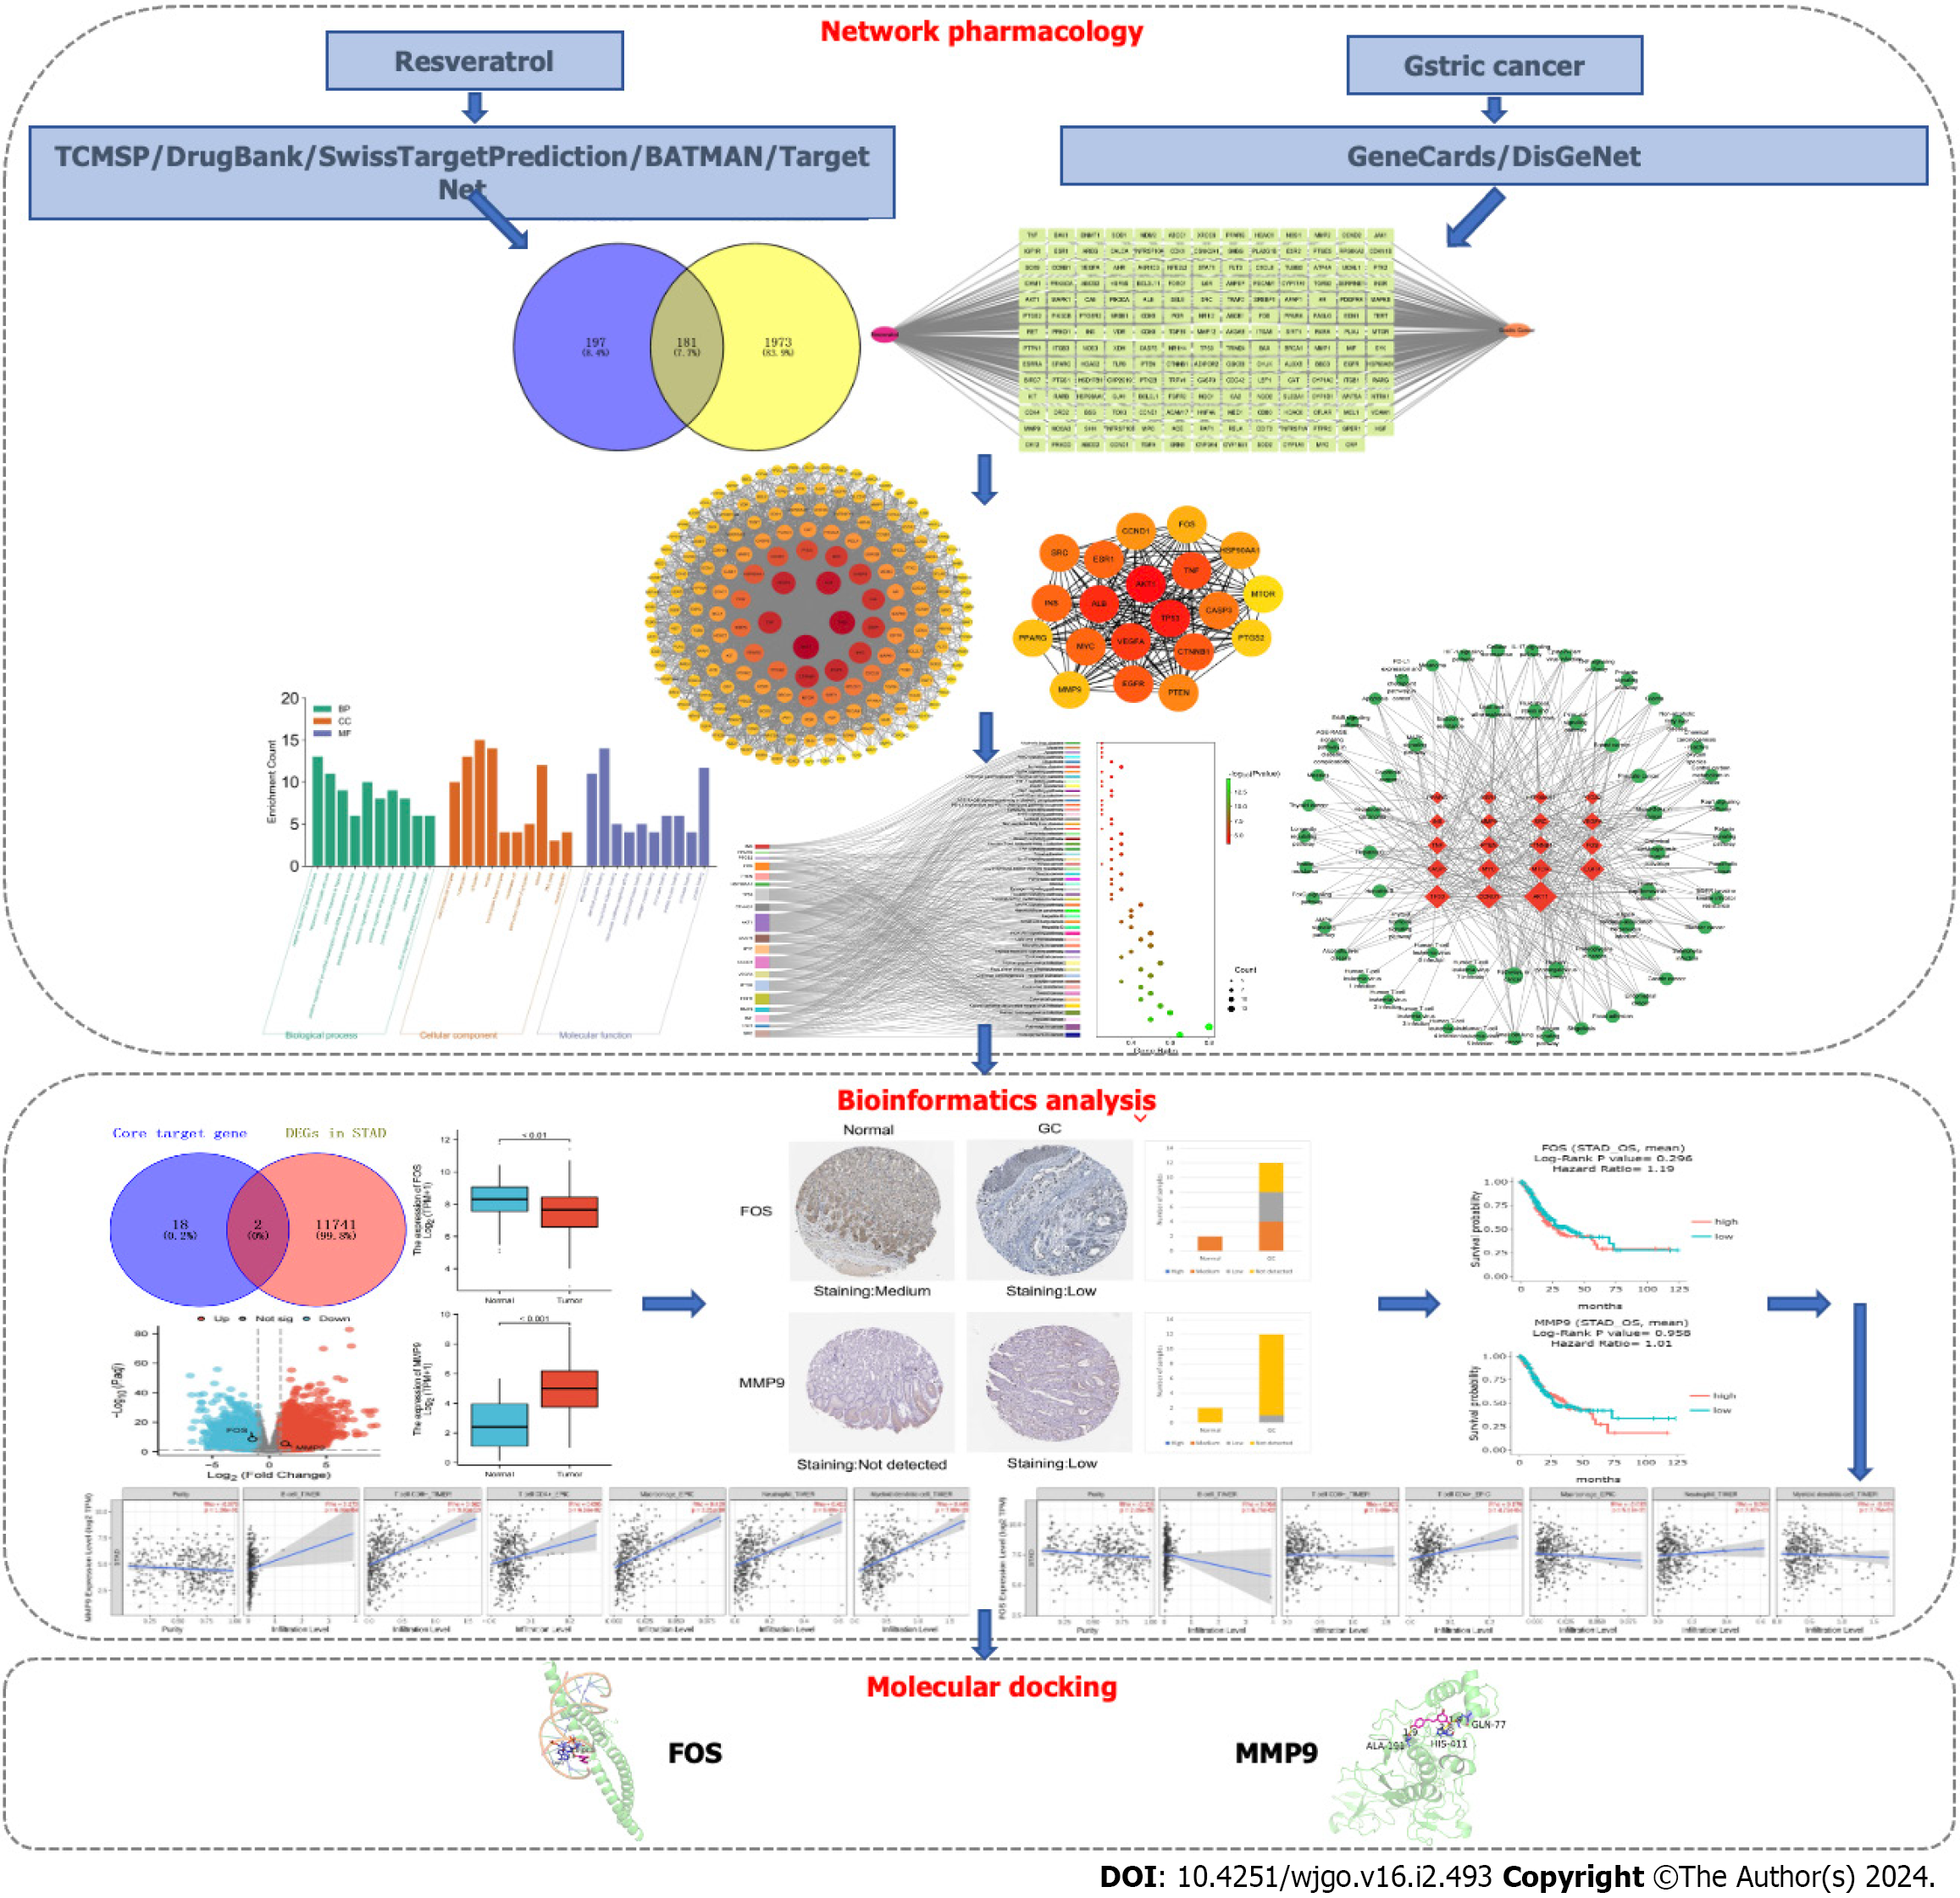
Figure 1 The overall frame diagram of network analysis in this study.
TCMSP: Traditional Chinese medicine systems pharmacology database and analysis platform; GC: Gastric cancer; DEGs: Differentially expressed genes; STAD: Stomach adenocarcinoma.
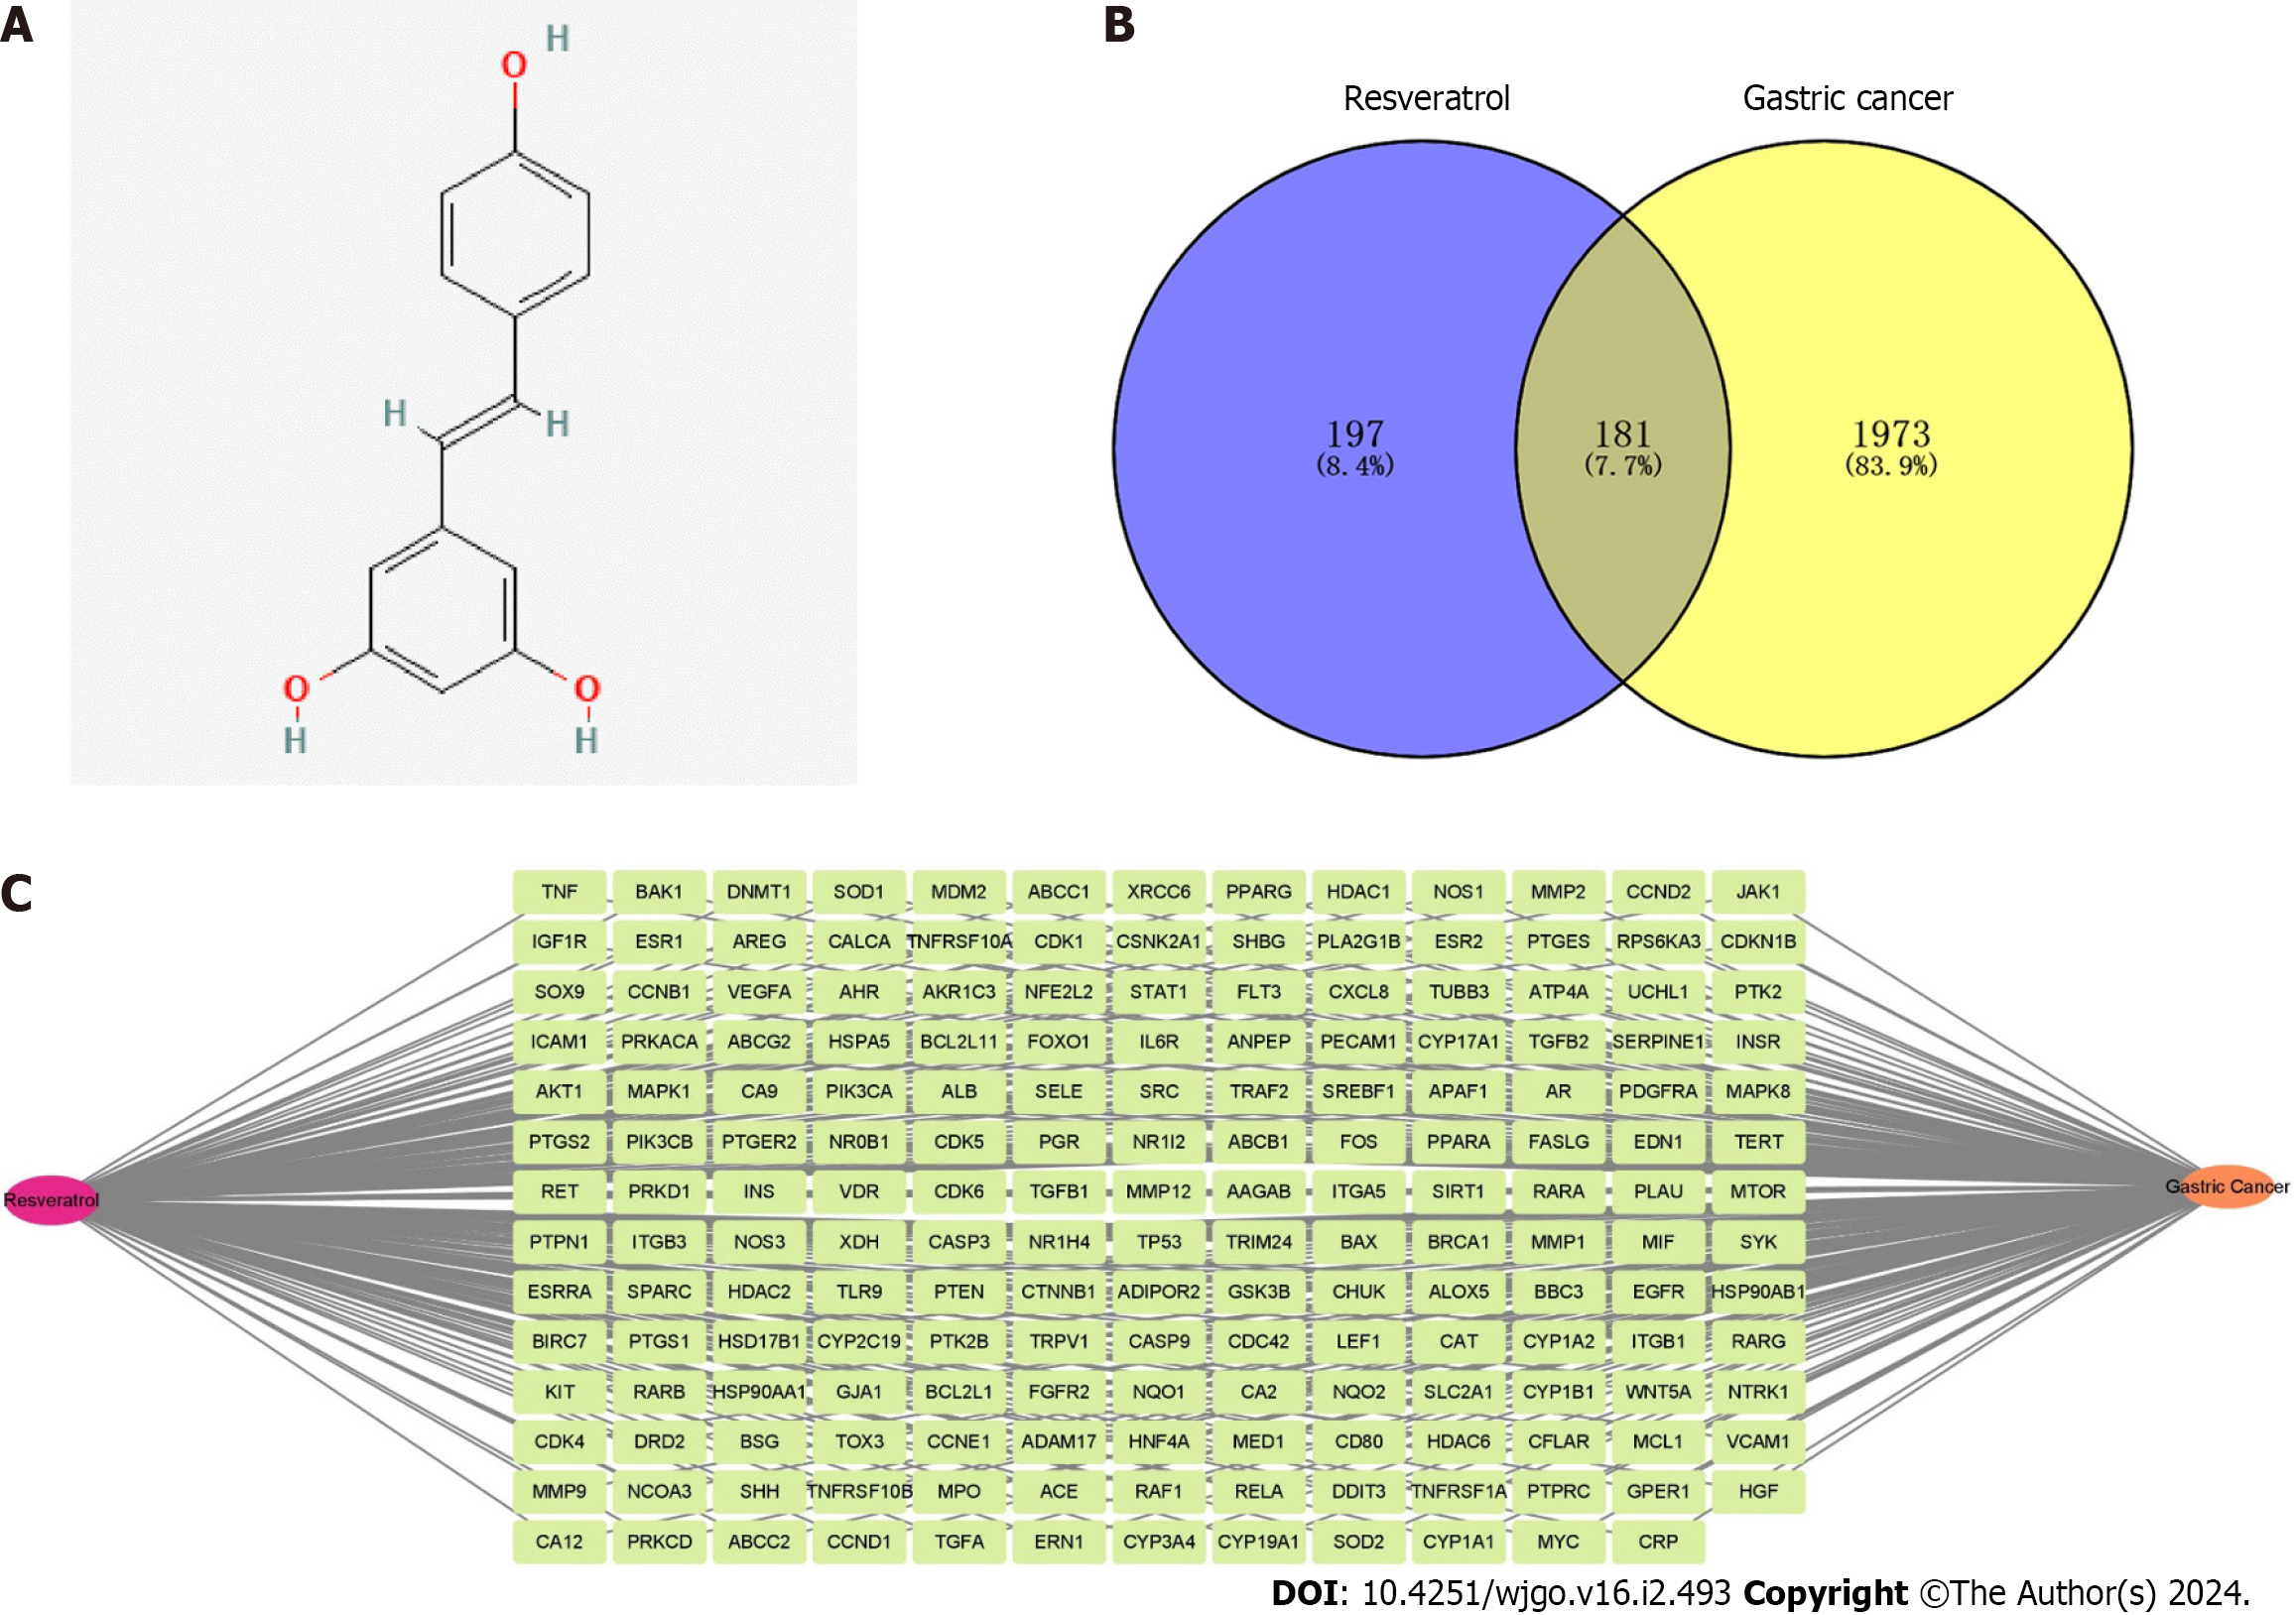
Figure 2 The target characteristics of resveratrol in gastric cancer revealed by network pharmacology.
A: Molecular structure of resveratrol; B: Venn diagram of intersection targets of resveratrol in gastric cancer (GC); C: The network construction of “Resveratrol-Target-GC”.
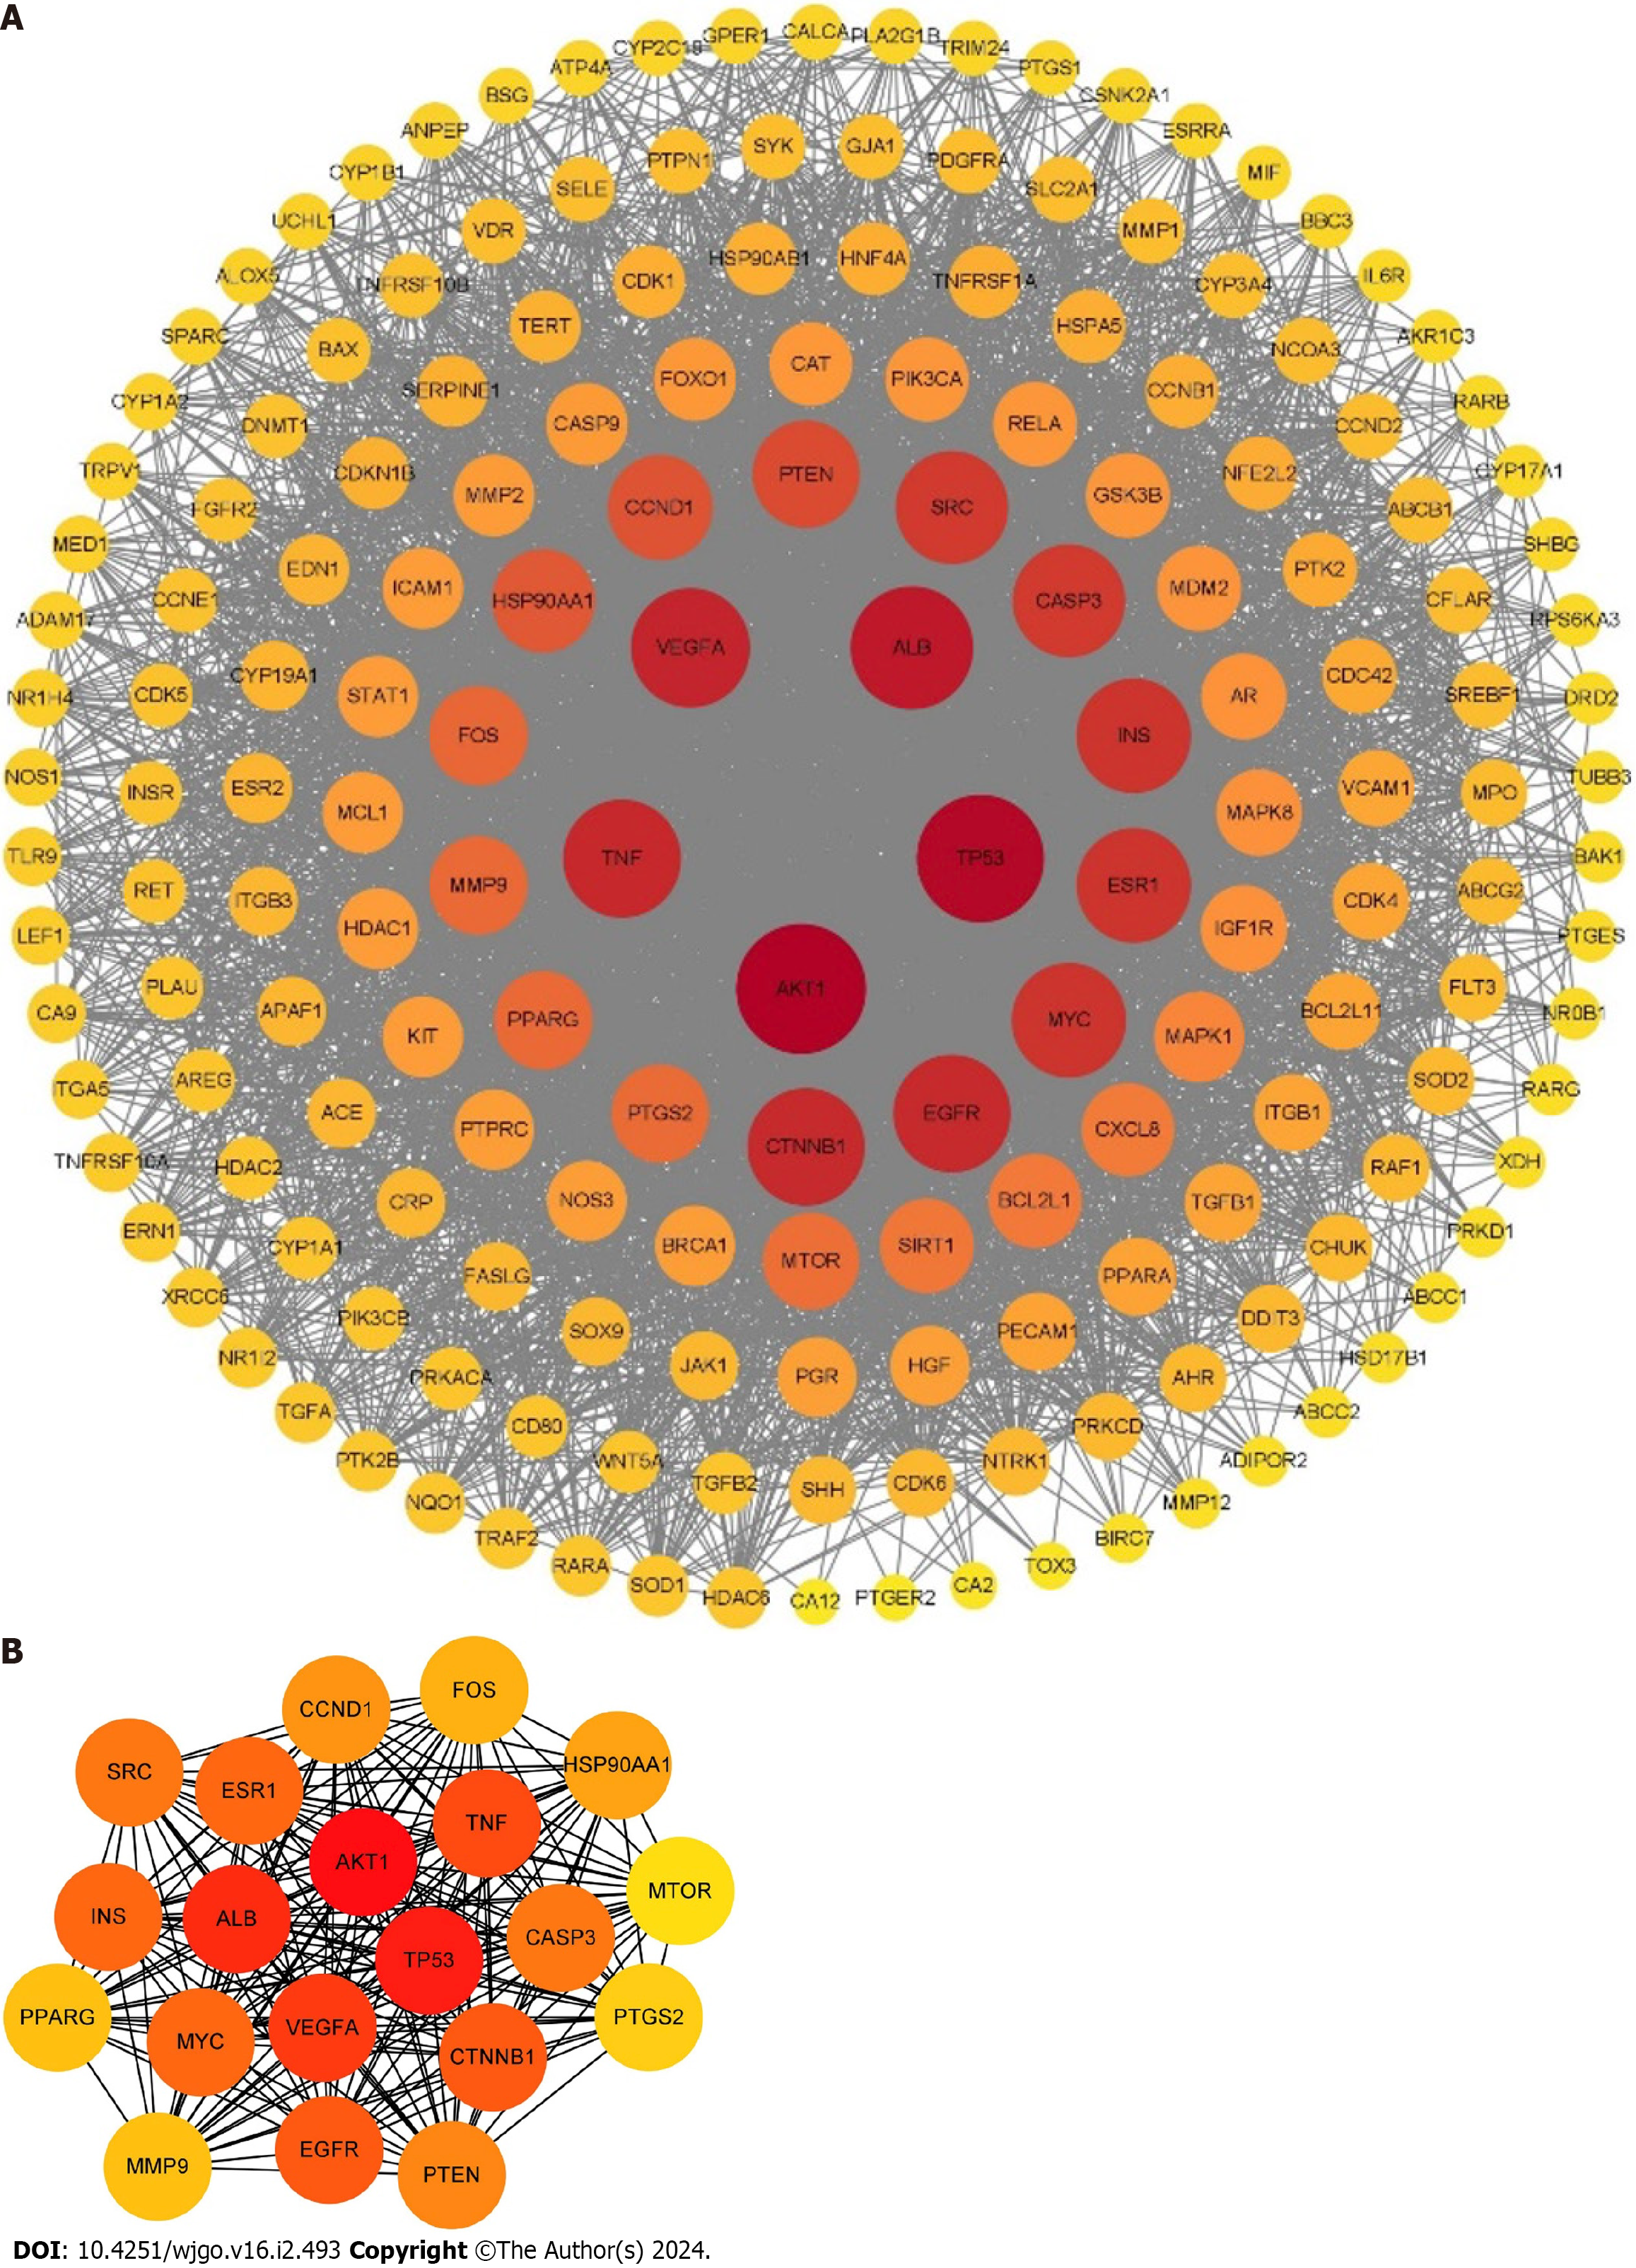
Figure 3 Protein-protein interaction network of resveratrol in the treatment of gastric cancer.
A: The protein-protein interaction network was constructed by Cytoscape 3.9.1; B: The core targets of resveratrol in gastric cancer were analyzed by the degree method. The node sizes and colors stand for the size of the degree. The depth of the node color is proportional to its degree. The larger the node size is, the larger the corresponding degree.
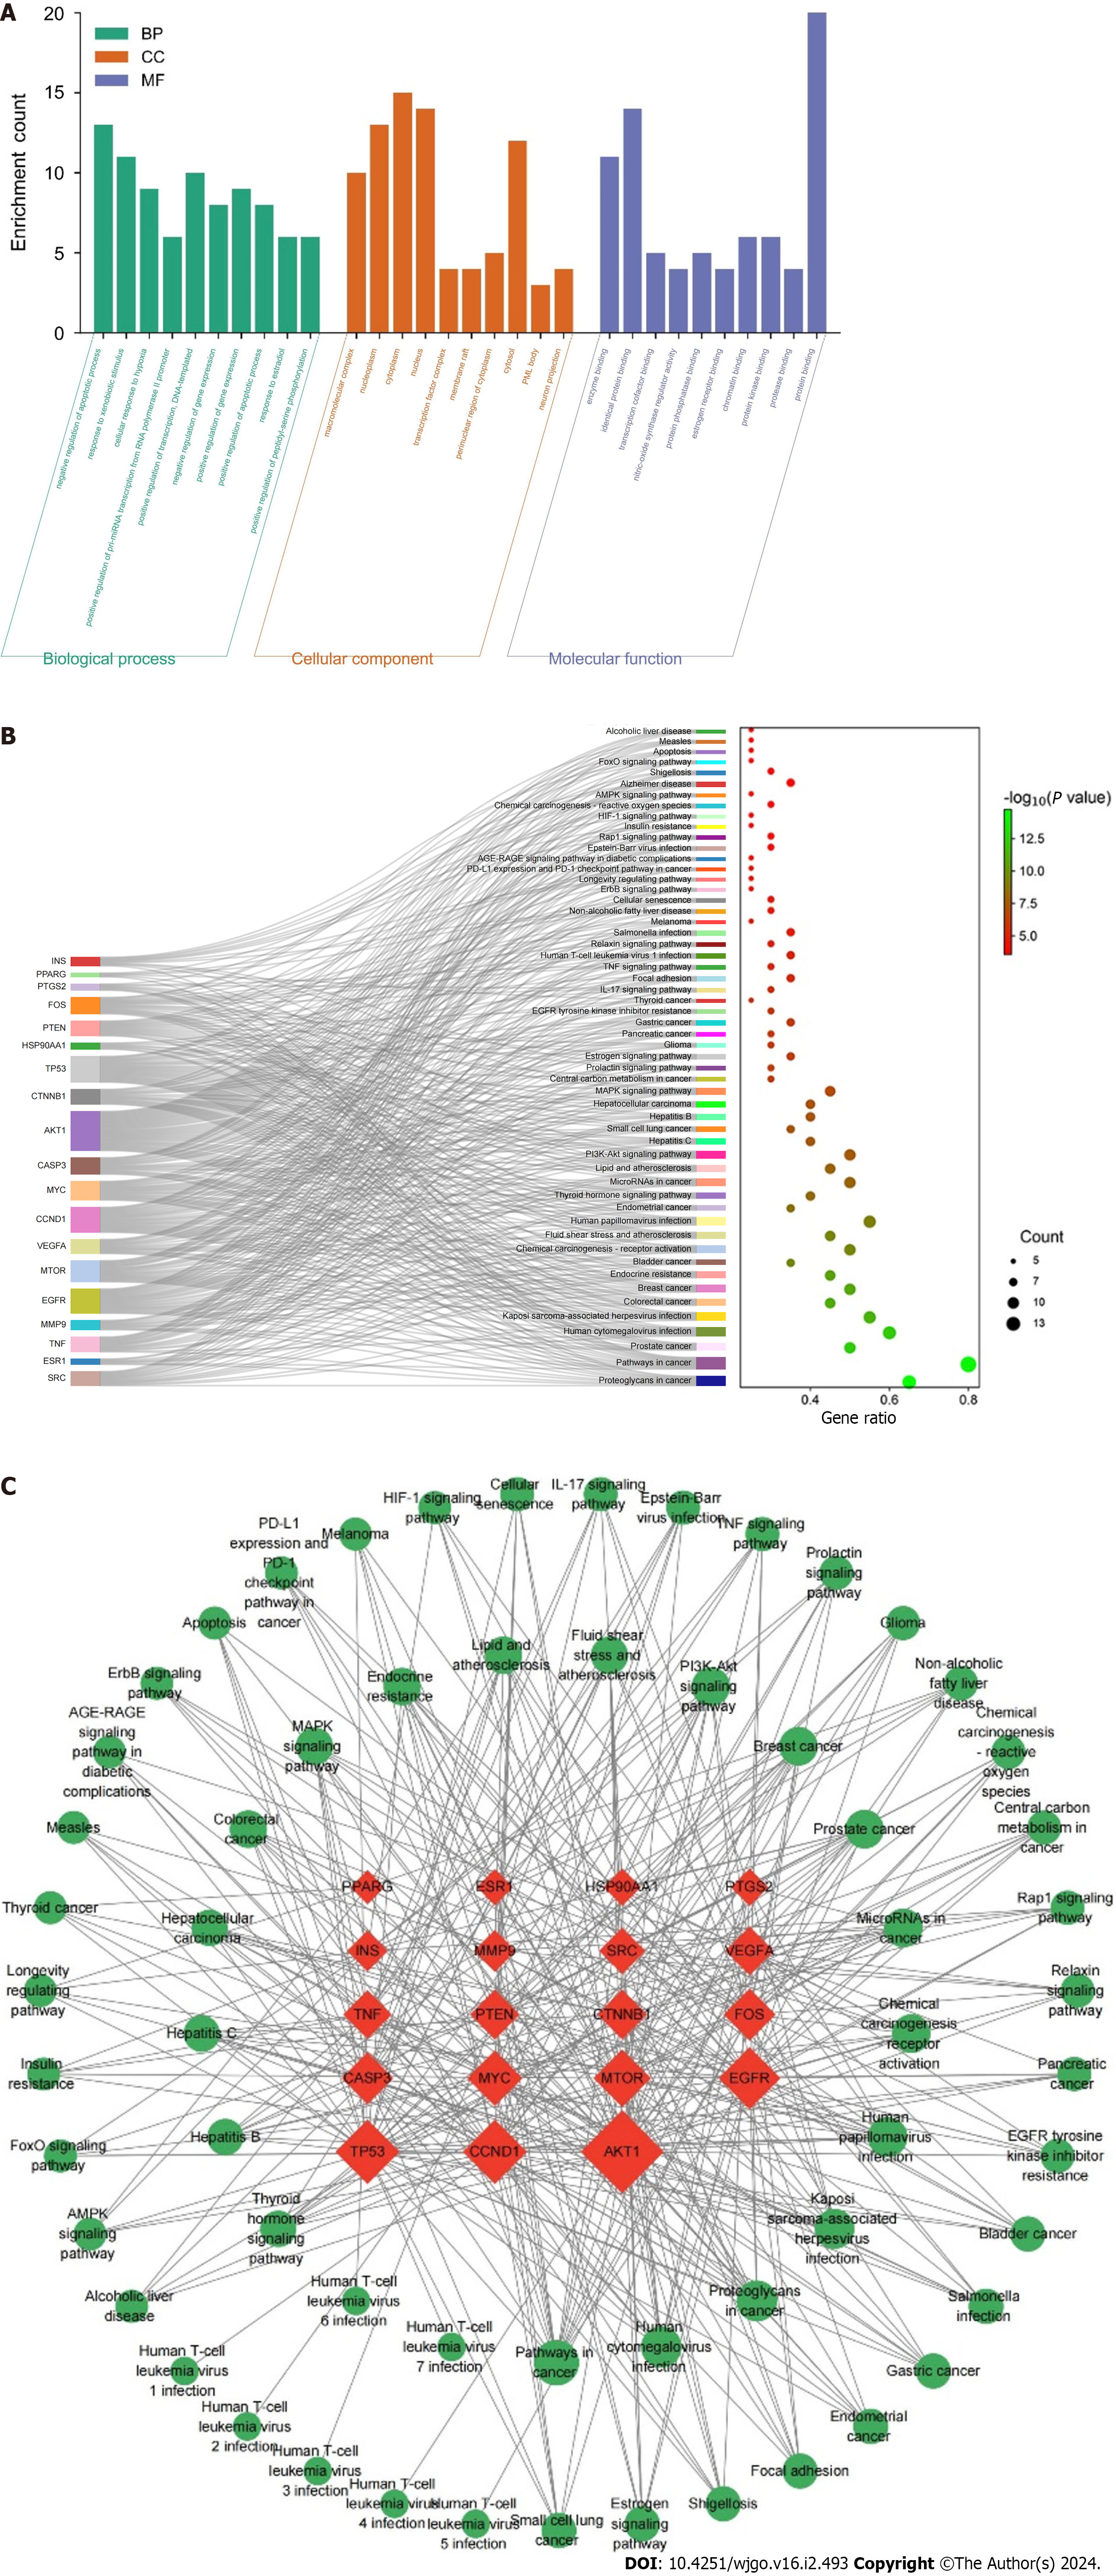
Figure 4 Enrichment analysis and construction of the “Target-Pathway” network.
A: Gene Ontology function analysis; B: Kyoto Encyclopedia of Genes and Genomes signaling pathway analysis; C: The “Target-Pathway” network of resveratrol against GC. The red nodes represent the core targets, and the green nodes are the pathways associated with core targets.
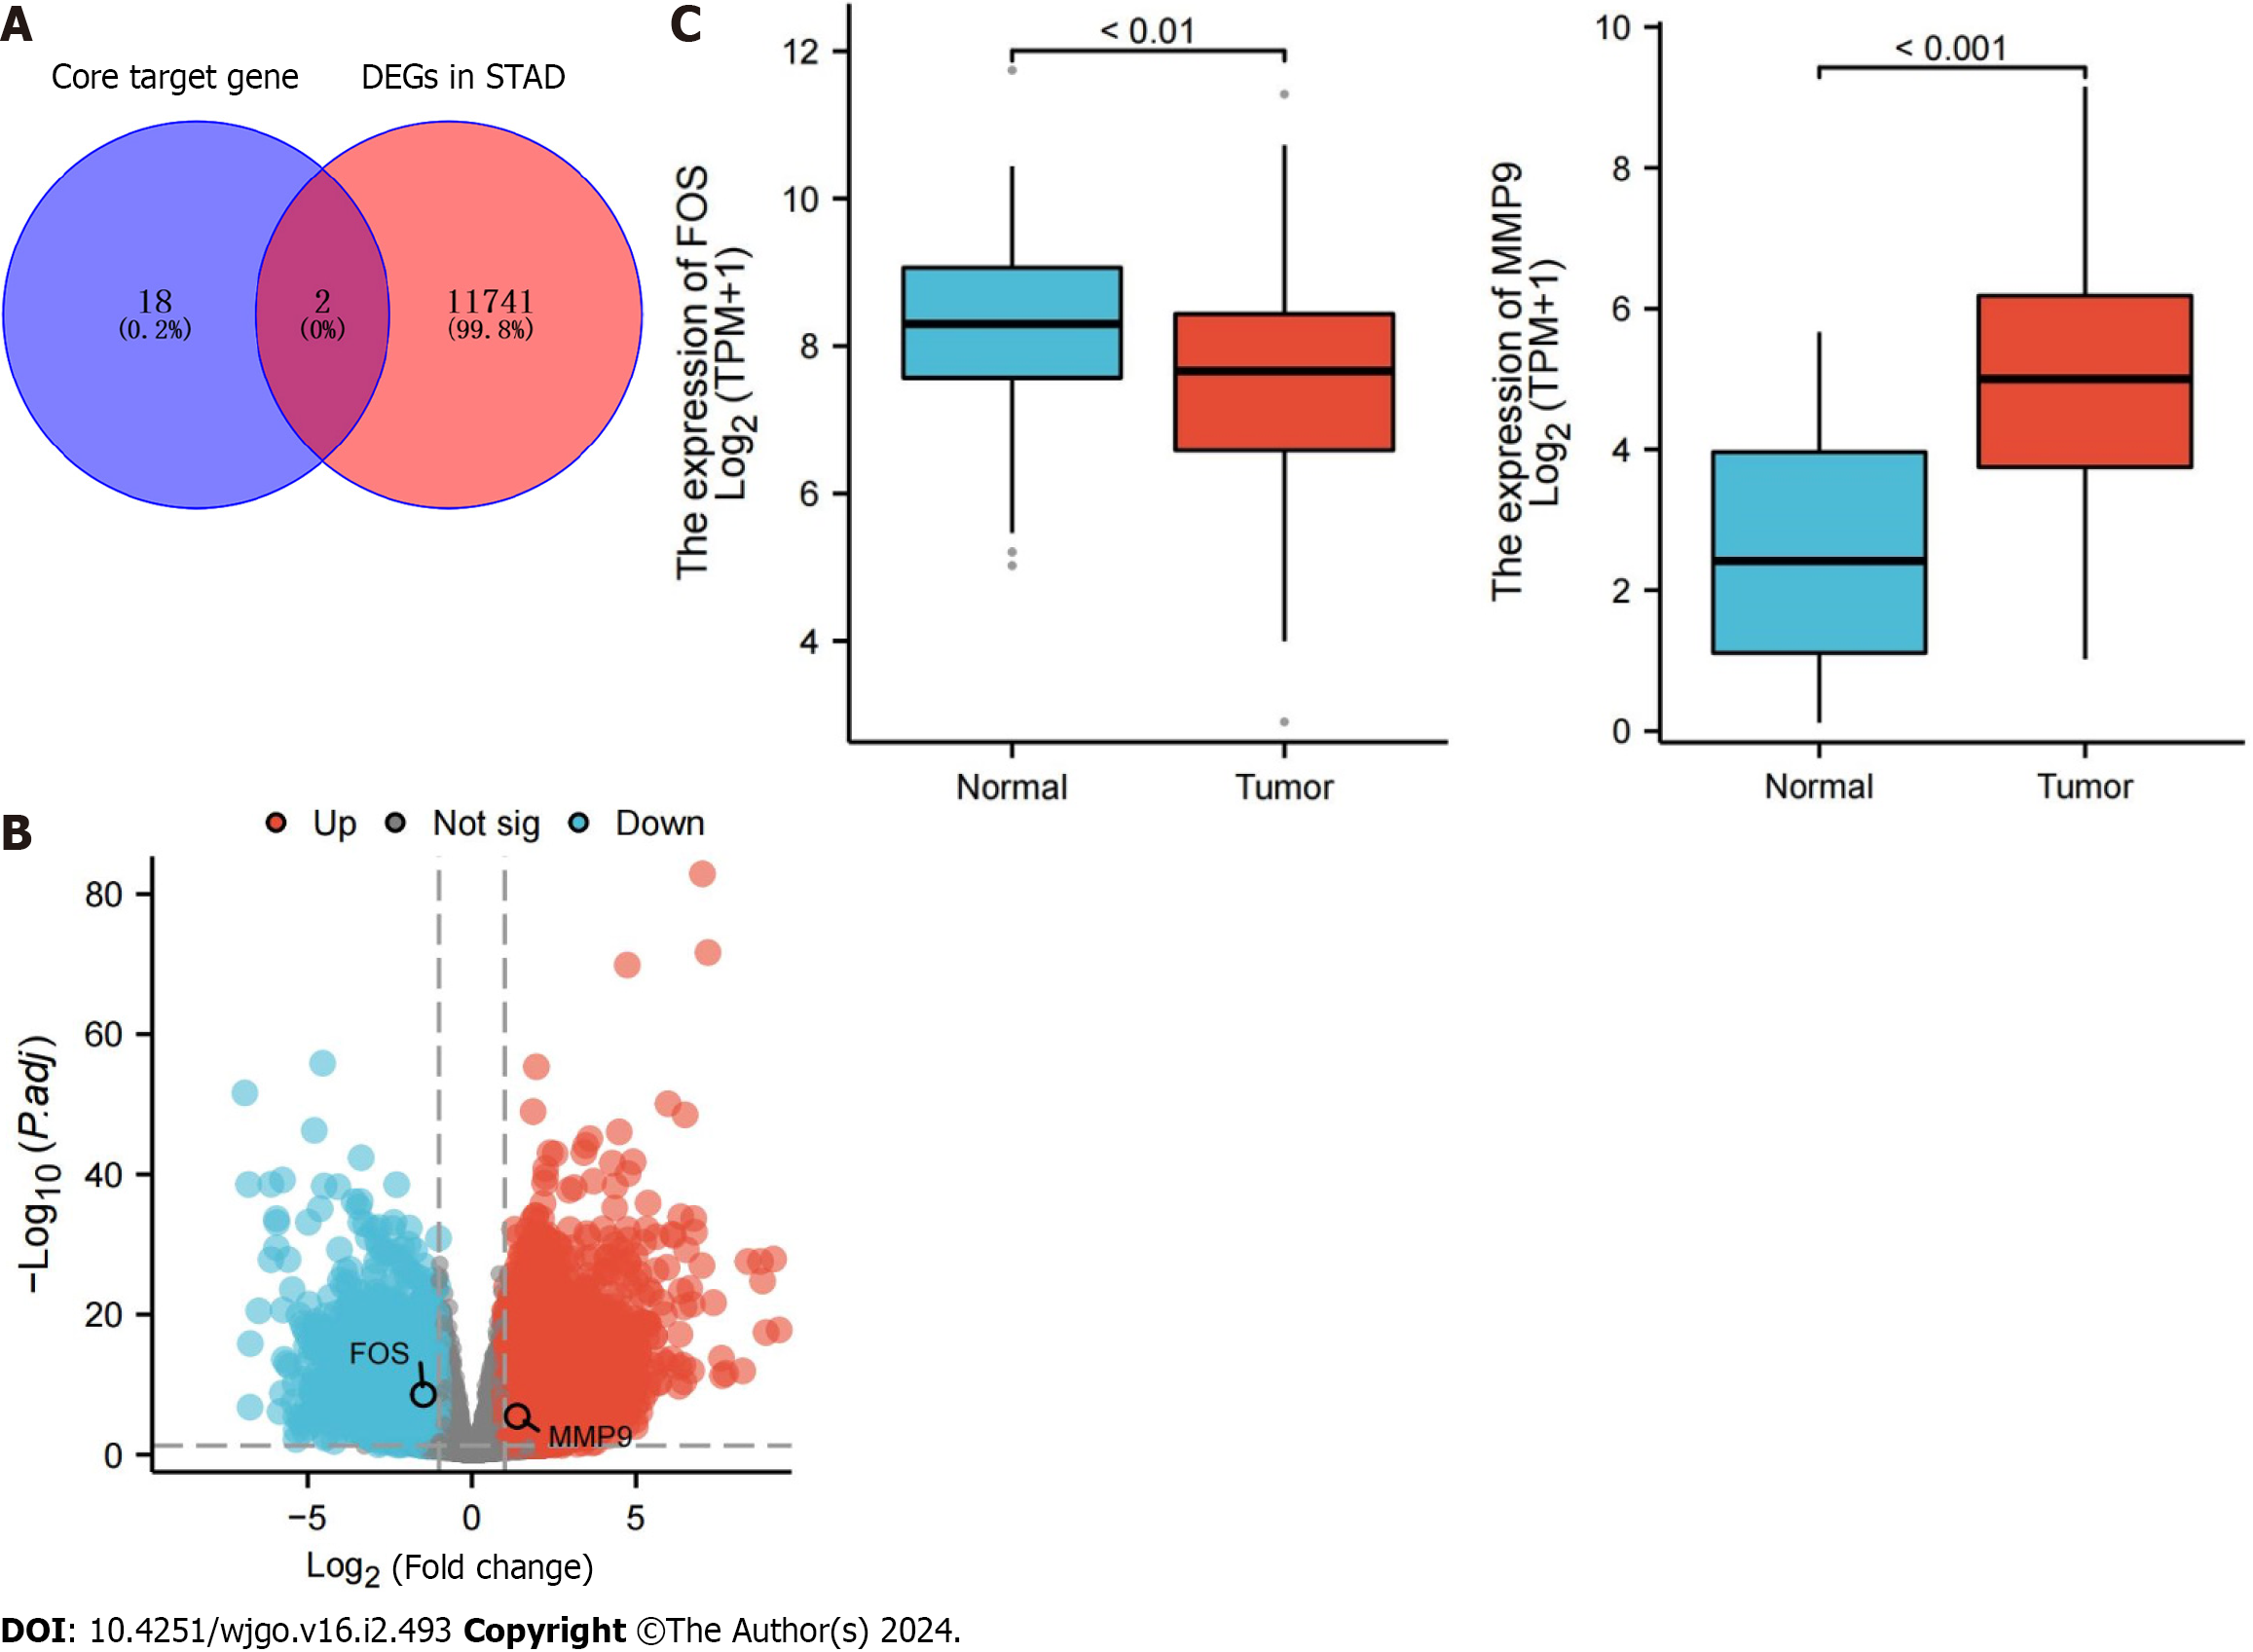
Figure 5 Differential expression of core target genes in The Cancer Genome Atlas database.
A: Overlapping genes between core target genes and differentially expressed genes associated with stomach adenocarcinoma; B: Volcano map of overlapping gene expression; C: Expression data of overlapping genes in normal samples and gastric cancer samples. The blue box represents normal samples, and the red box represents tumor samples. DEGs: Differentially expressed genes; STAD: Stomach adenocarcinoma.
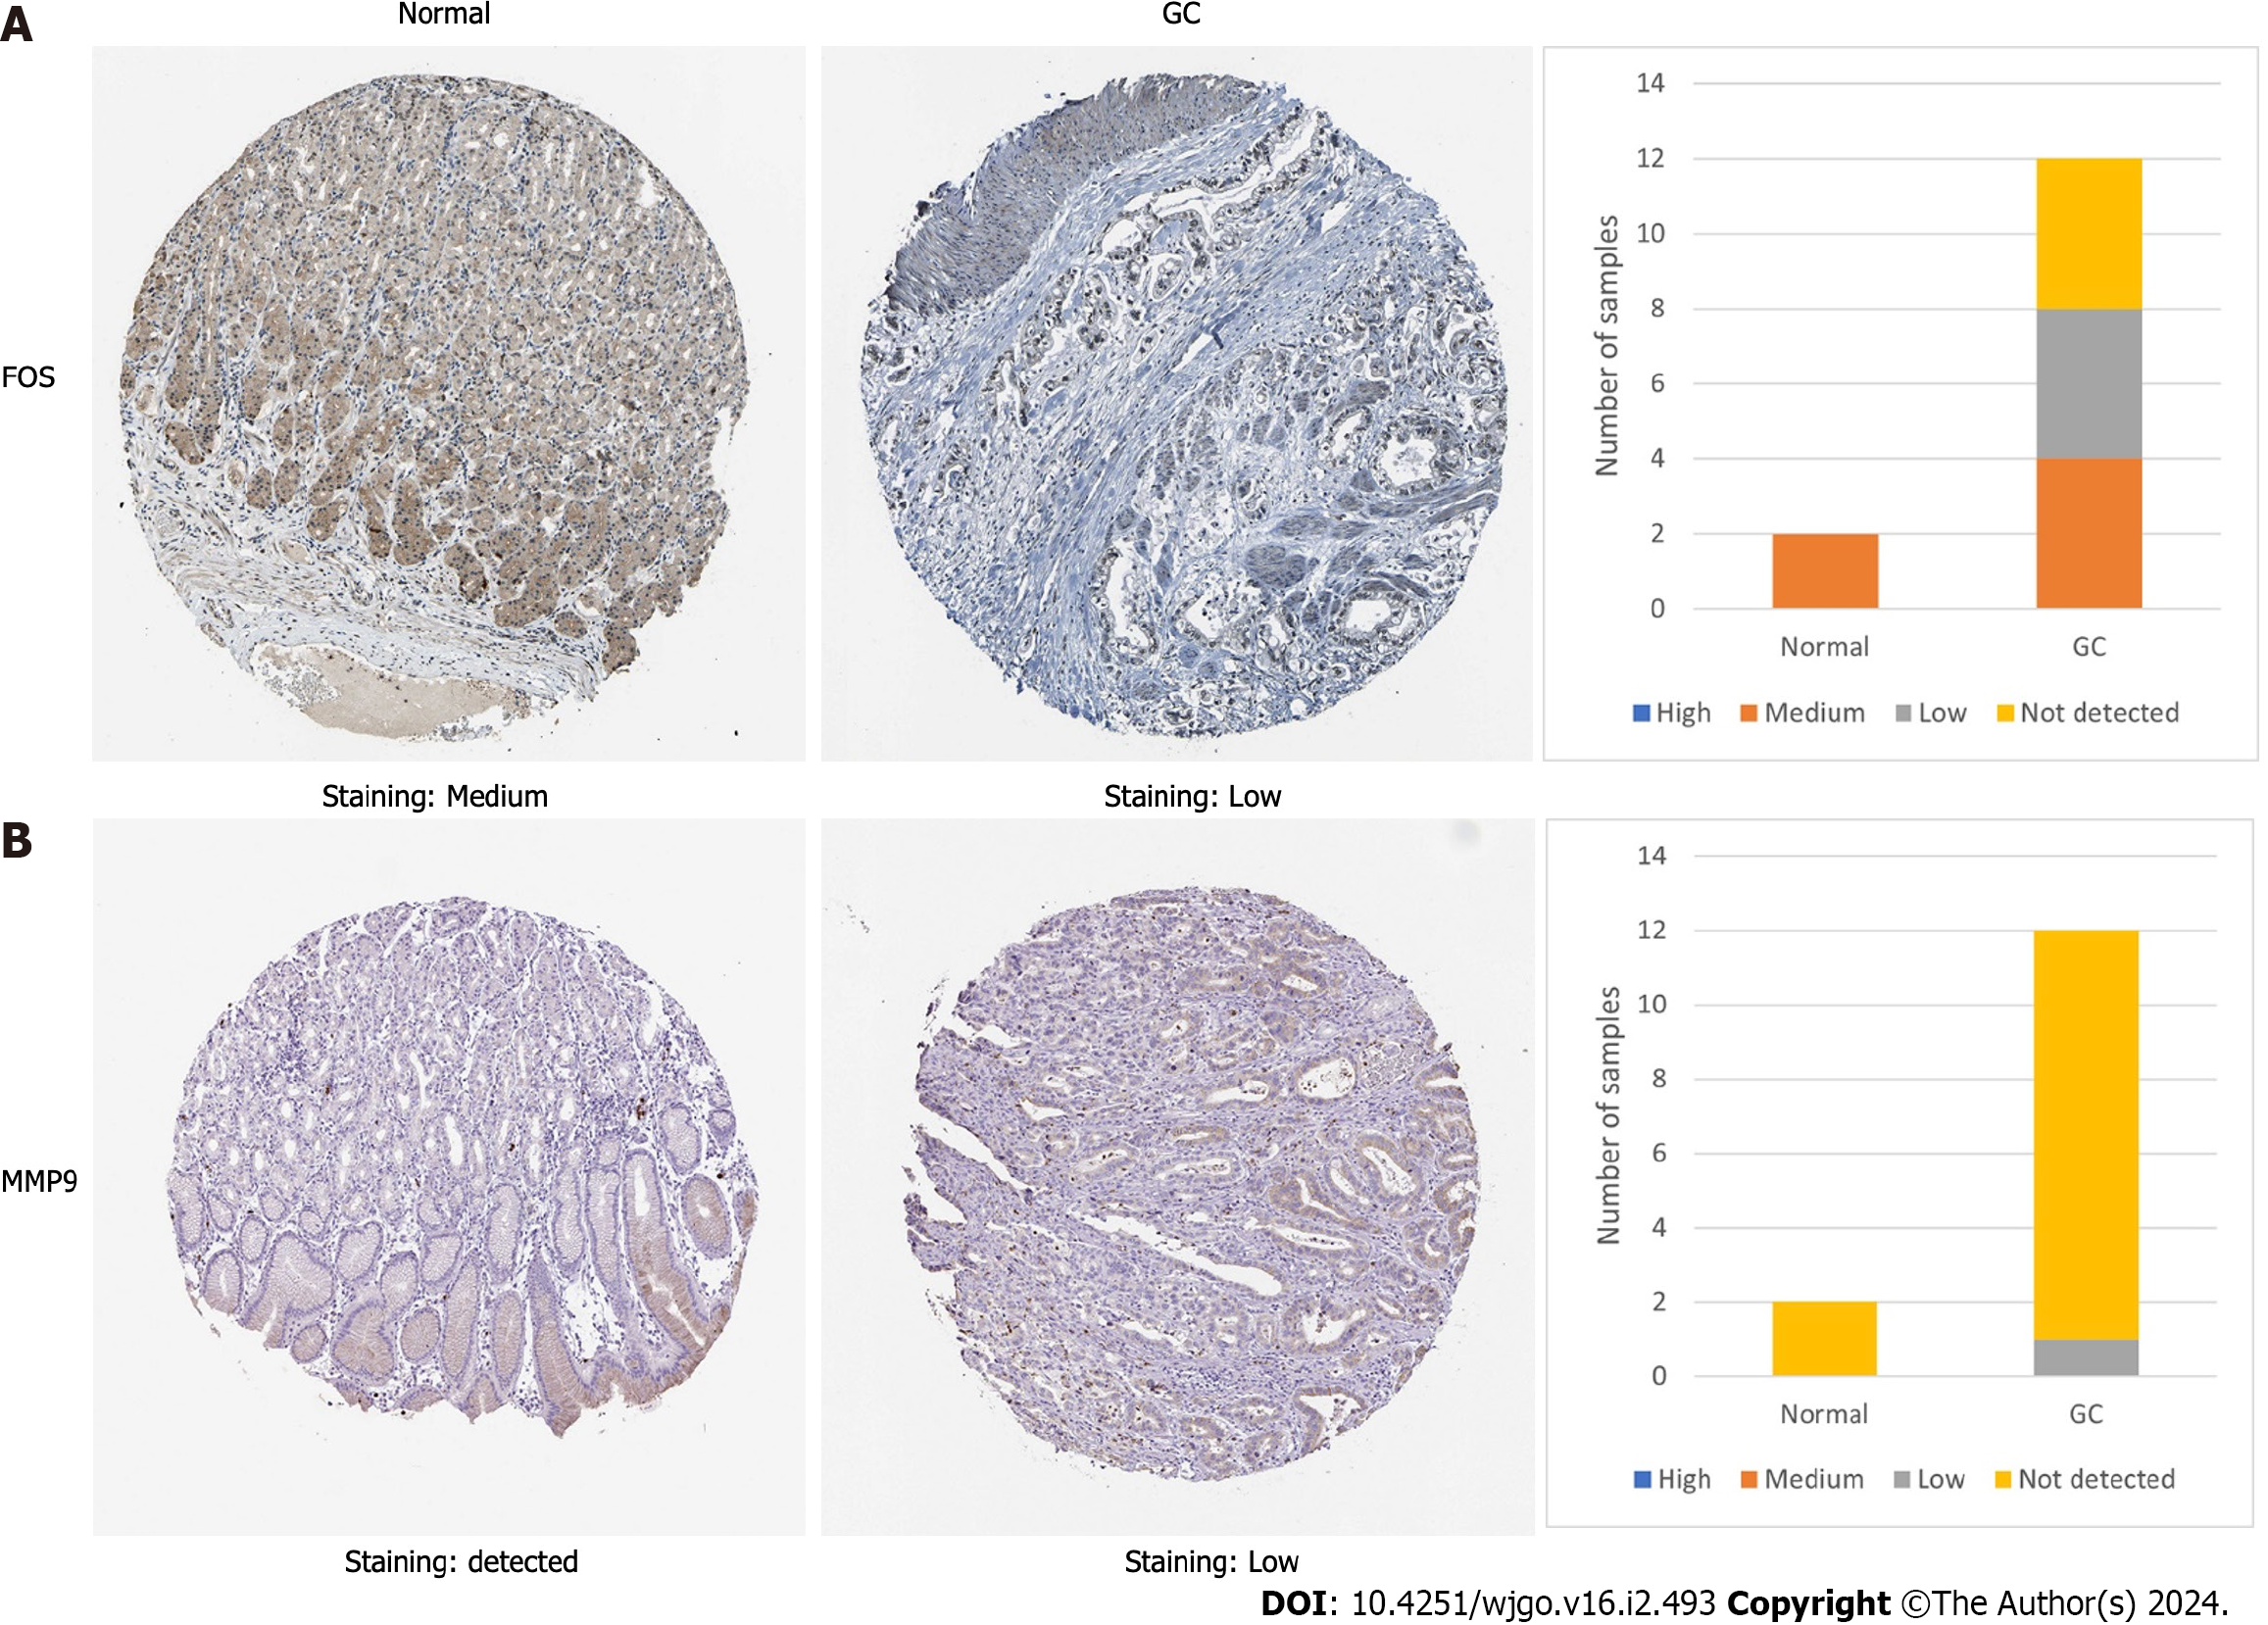
Figure 6 The protein expression of FBJ murine osteosarcoma viral oncogene homolog and matrix metallopeptidase 9 in the Human Protein Atlas database.
A: Immunohistochemical staining results of FBJ murine osteosarcoma viral oncogene homolog protein expression in normal gastric and cancer tissues; B: Immunohistochemical staining results of matrix metallopeptidase 9 protein expression in normal gastric and cancer tissues. The staining strengths were divided into four types: not detected, low, medium and high. GC: Gastric cancer. FOS: FBJ murine osteosarcoma viral oncogene homolog; MMP9: Matrix metallopeptidase 9.
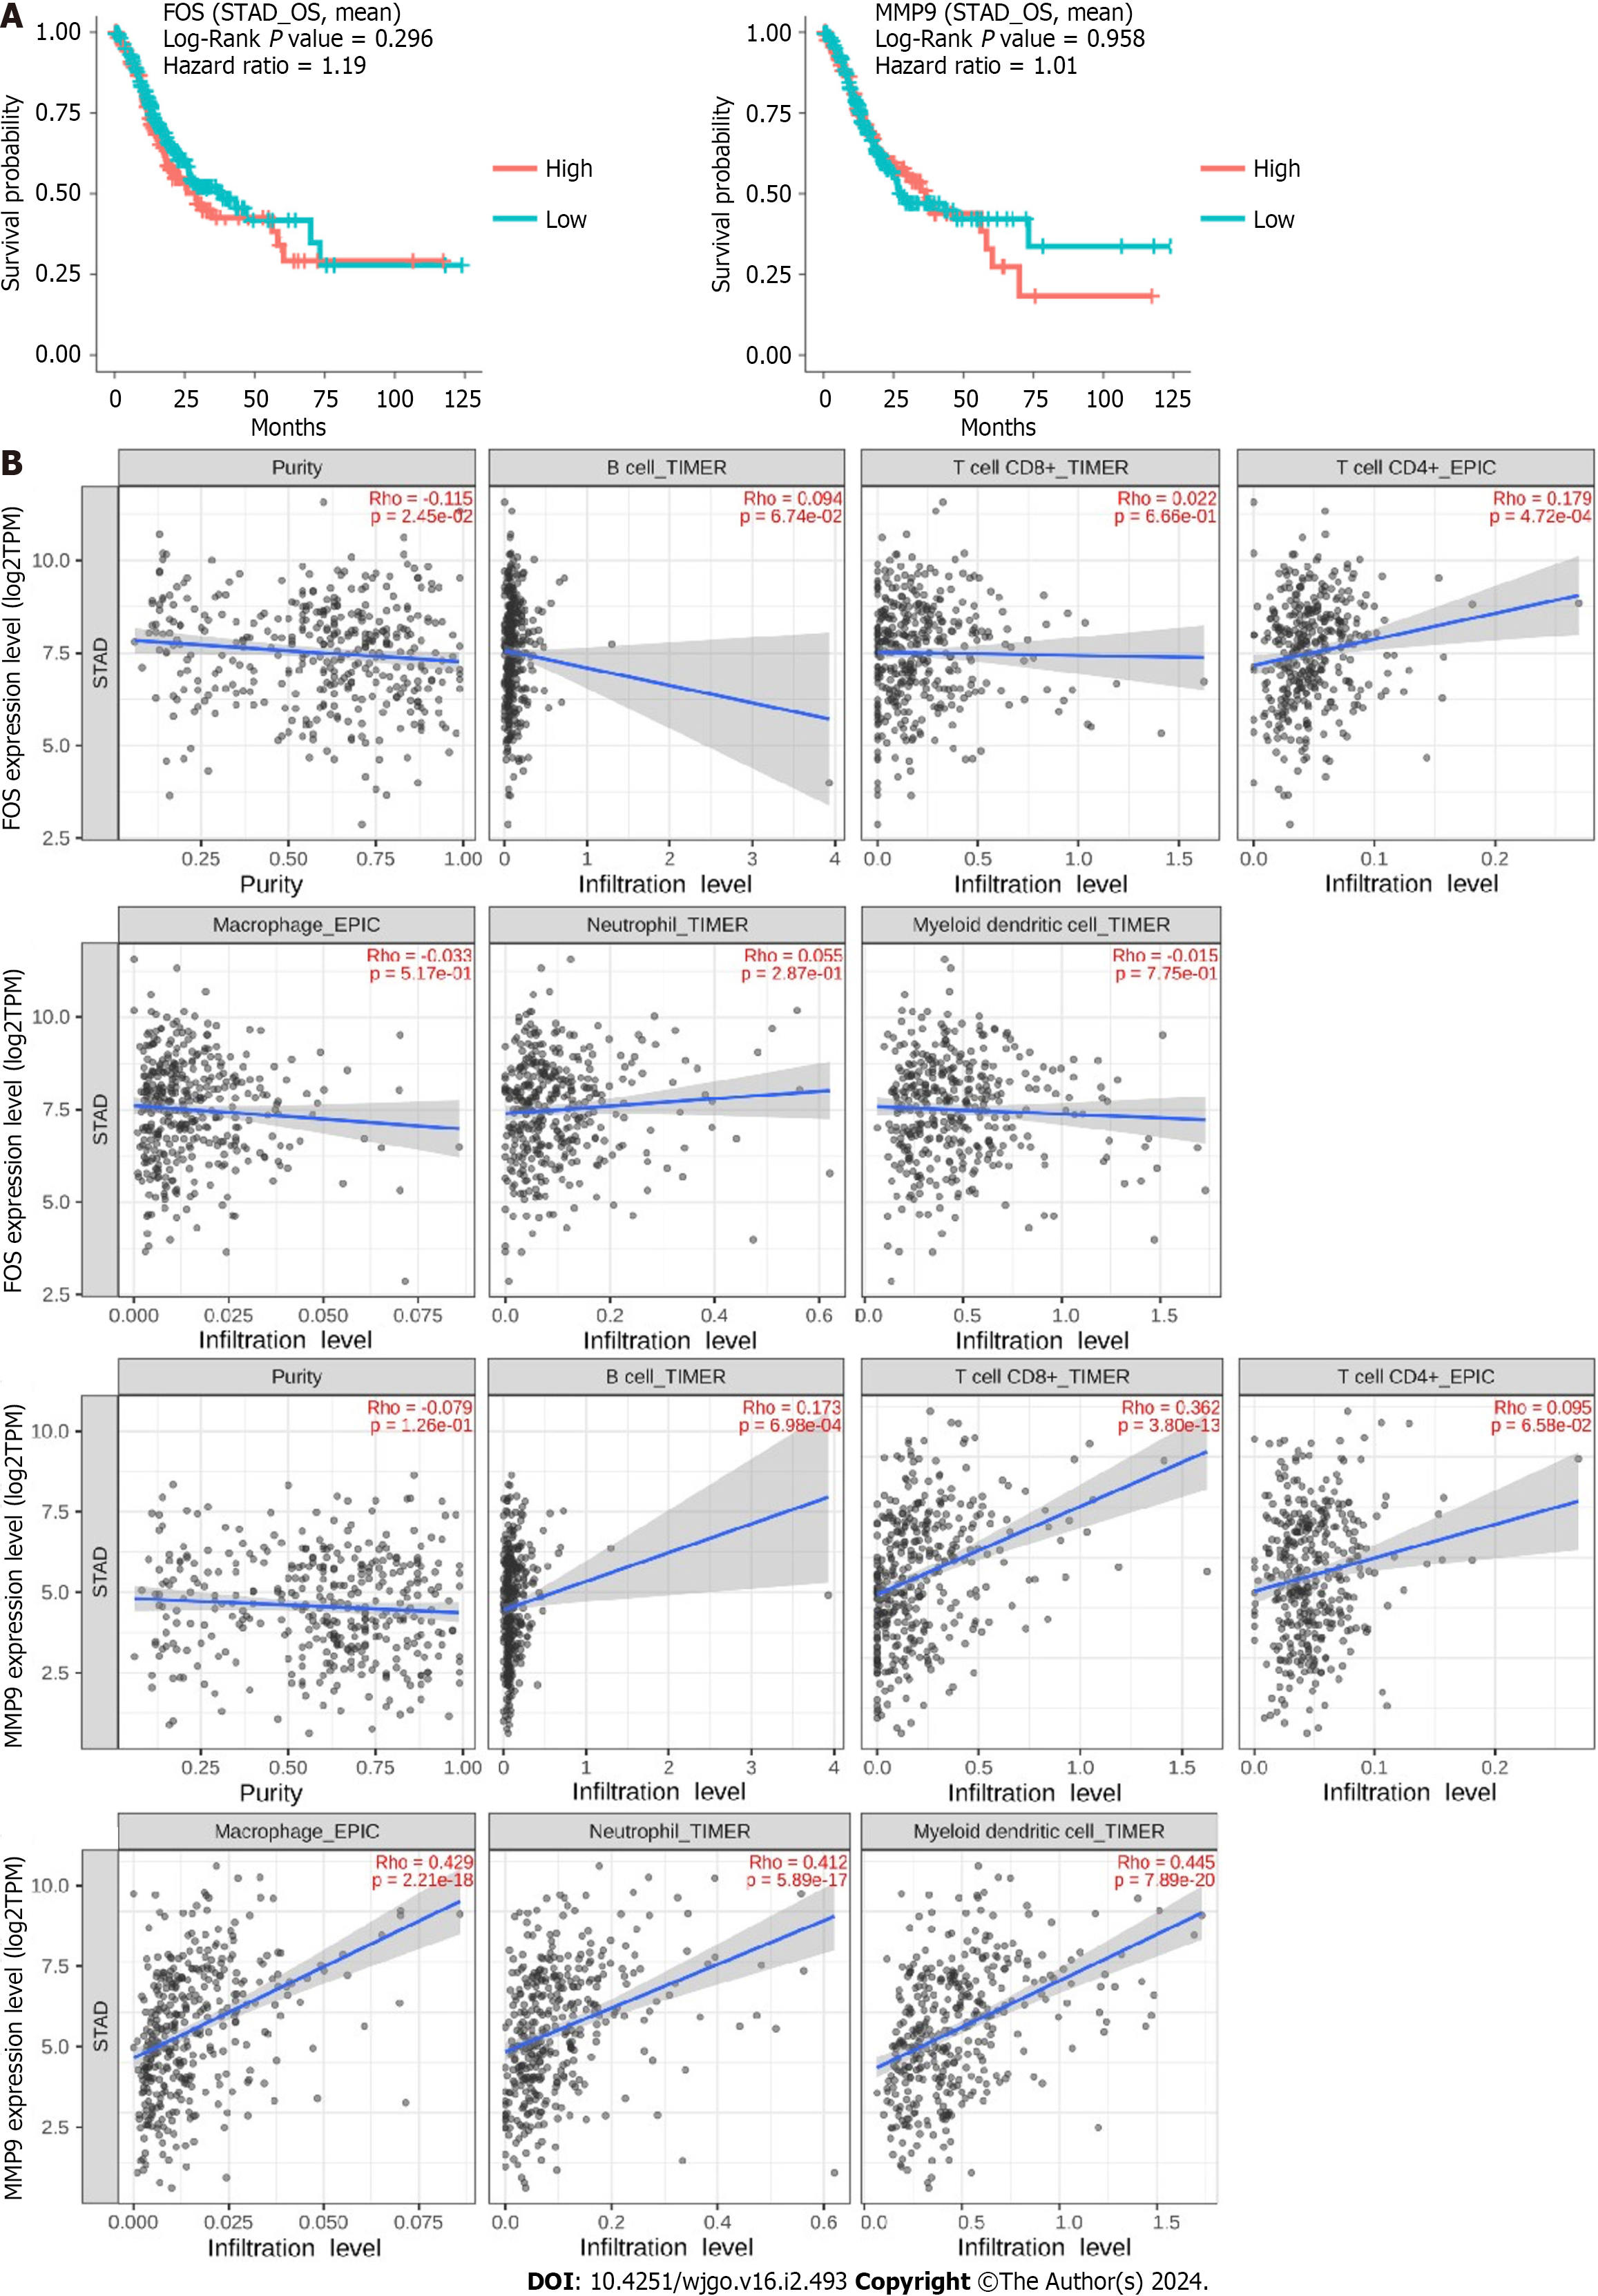
Figure 7 Survival and immune infiltration analysis for FBJ murine osteosarcoma viral oncogene homolog and matrix metallopeptidase 9.
A: The overall survival of FBJ murine osteosarcoma viral oncogene homolog (FOS) and matrix metallopeptidase 9 (MMP9) was identified in the DriverDBv3 database, and the blue curves represent low expression and the red curves represent high expression; B: Association of FOS and MMP9 expression with immune cells was identified in the TIMER2.0 database. STAD: Stomach adenocarcinoma. FOS: FBJ murine osteosarcoma viral oncogene homolog; MMP9: Matrix metallopeptidase 9.
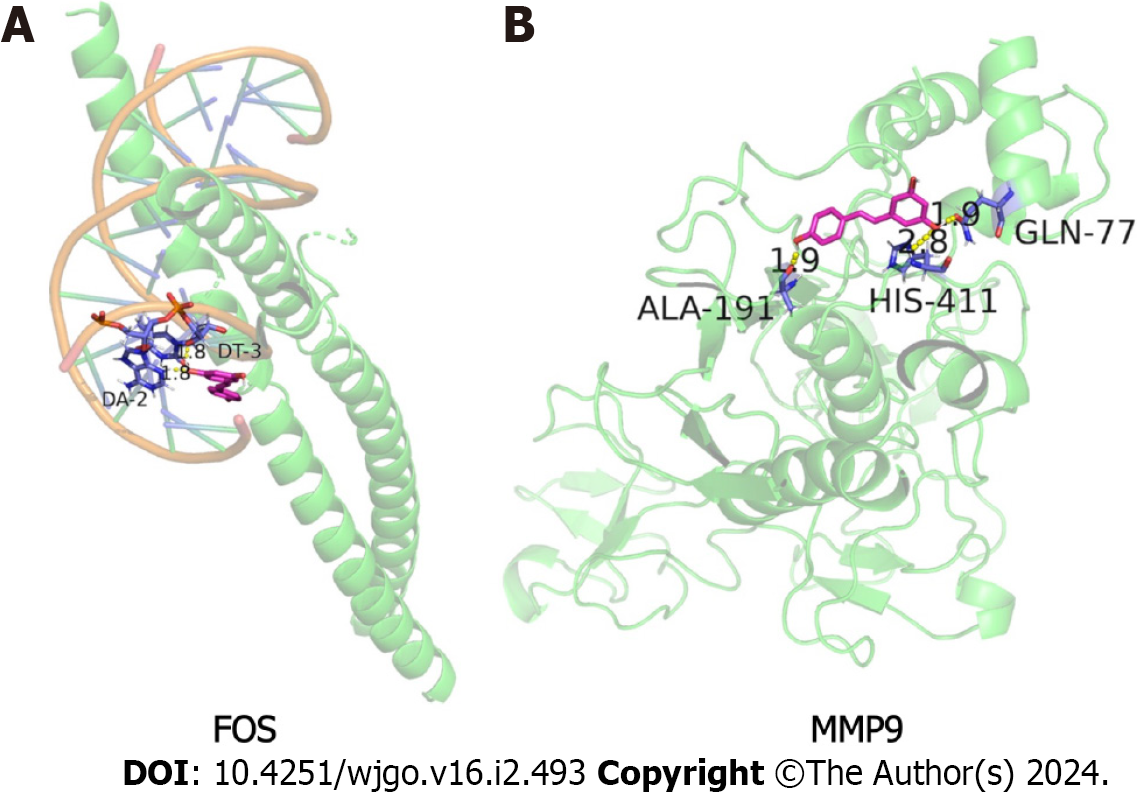
Figure 8 Molecular docking results of resveratrol with FBJ murine osteosarcoma viral oncogene homolog and matrix metallopeptidase 9.
A: Resveratrol and FBJ murine osteosarcoma viral oncogene homolog molecular docking visualization; B: Resveratrol and matrix metallopeptidase 9 molecular docking visualization. Green represents the protein skeleton, violet represents the binding sites, magenta represents the compound small molecule and yellow represents hydrogen bonds. FOS: FBJ murine osteosarcoma viral oncogene homolog; MMP9: Matrix metallopeptidase 9.
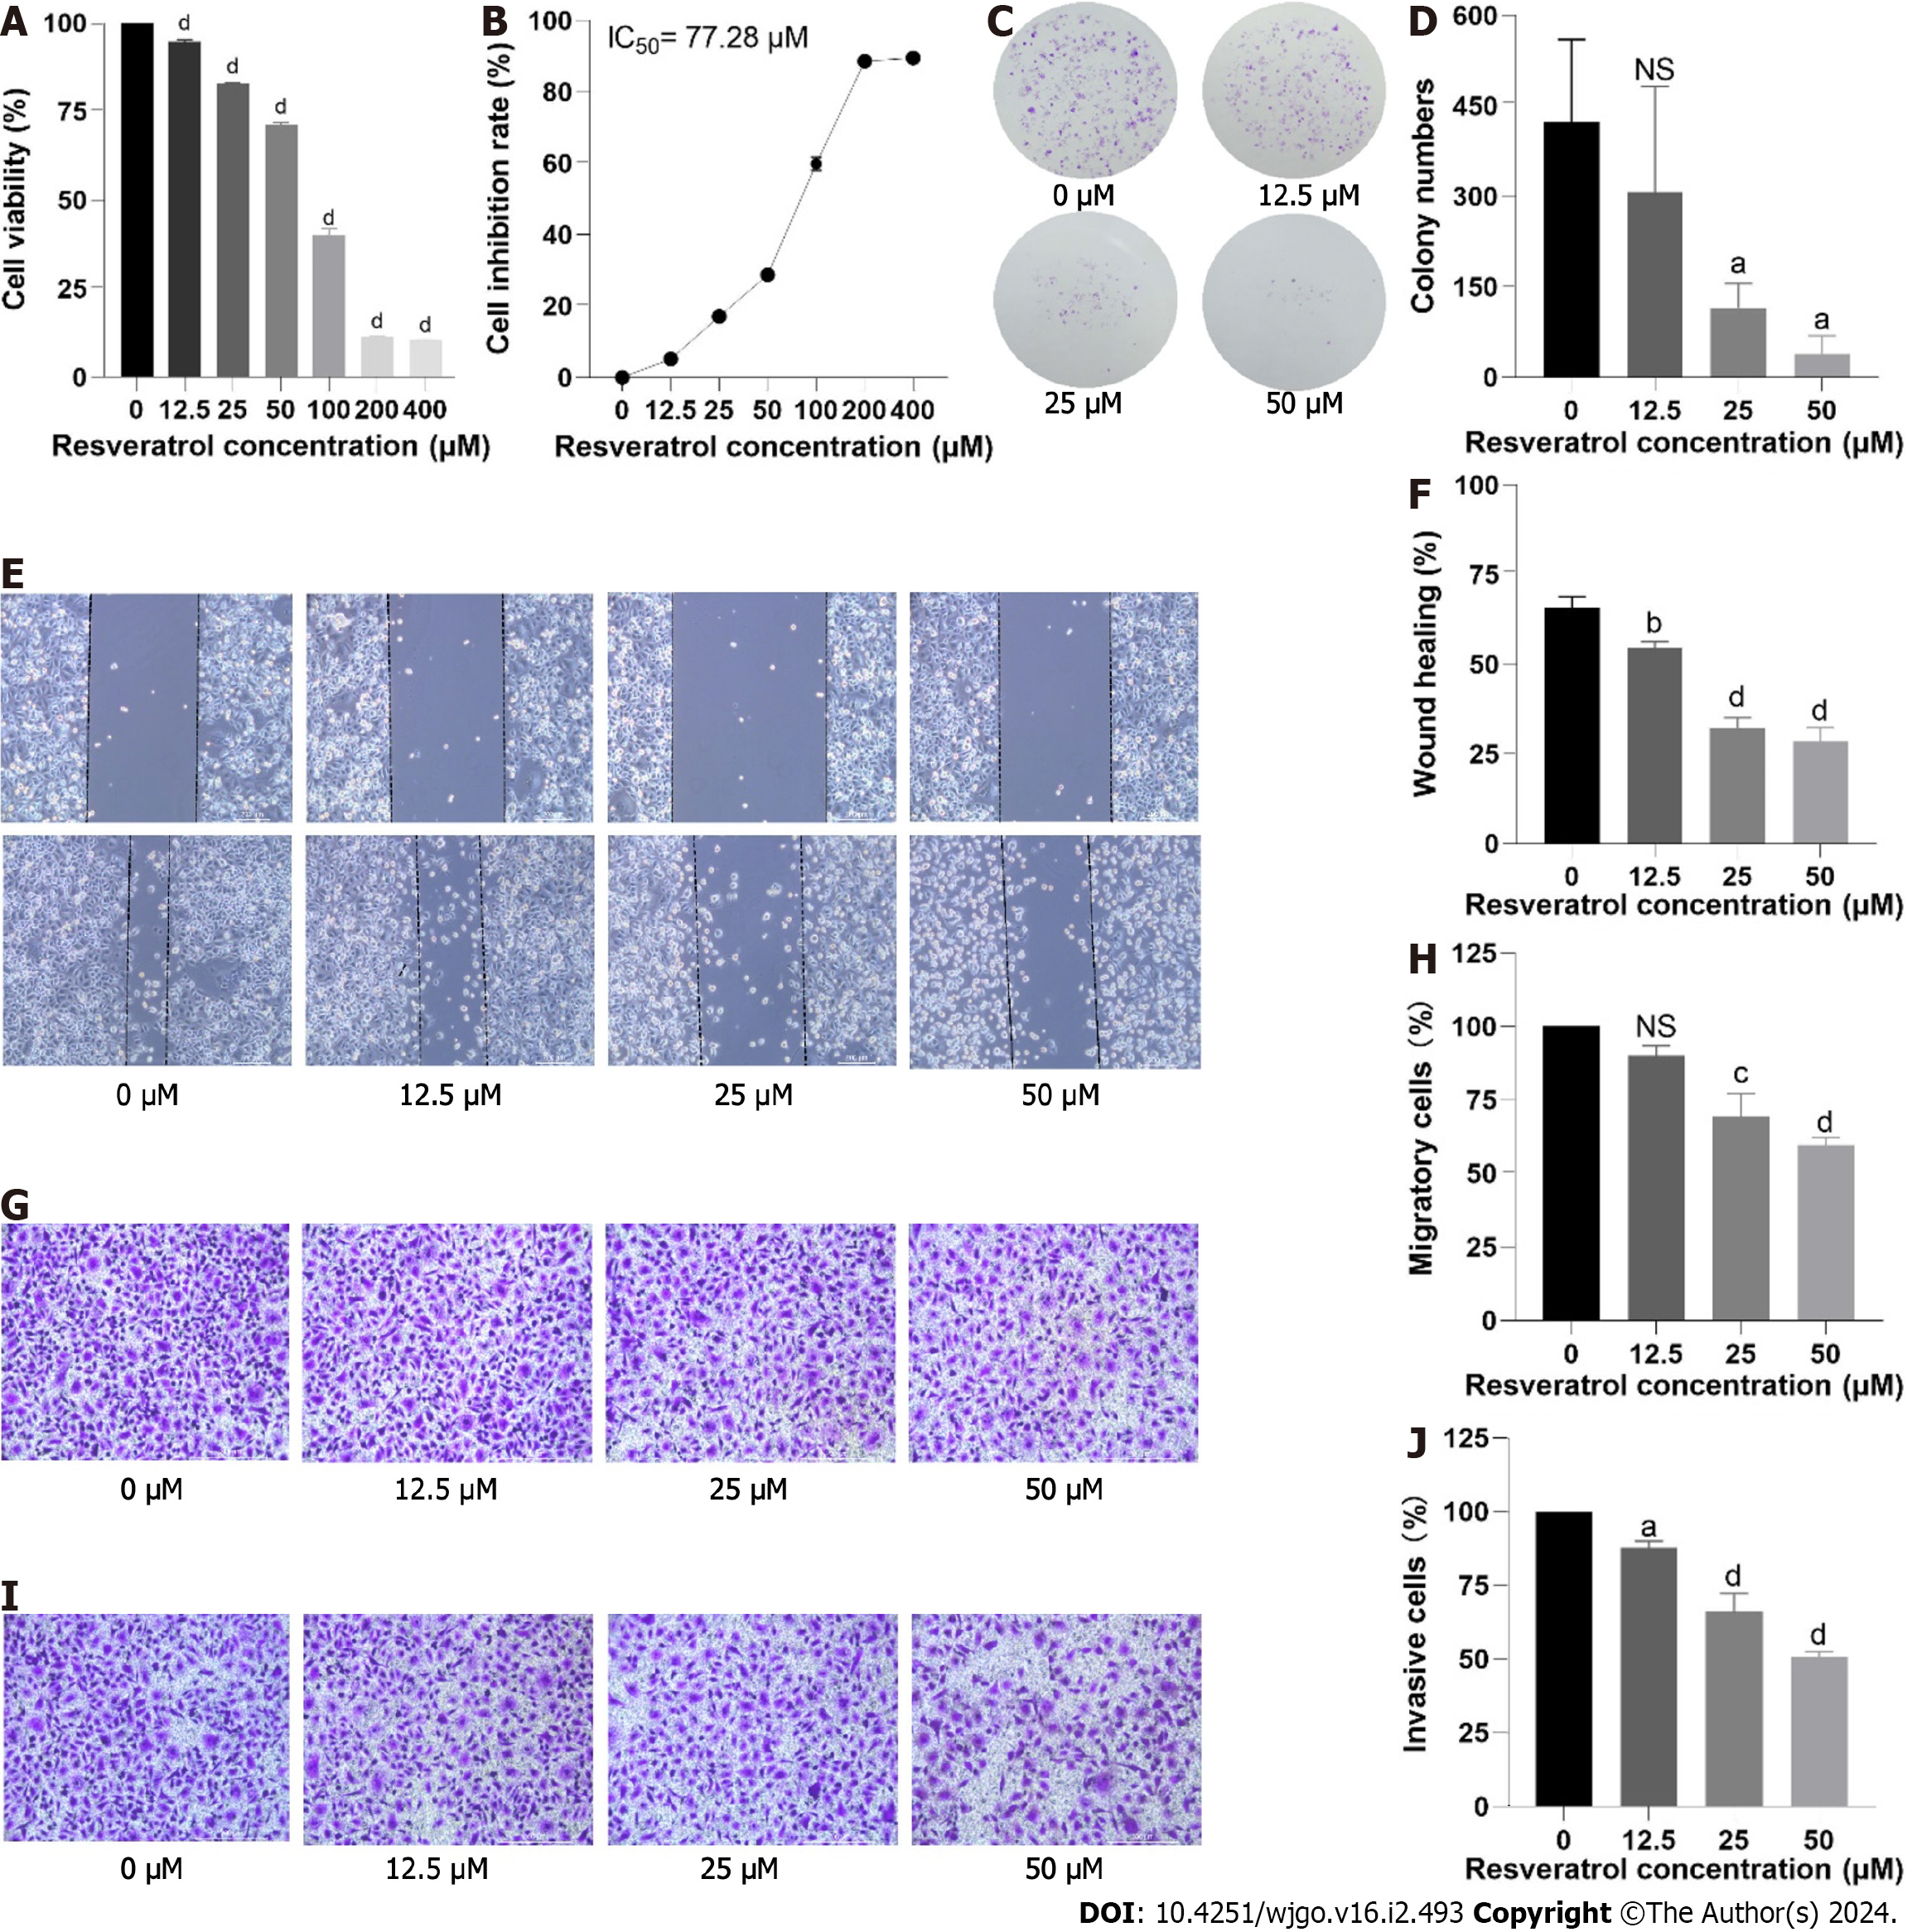
Figure 9 Effects of resveratrol on the proliferation, migration and invasion of adeno gastro carcinoma cells.
A and B: Cell viability was determined by cell counting kit 8 assay; C and D: The results of the colony formation assay in adeno gastro carcinoma cells are shown; E-H: Cell migration was verified by wound healing and Transwell migration assays; I and J: Cell invasion was detected by Transwell invasion assay. aP < 0.05; bP < 0.01; cP < 0.001; dP < 0.0001. IC50: Half maximal inhibitory concentration; NS: No significance.
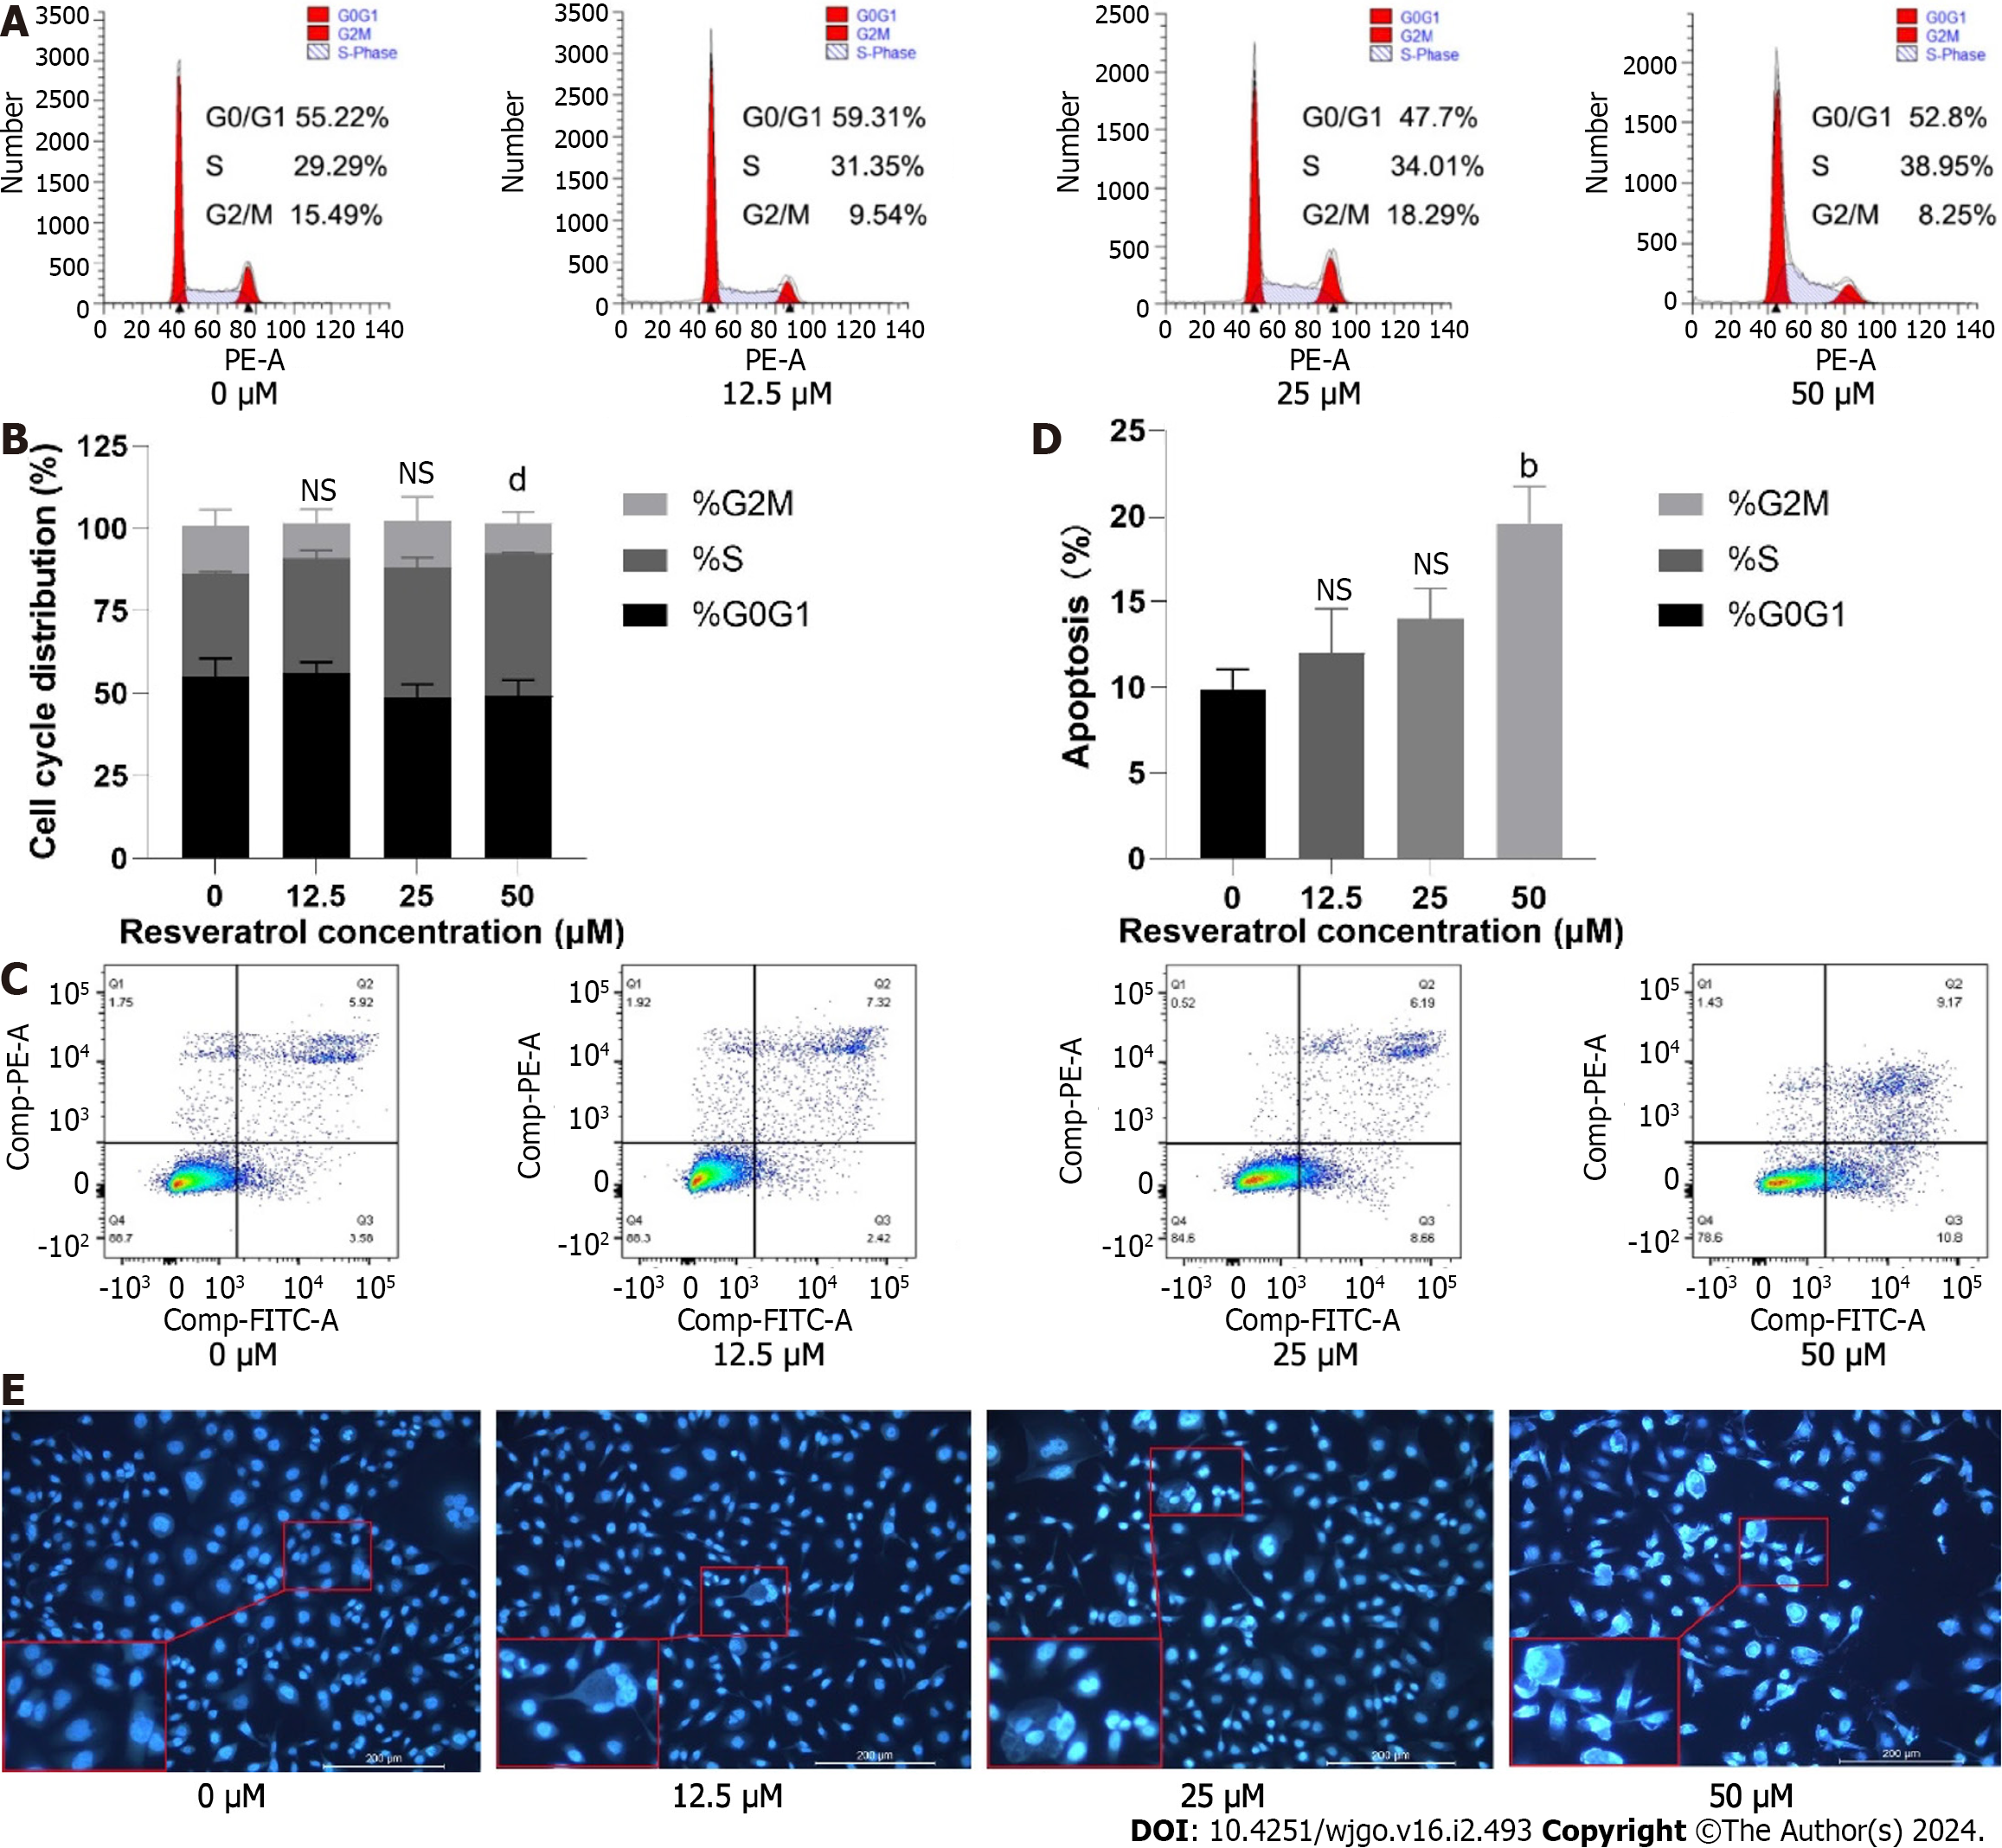
Figure 10 Effects of resveratrol on adeno gastro carcinoma cell cycle arrest and apoptosis.
A and B: Flow cytometry was used to measure the proportion of cells at each stage of the cell cycle; C-E: Flow cytometry and Hoechst 33258 staining were performed to detect apoptotic cells. bP < 0.01; dP < 0.0001. NS: No significance.
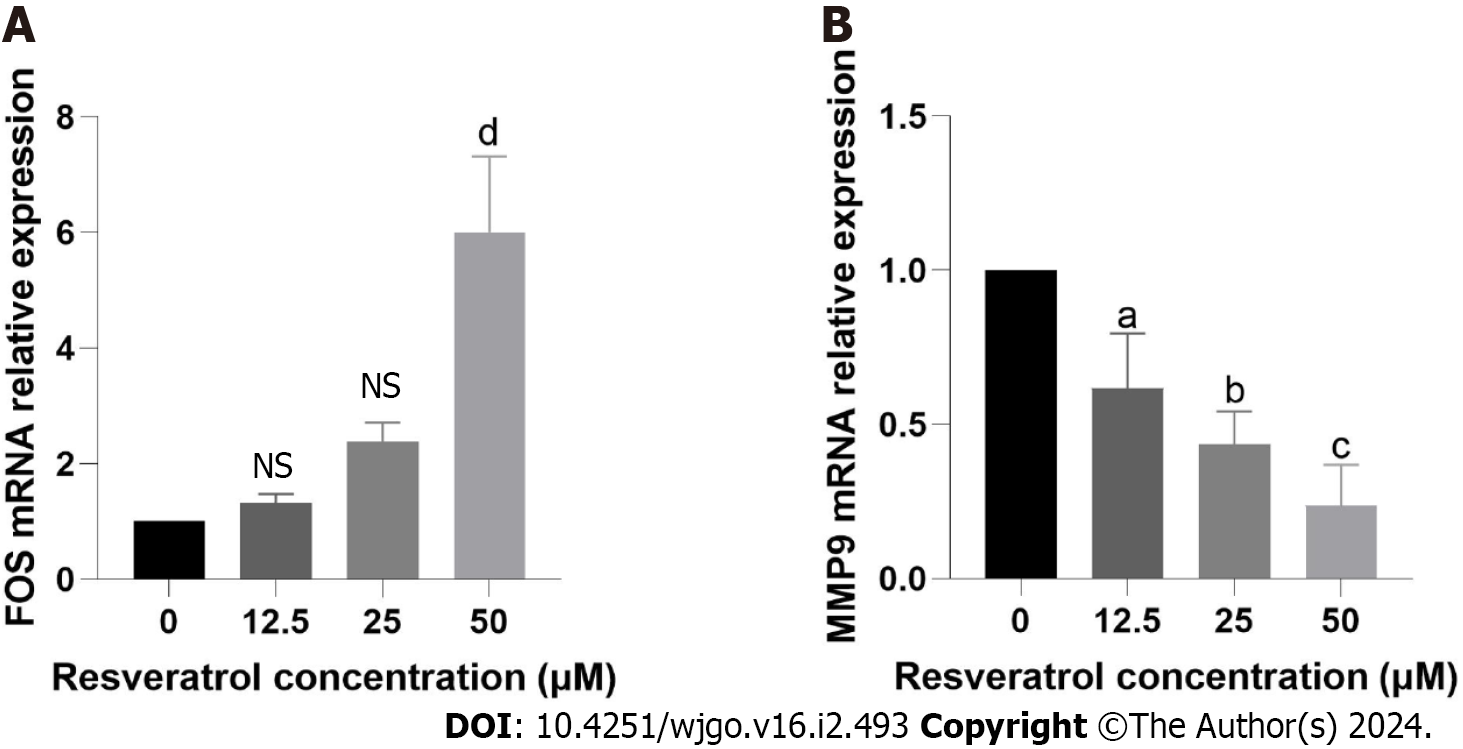
Figure 11 Target validation of resveratrol in gastric cancer.
A: Reverse transcription quantitative PCR (RT-qPCR) detection of FBJ murine osteosarcoma viral oncogene homolog expression levels. B: RT-qPCR detection of Matrix metallopeptidase 9 expression levels. aP < 0.05; bP < 0.01; cP < 0.001, dP < 0.0001. NS: No significance. FOS: FBJ murine osteosarcoma viral oncogene homolog; MMP9: Matrix metallopeptidase 9.
- Citation: Ma YQ, Zhang M, Sun ZH, Tang HY, Wang Y, Liu JX, Zhang ZX, Wang C. Identification of anti-gastric cancer effects and molecular mechanisms of resveratrol: From network pharmacology and bioinformatics to experimental validation. World J Gastrointest Oncol 2024; 16(2): 493-513
- URL: https://www.wjgnet.com/1948-5204/full/v16/i2/493.htm
- DOI: https://dx.doi.org/10.4251/wjgo.v16.i2.493


