Copyright
©The Author(s) 2023.
World J Gastrointest Oncol. Aug 15, 2023; 15(8): 1461-1474
Published online Aug 15, 2023. doi: 10.4251/wjgo.v15.i8.1461
Published online Aug 15, 2023. doi: 10.4251/wjgo.v15.i8.1461
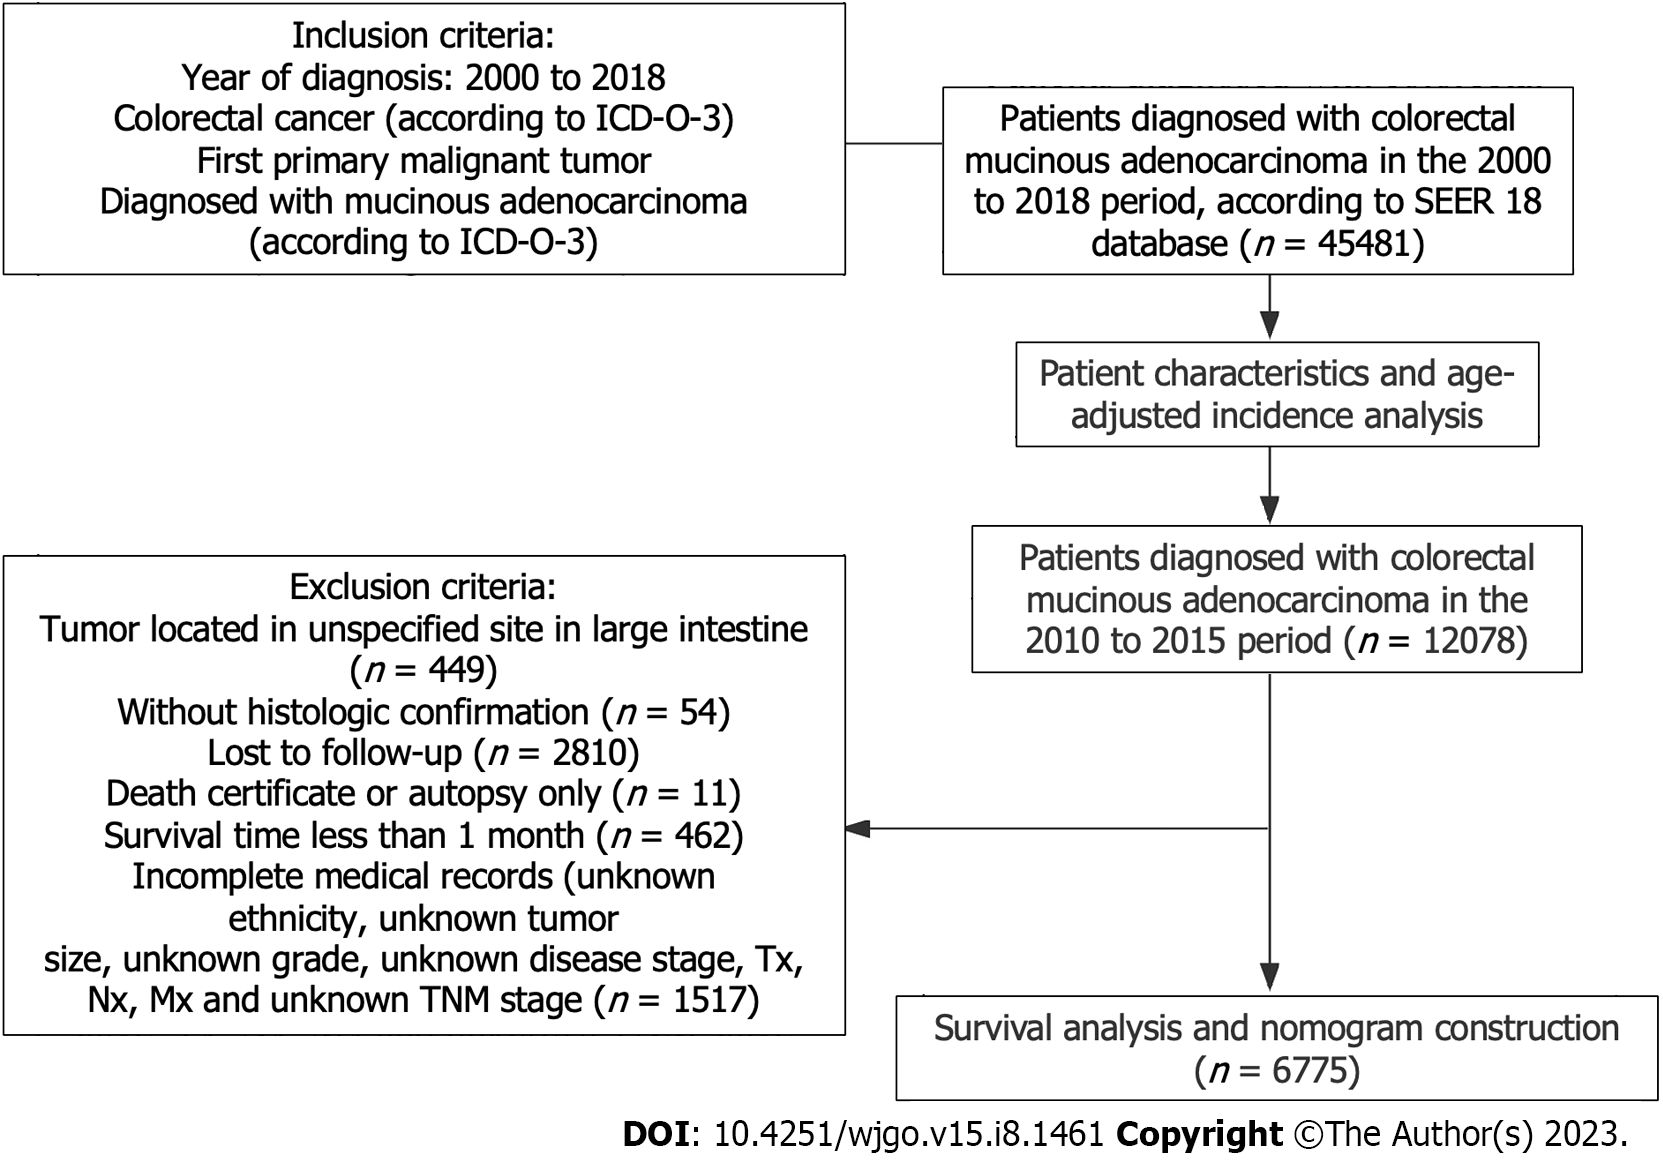
Figure 1 Flowchart of the study design and patient selection.
ICD-O-3: International Classification of Diseases for Oncology, Third Edition; SEER: Surveillance, Epidemiology, and End Results.
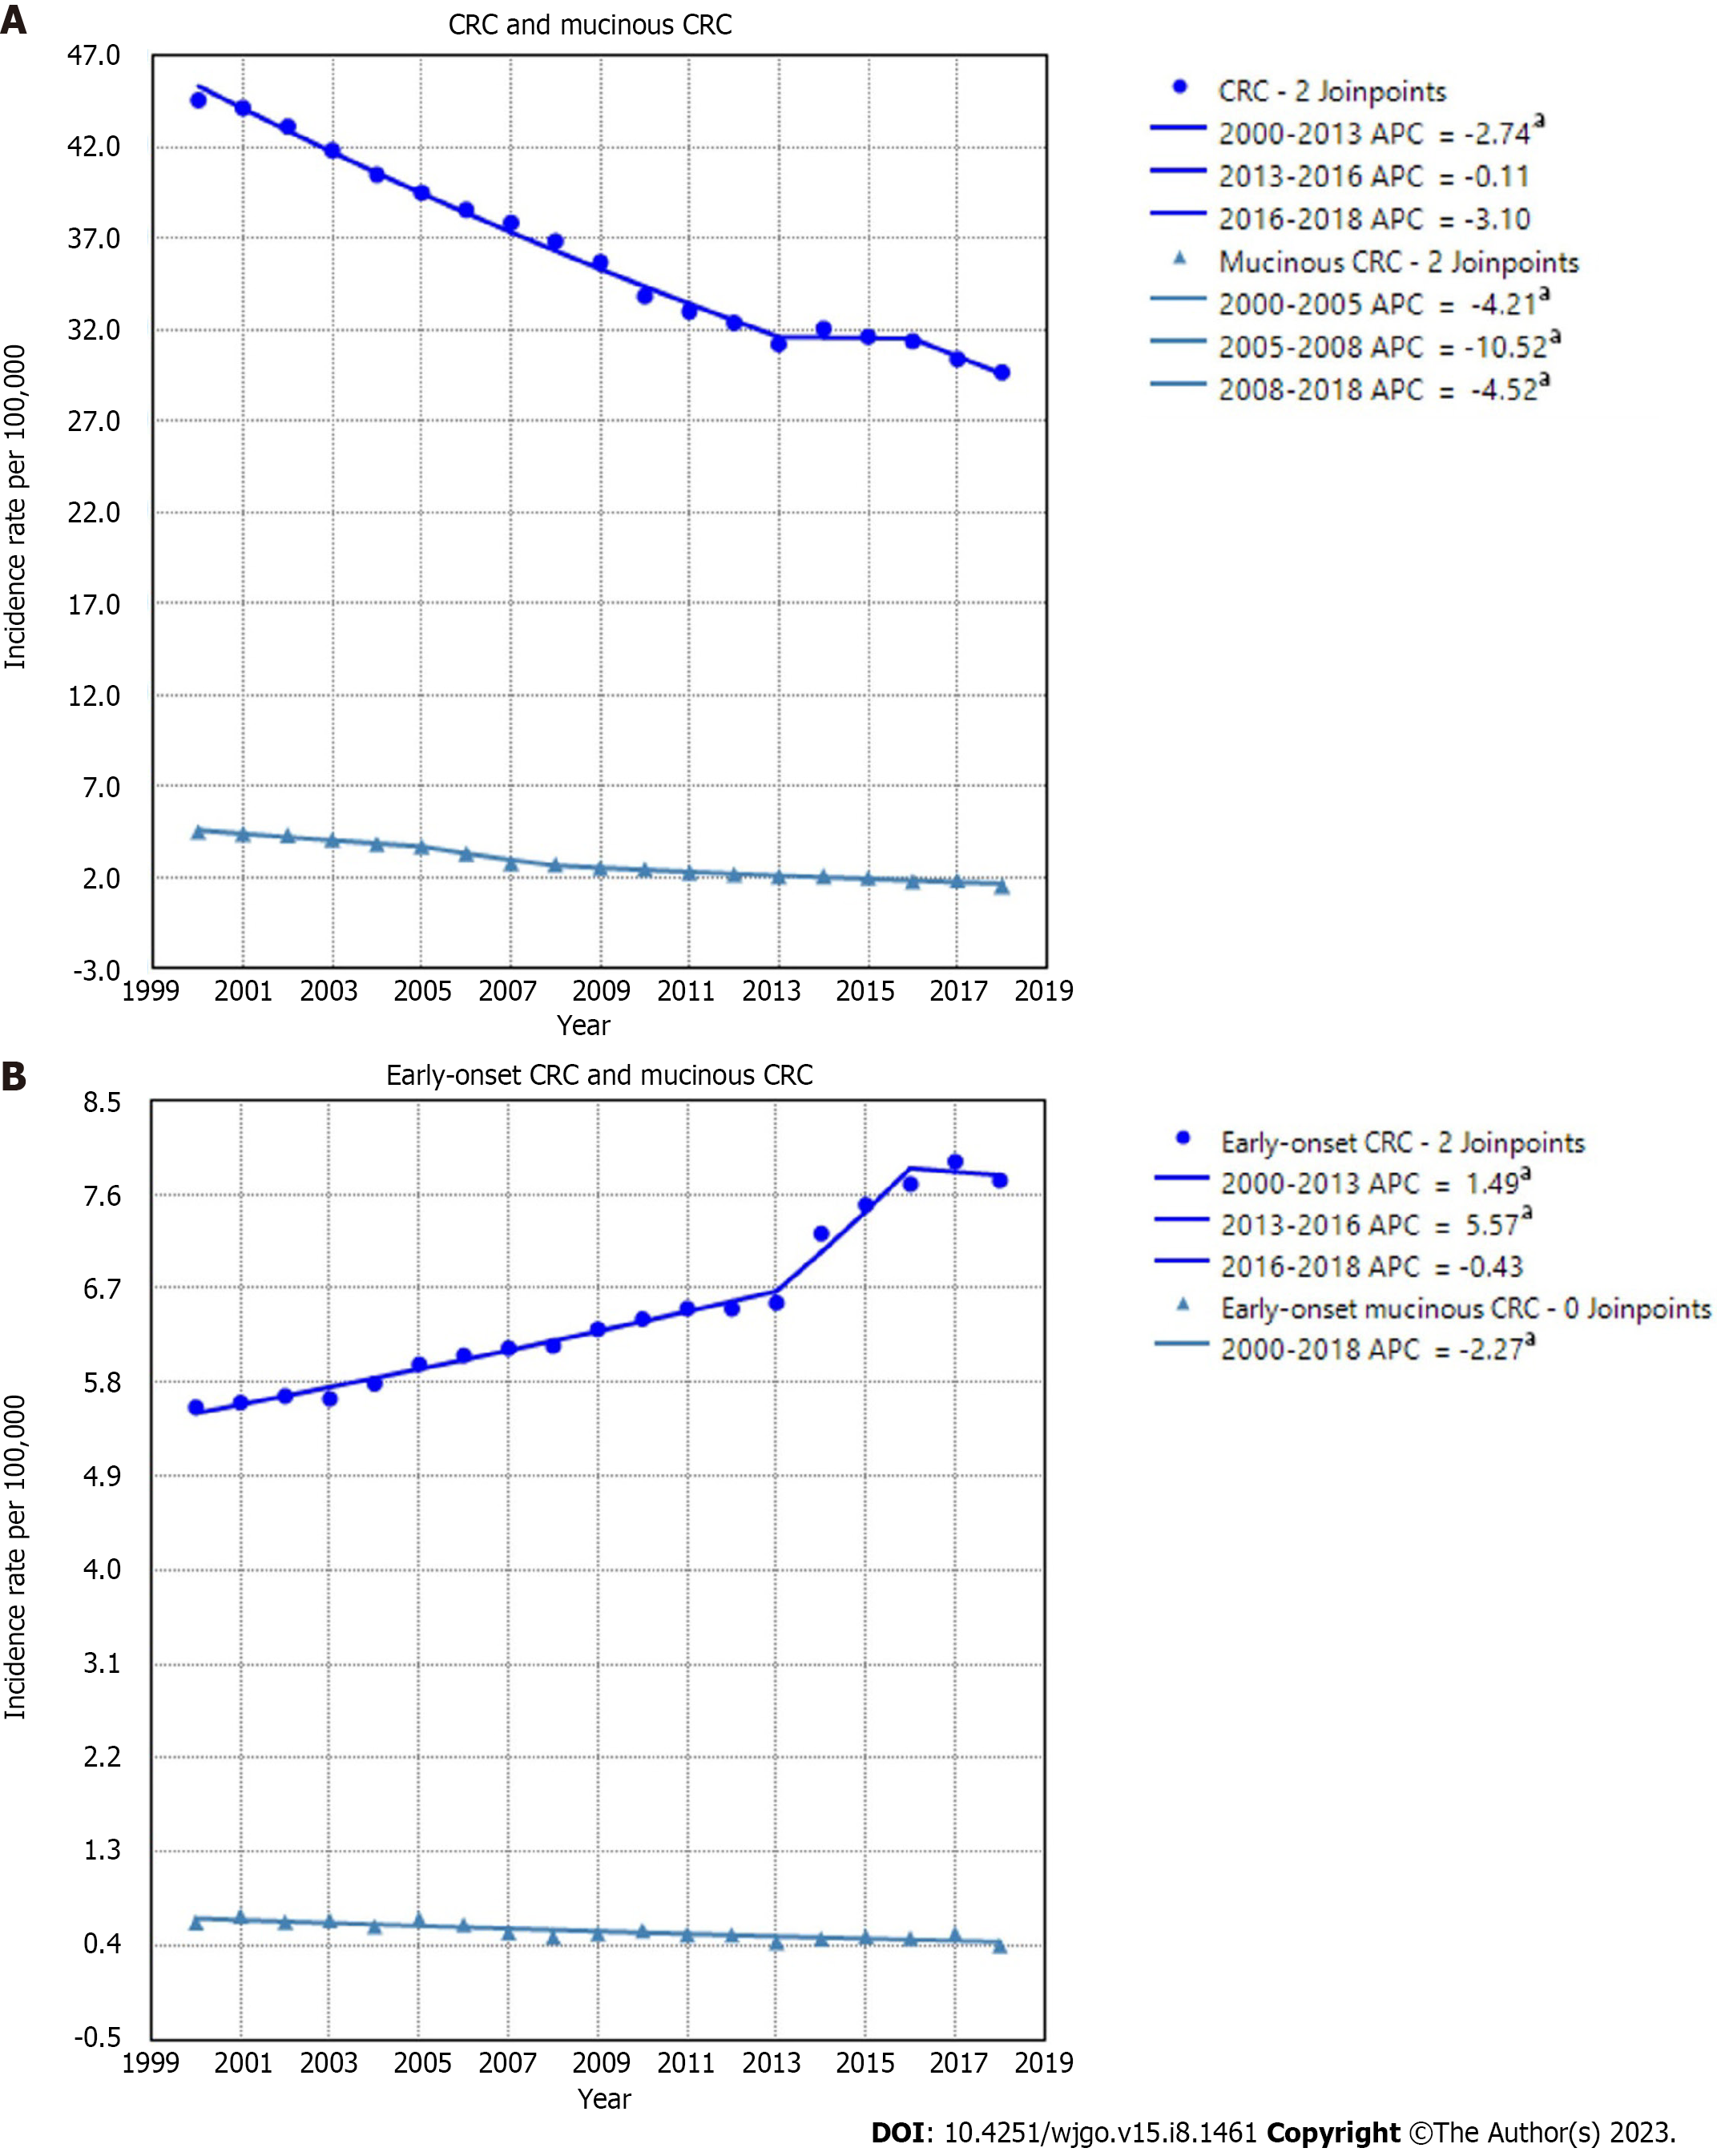
Figure 2 Incidence rate of colorectal cancer and mucinous colorectal cancer and the rate of early-onset colorectal cancer and early-onset colorectal cancer with a mucinous histology.
aThe annual percent change (APC) is significantly different from zero at alpha = 0.05. CRC: Colorectal cancer; Early-onset CRC: CRC cases in patients younger than 50 years.
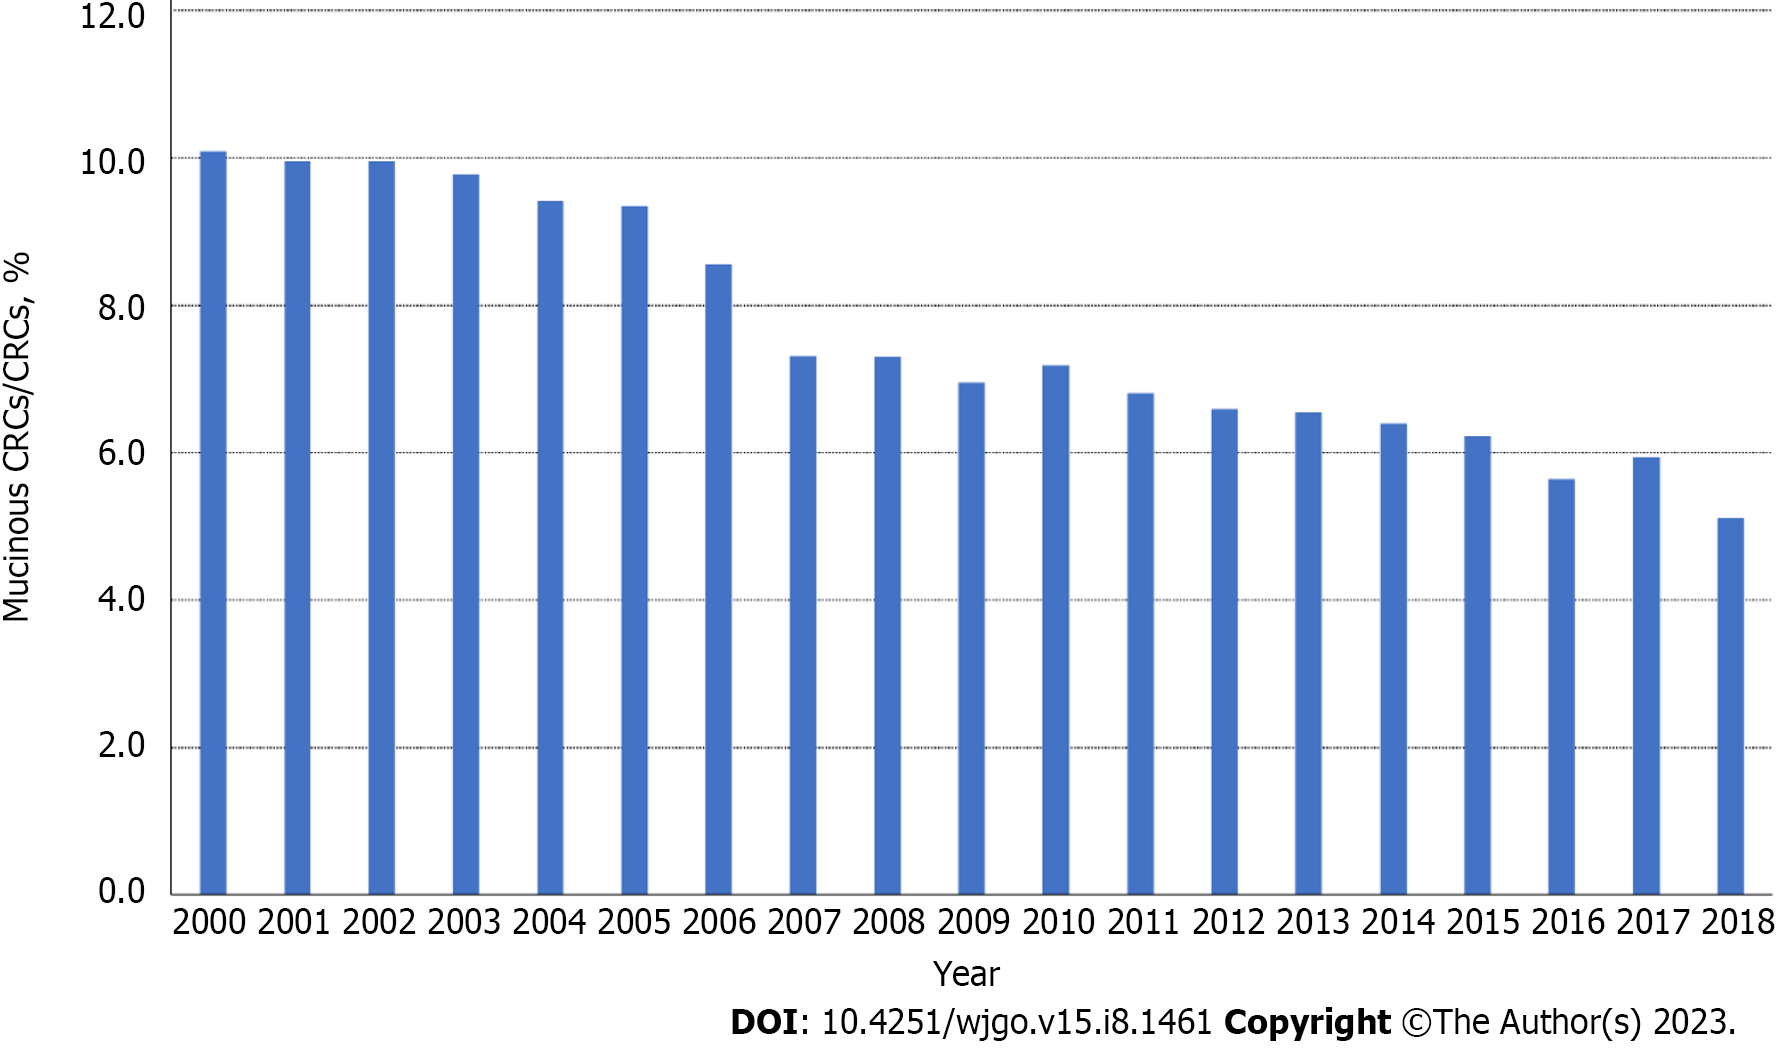
Figure 3 Proportion of mucinous colorectal cancer among all colorectal cancer cases.
CRC: Colorectal cancer.
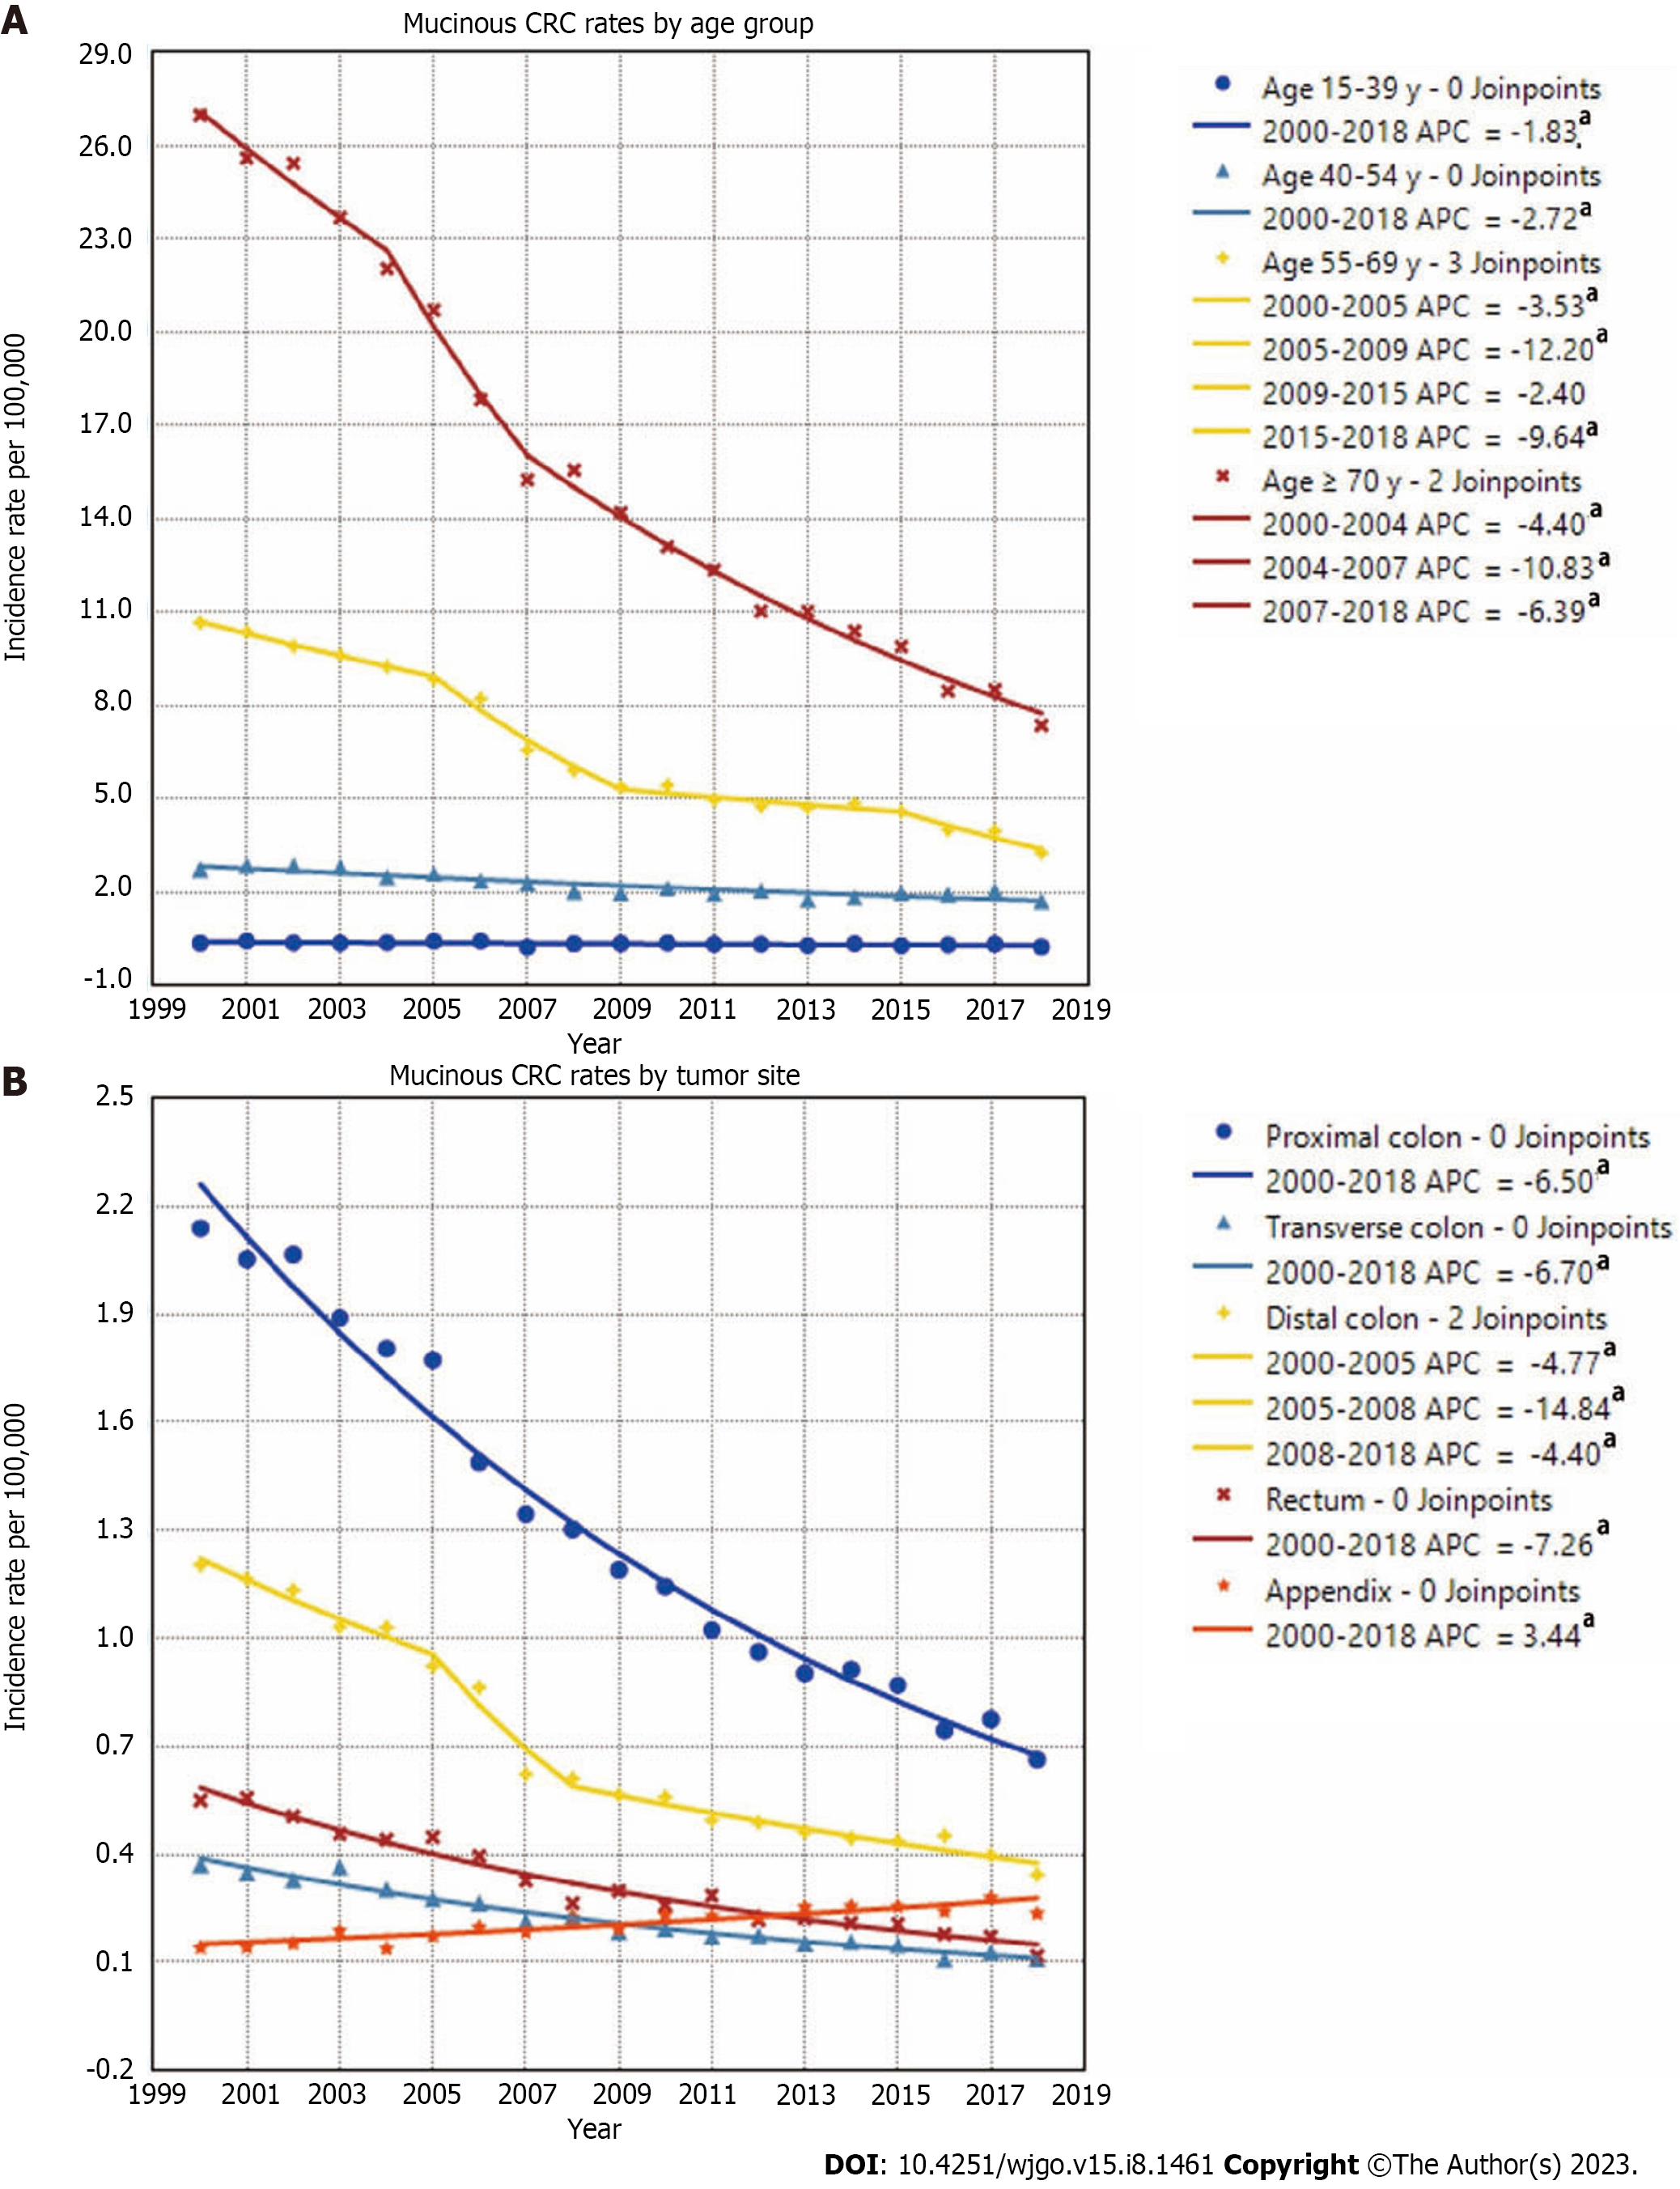
Figure 4 Age-adjusted incidence rate of mucinous colorectal cancer by age group and primary tumor site.
aThe annual percent change (APC) is significantly different from zero at alpha = 0.05. CRC: Colorectal cancer.
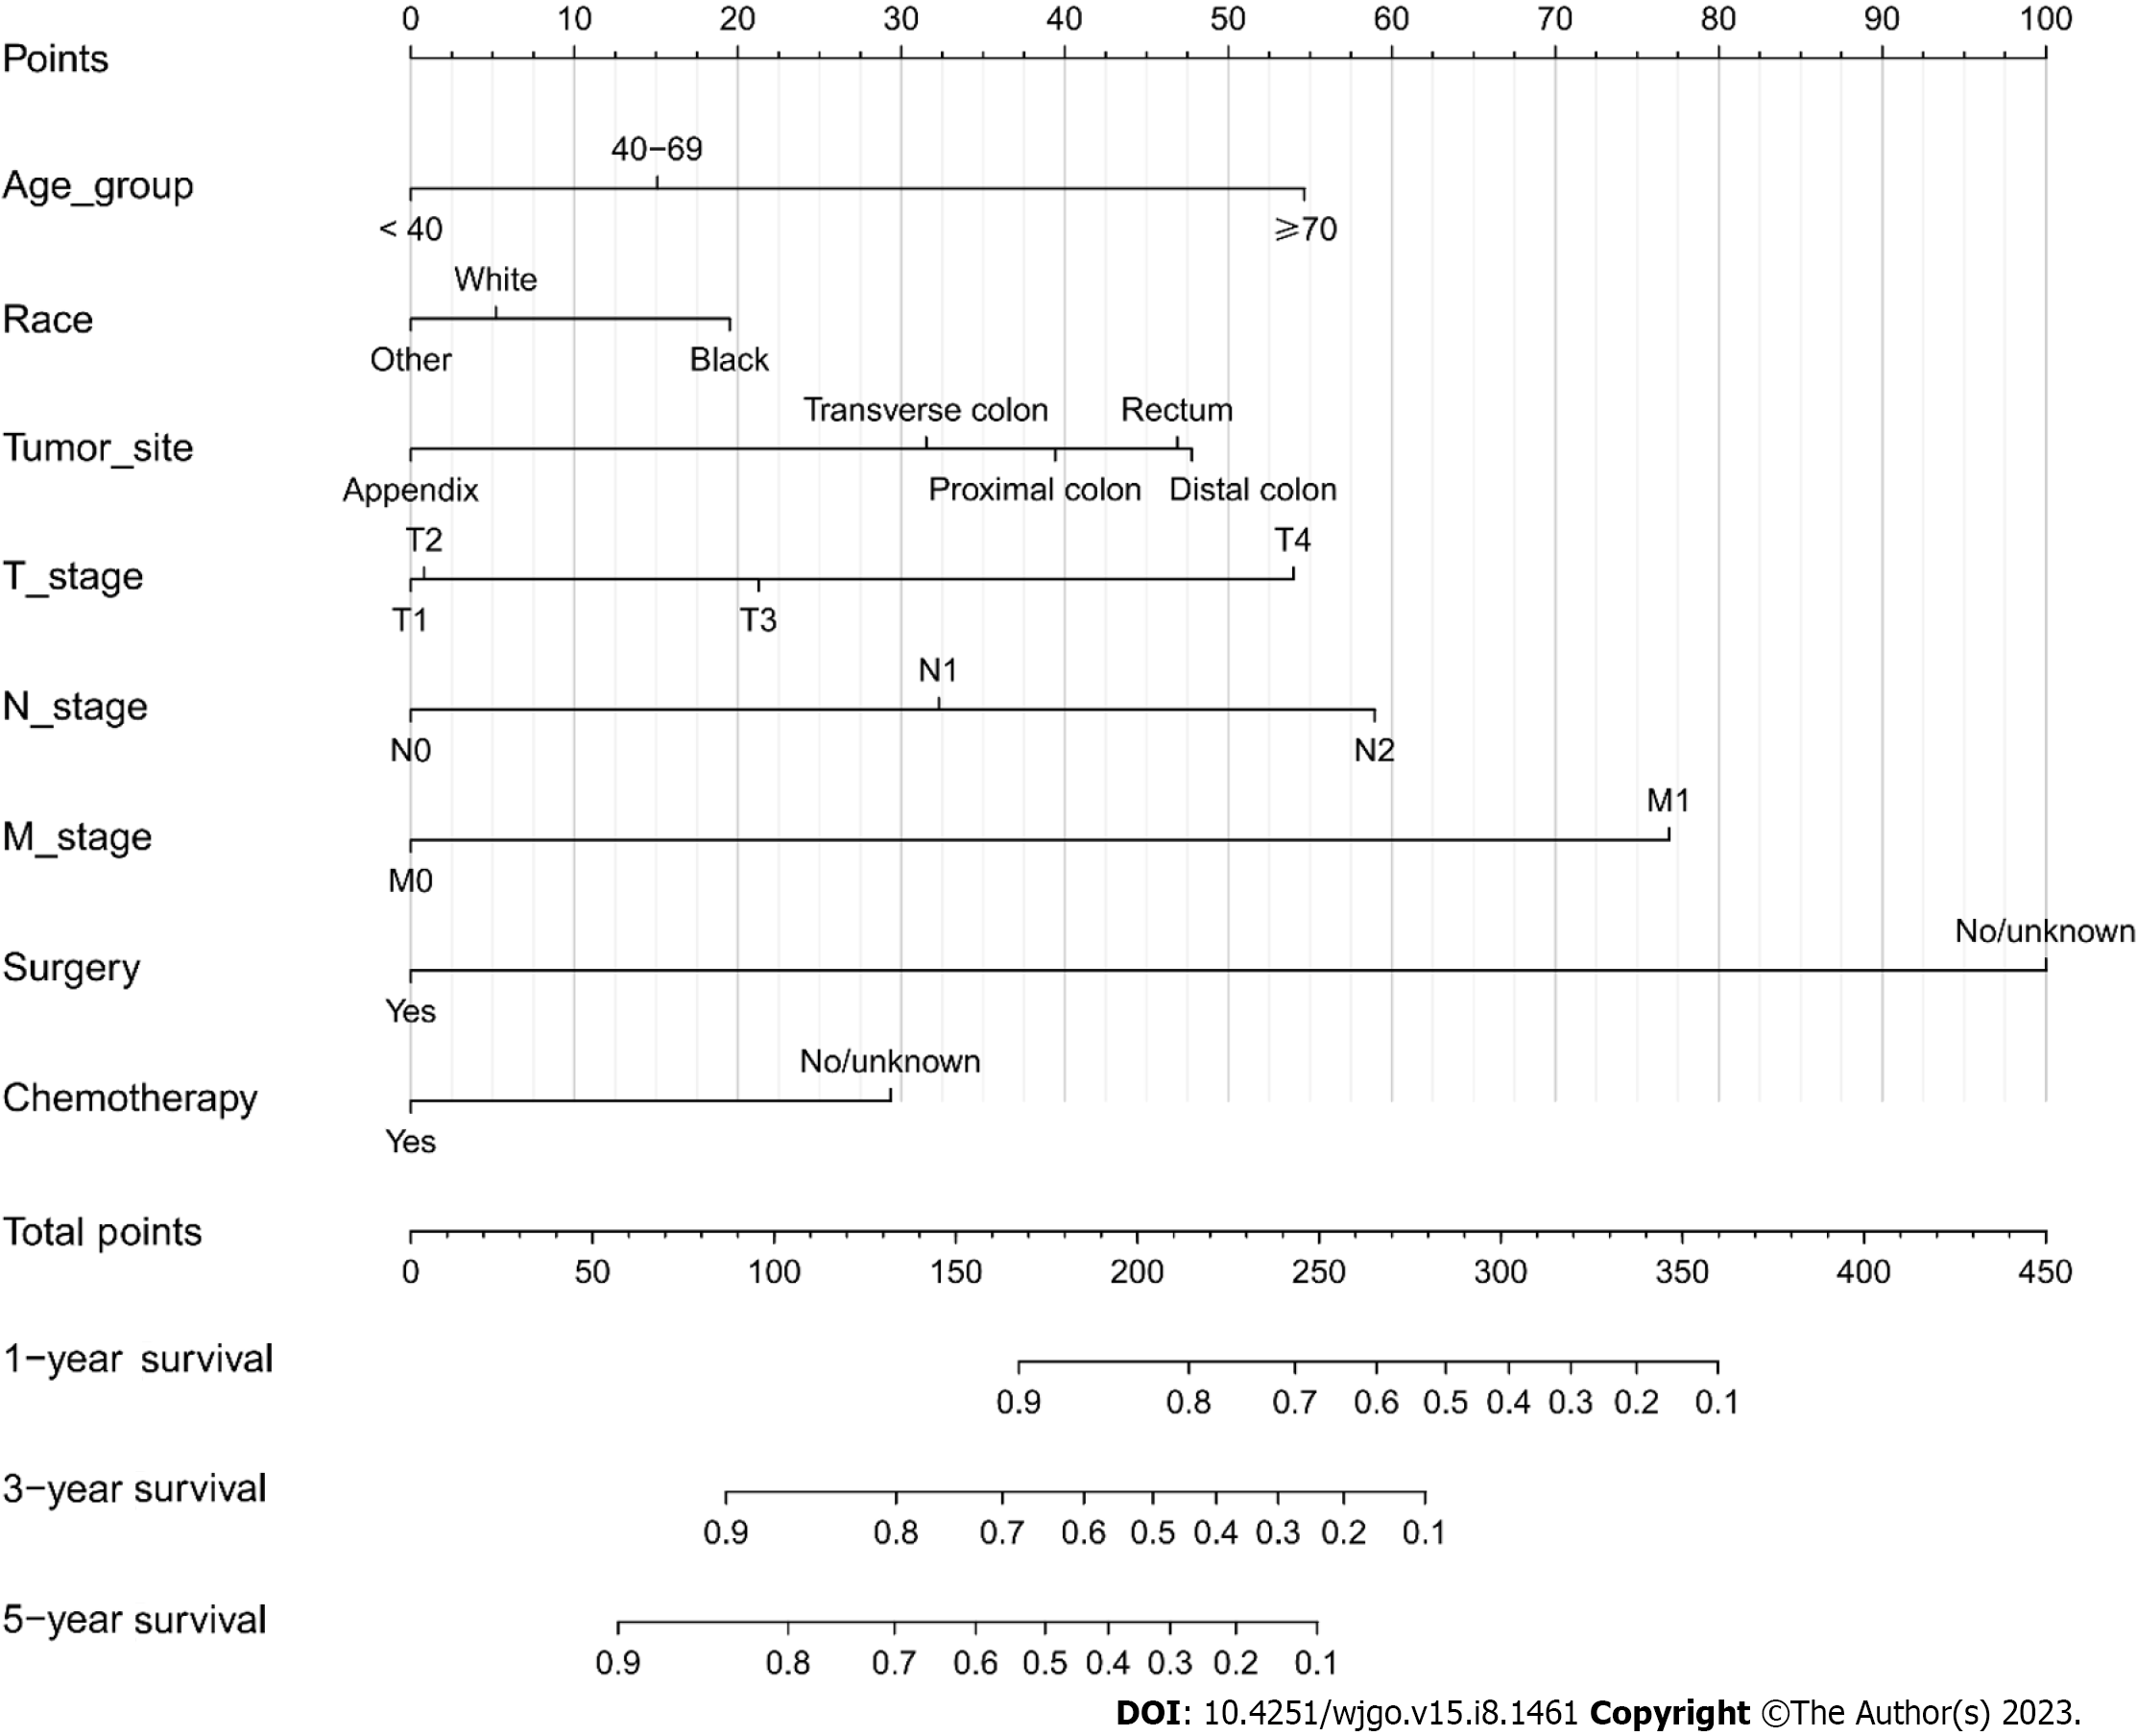
Figure 5 Nomogram for predicting the 1-year, 3-year, and 5-year overall survival in mucinous colorectal cancer.
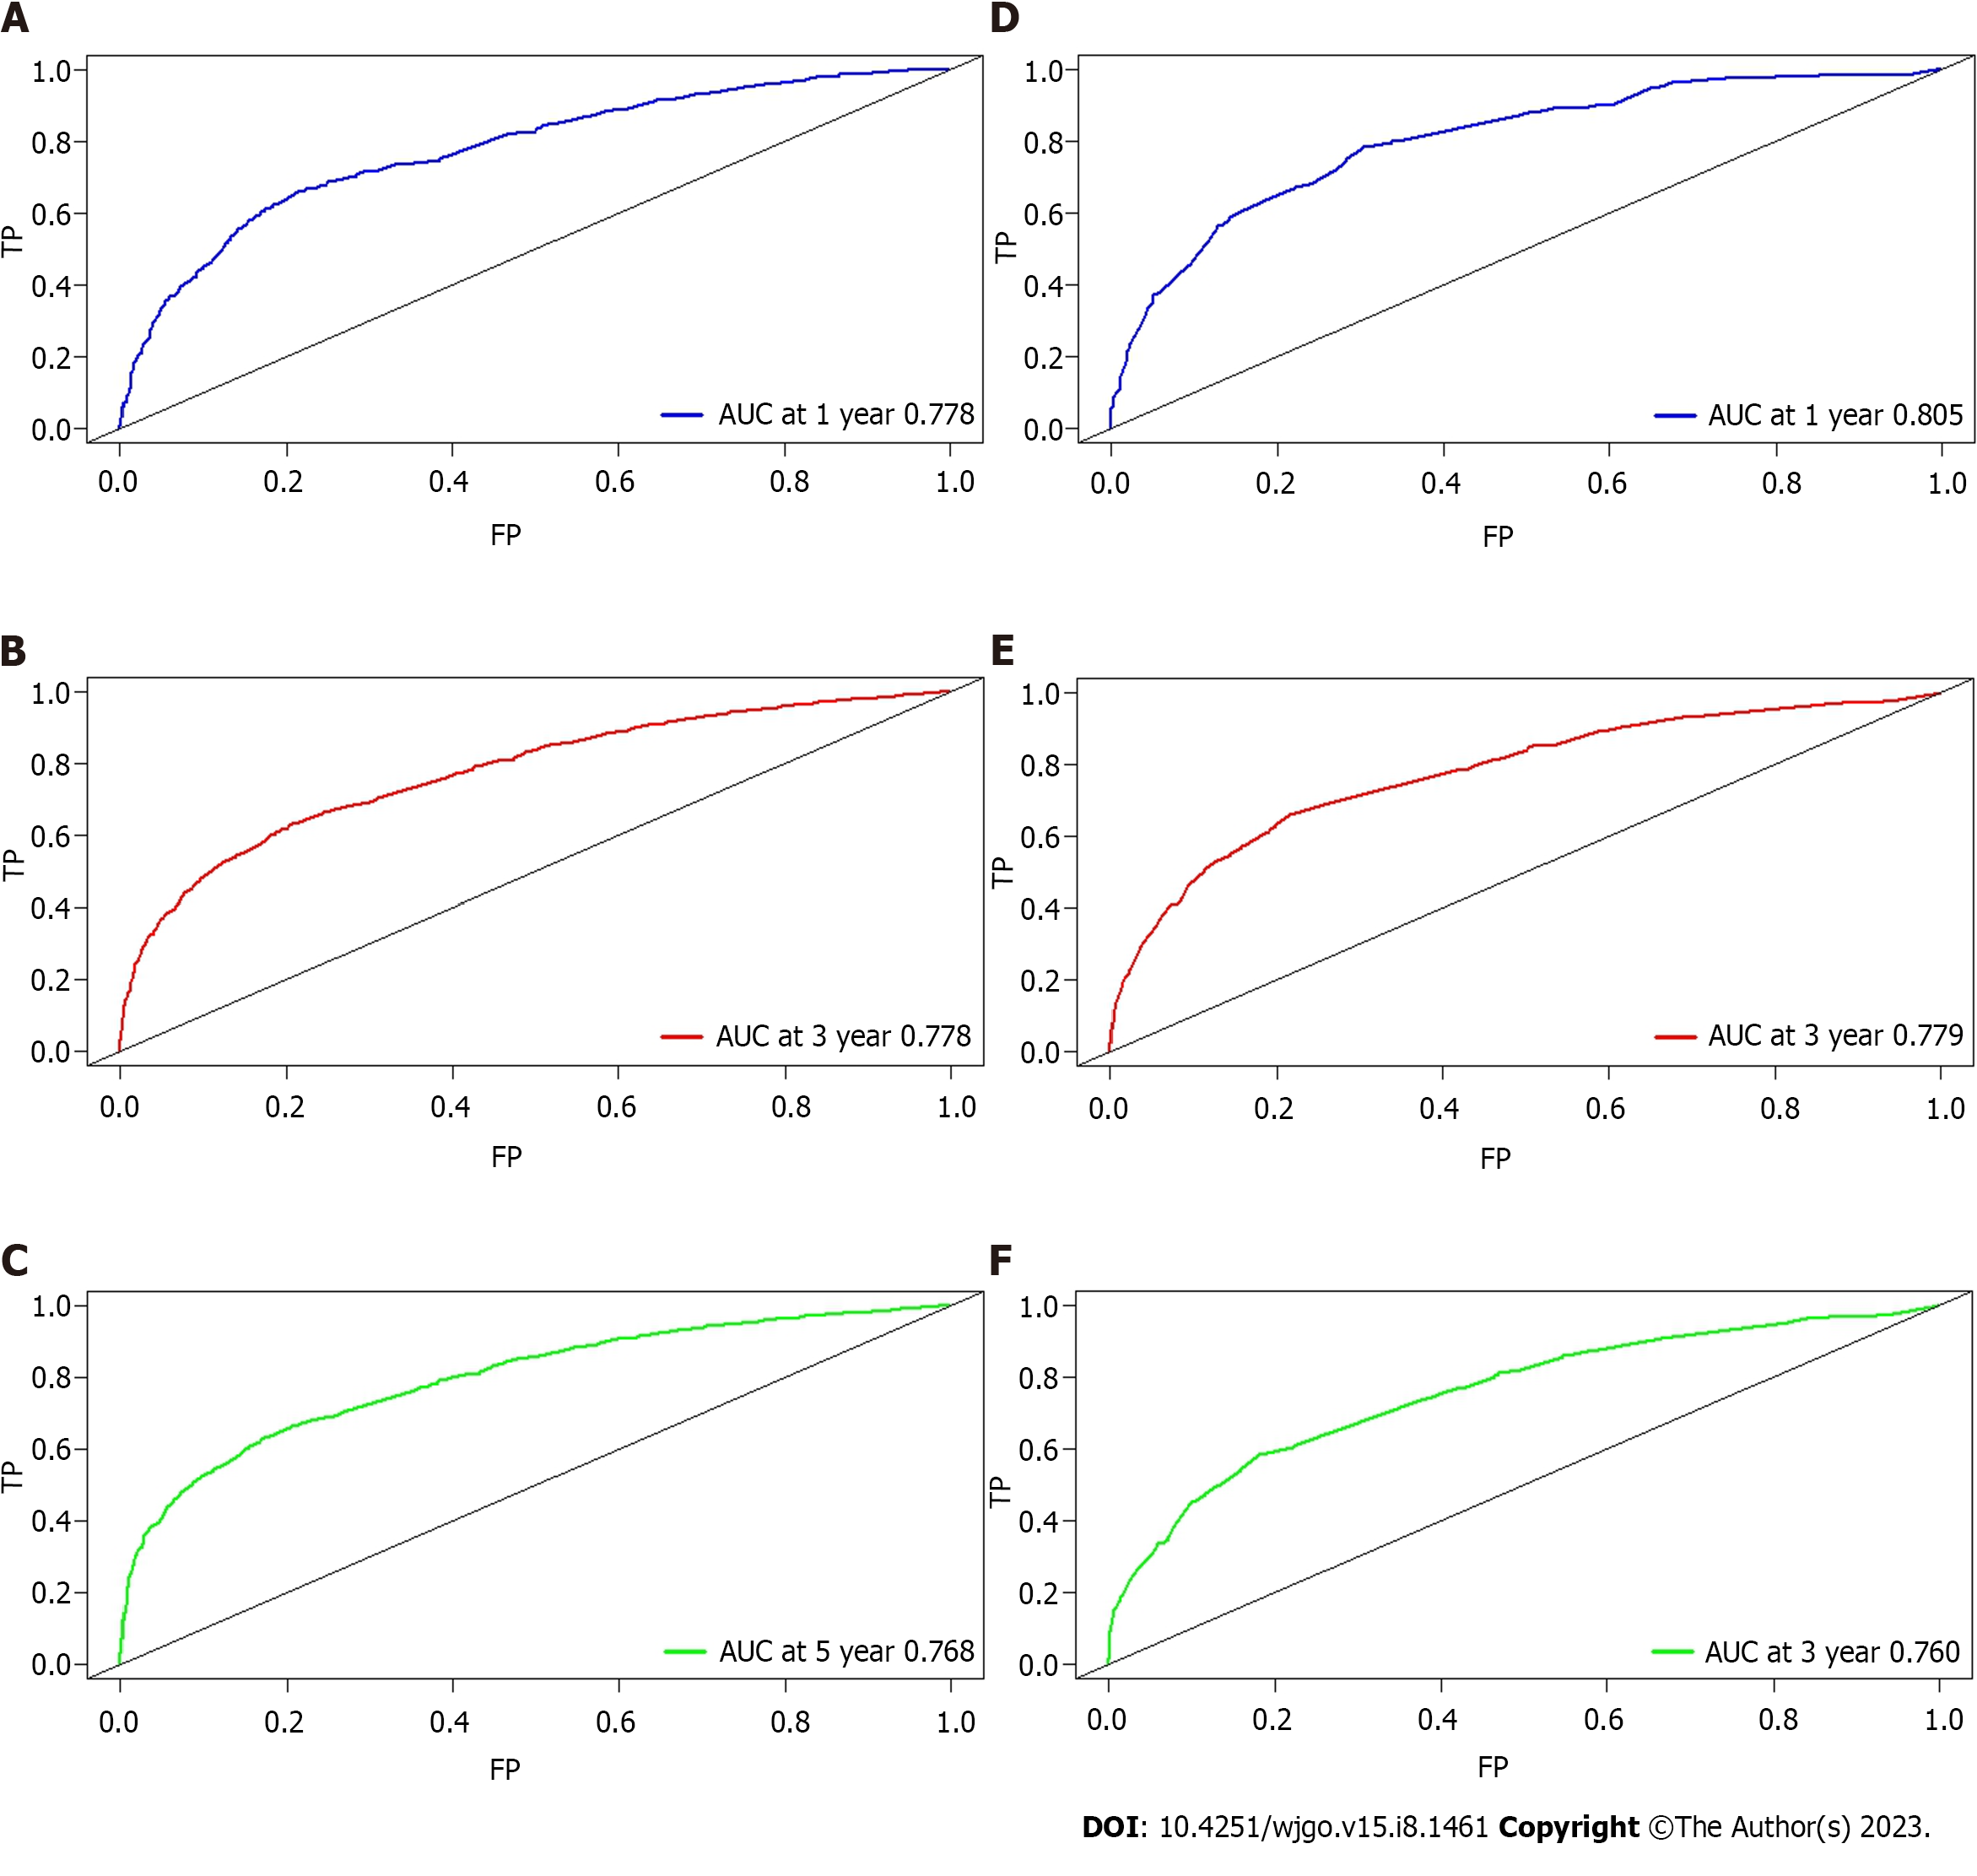
Figure 6 Receiver operating characteristics curve and area under the receiver operating characteristic curve.
A: Predicting 1-year overall survival (OS) in the training cohort; B: Predicting 3-year OS in the training cohort; C: Predicting 5-year OS in the training cohort; D: Predicting 1-year OS in the validation cohort; E: Predicting 3-year OS in the validation cohort; F: Predicting 5-year OS in the validation cohort. AUC: Area under the receiver operating characteristics curve; FP: False positive; TP: True positive.
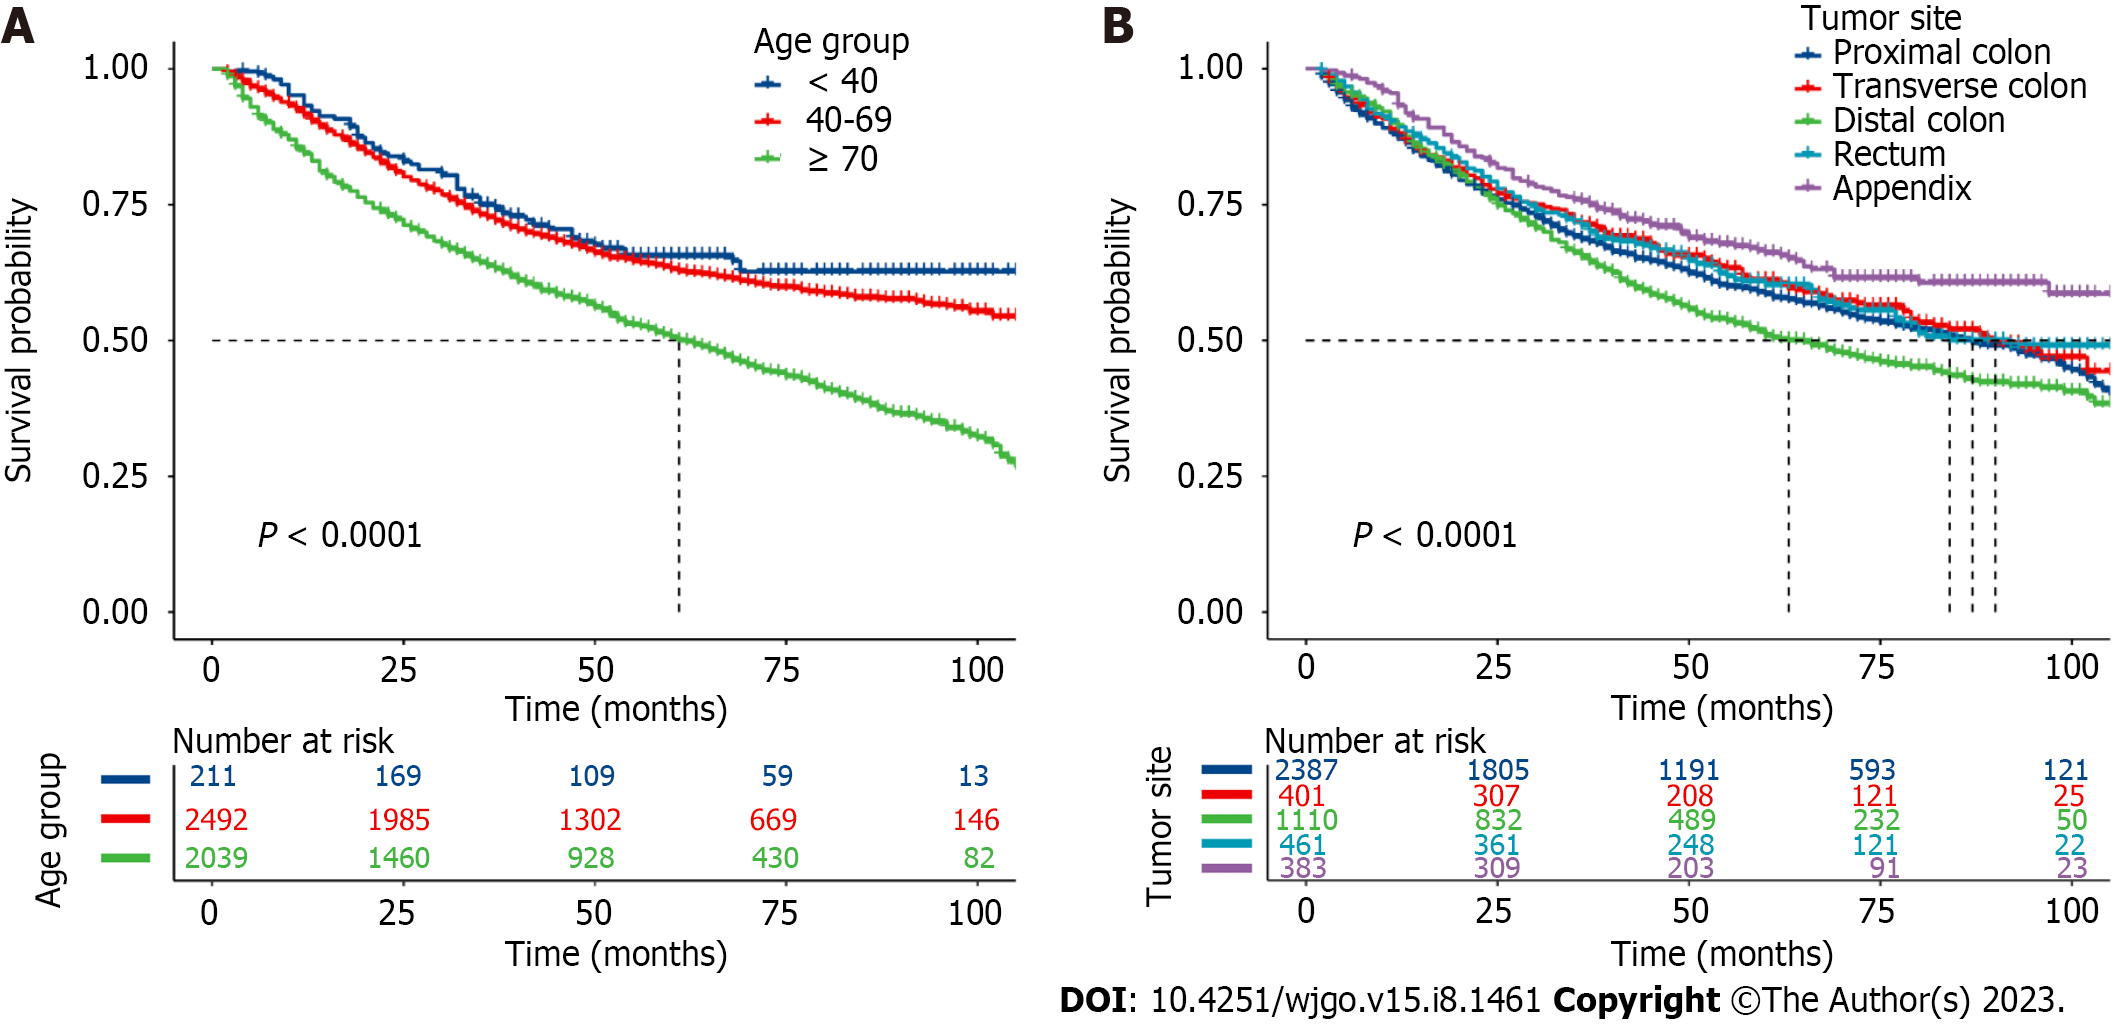
Figure 7 Kaplan–Meier survival curves for predicting overall survival for patients with mucinous colorectal cancer.
A: Survival probability over time by age group; B: Survival probability over time by tumor site.
- Citation: Jiang J, Tang XW, Huang S, Hu N, Chen Y, Luo B, Ren WS, Peng Y, Yang WX, Lü MH. Epidemiologic characteristics and risk factors associated with overall survival for patients with mucinous colorectal cancer: A population-based study. World J Gastrointest Oncol 2023; 15(8): 1461-1474
- URL: https://www.wjgnet.com/1948-5204/full/v15/i8/1461.htm
- DOI: https://dx.doi.org/10.4251/wjgo.v15.i8.1461


