Copyright
©The Author(s) 2023.
World J Gastrointest Oncol. Jul 15, 2023; 15(7): 1241-1252
Published online Jul 15, 2023. doi: 10.4251/wjgo.v15.i7.1241
Published online Jul 15, 2023. doi: 10.4251/wjgo.v15.i7.1241
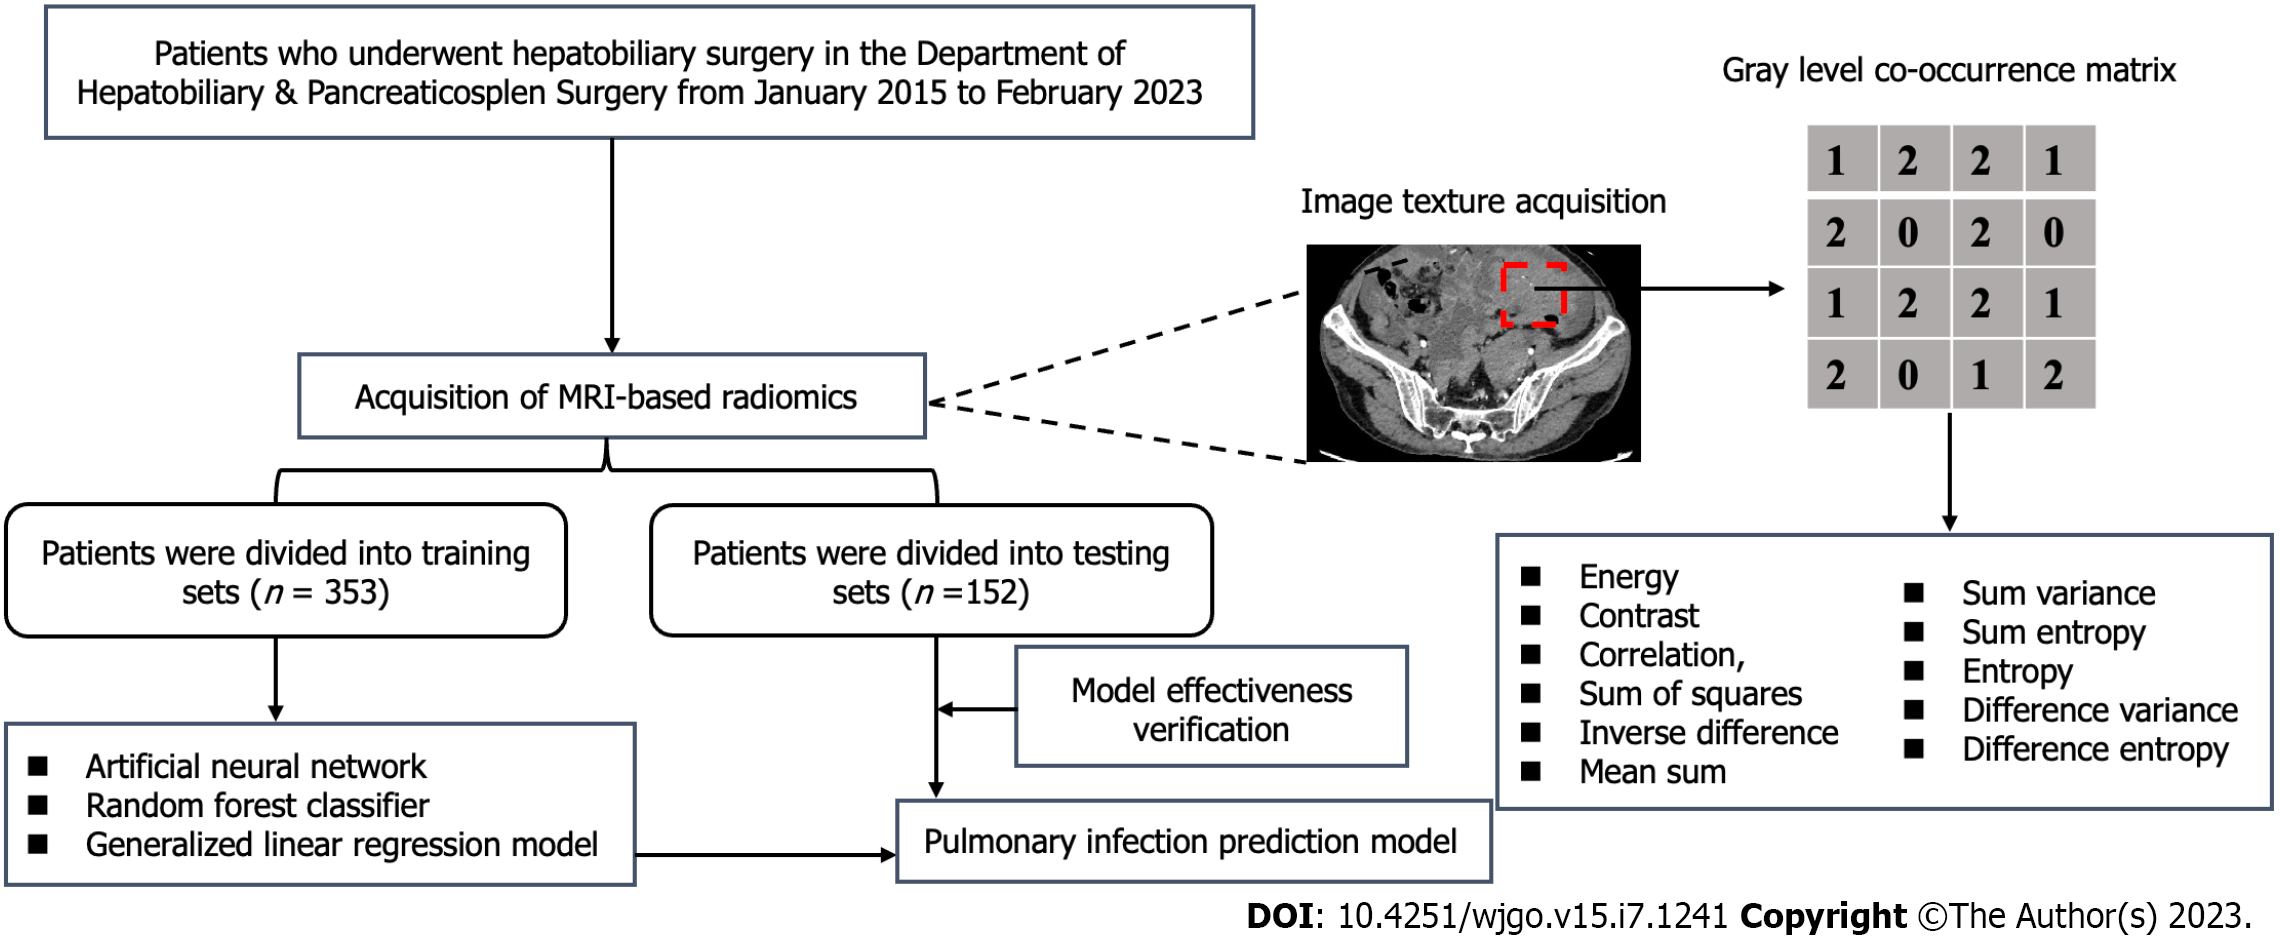
Figure 1 Flow chart of patient selection and data process.
MRI: Magnetic resonance imaging.
Figure 2 Predictor variable selection based on the least absolute shrinkage and selection operator regression method.
A: Optimal parameter (lambda) selection in the least absolute shrinkage and selection operator (least absolute shrinkage and selection operator) model; B: Least absolute shrinkage and selection operator coefficient profiles of the candidate features.
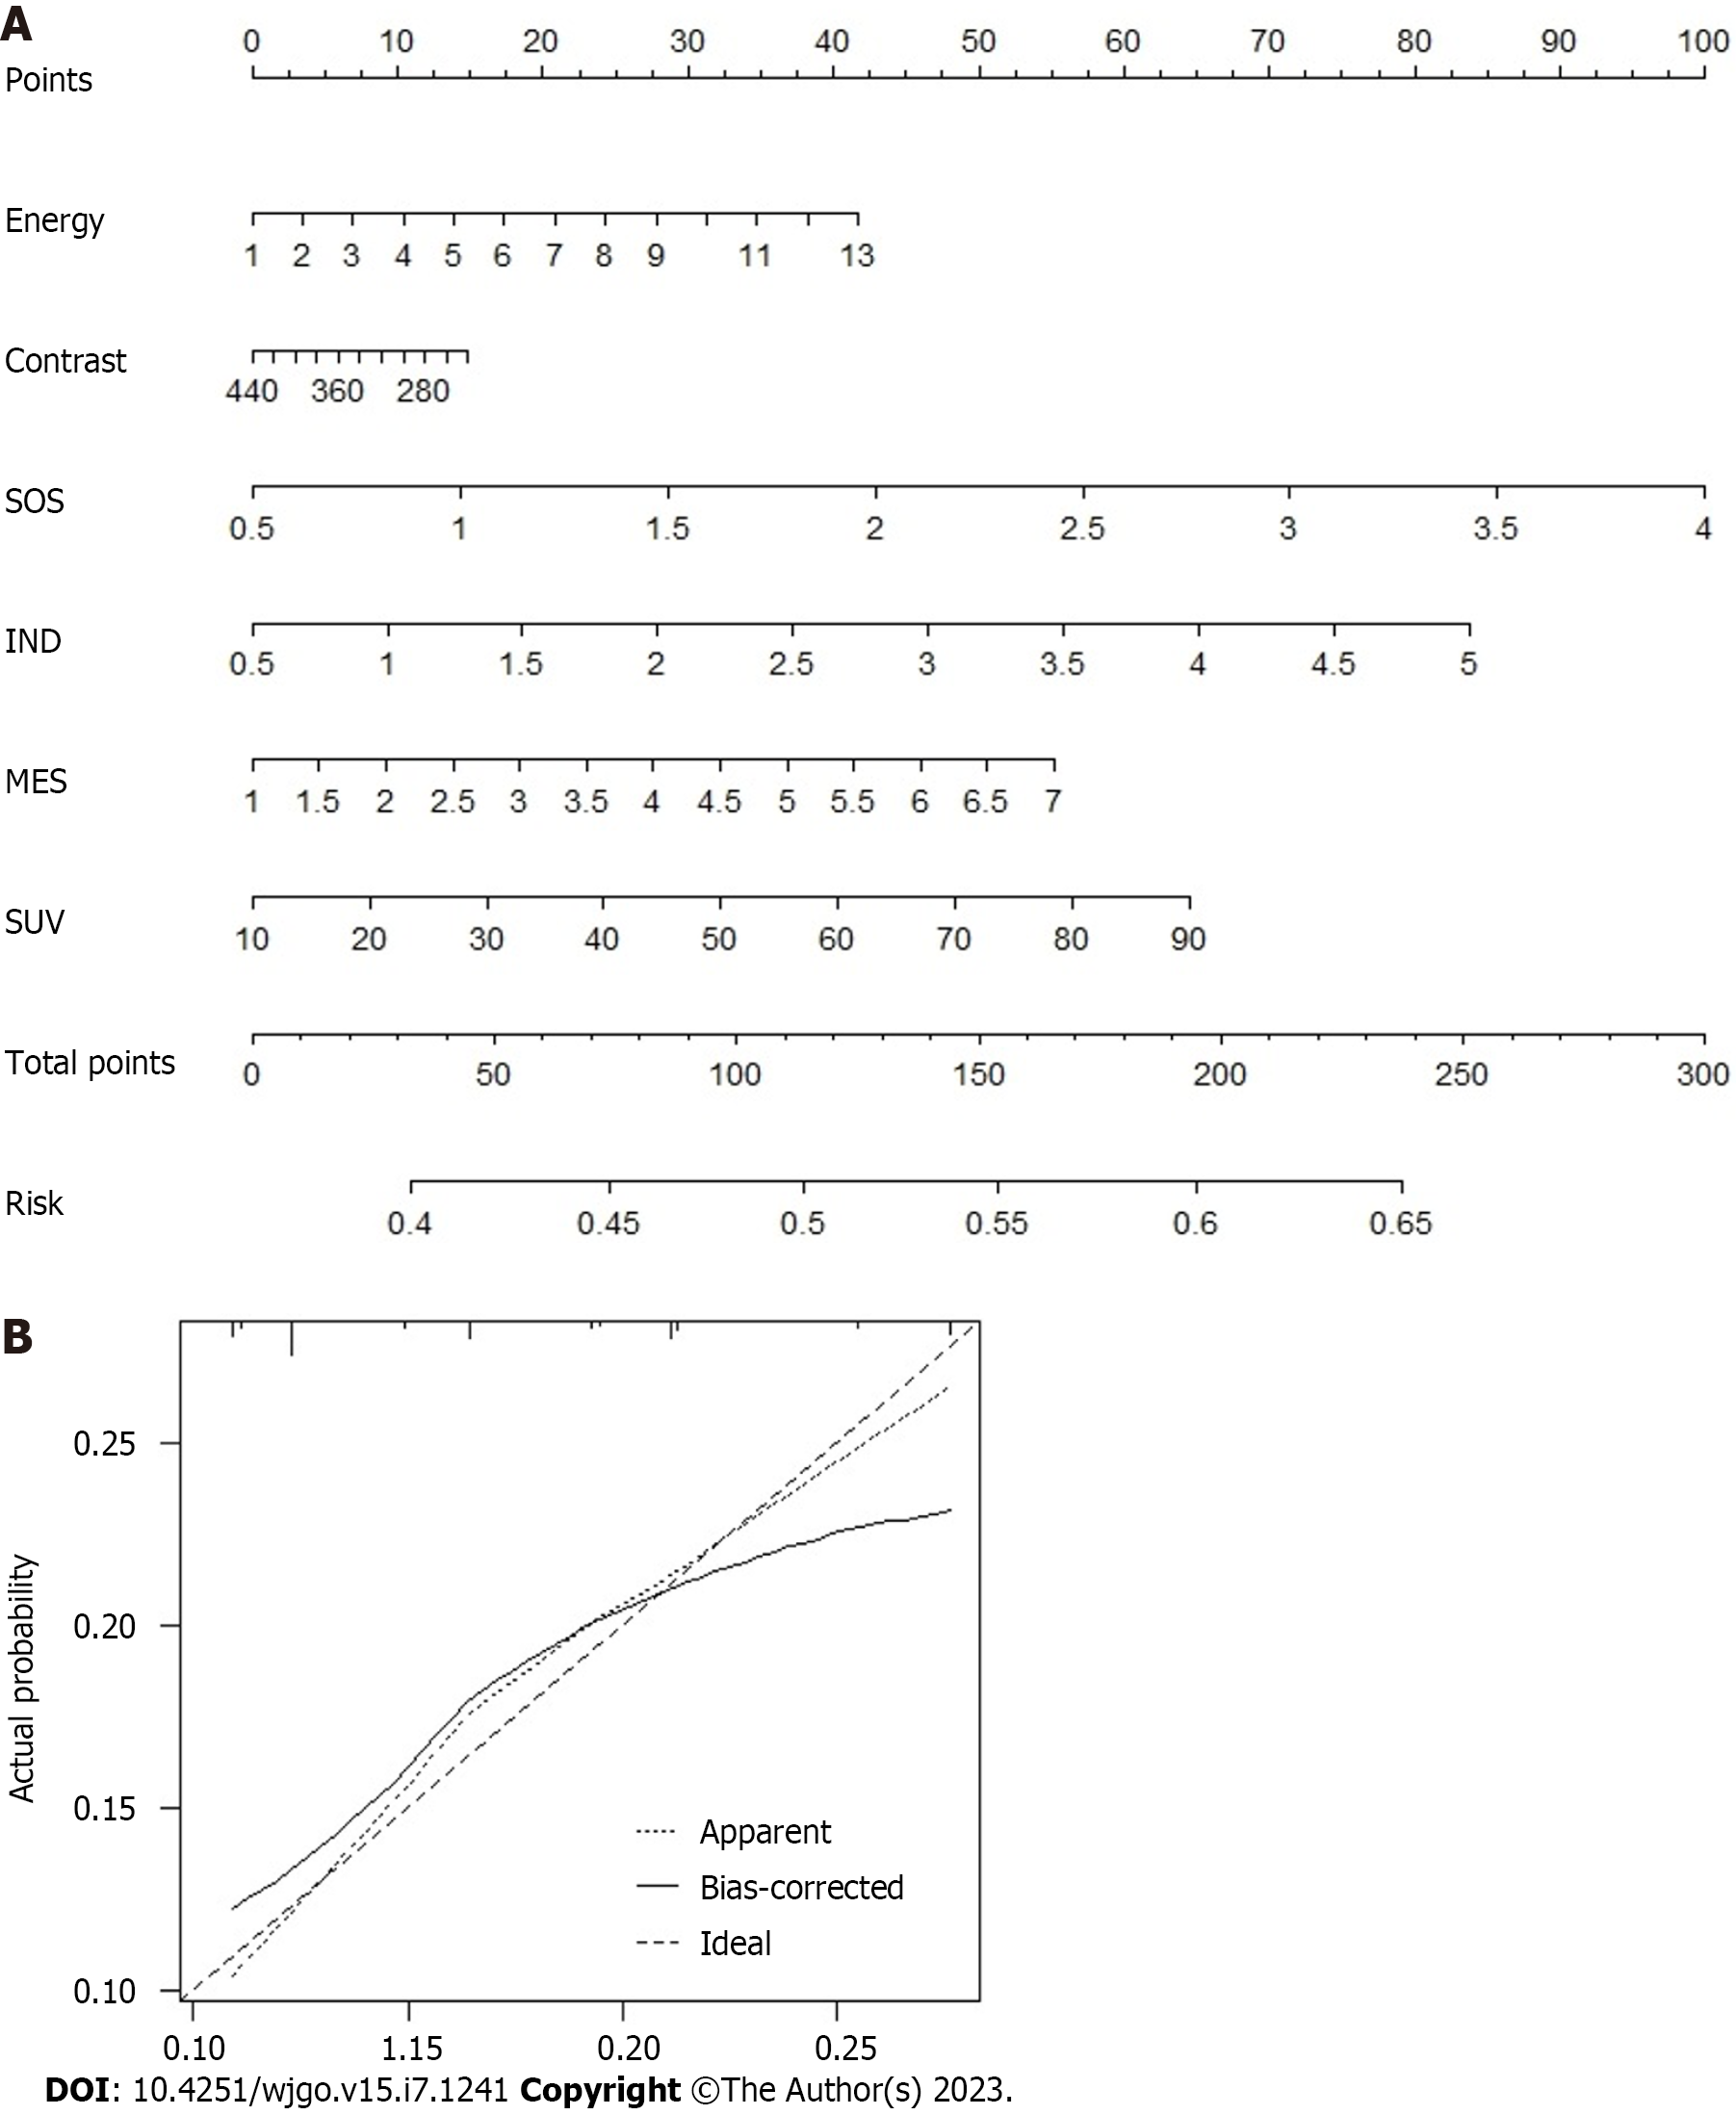
Figure 3 Nomogram prediction model for predicting pulmonary infection in patients with primary hepatic carcinoma undergoing hepatectomy.
A: Nomogram predicts risk of pulmonary infection; B: Calibration curves for the nomogram. SOS: Sum of squares; IND: Inverse difference; MES: Mean sum; SUV: Sum variance.
Figure 4 Construction of pulmonary infection prediction model via the random forest model and artificial neural network model.
A: Random forest model. The application prediction model formula of the random forest model is as follows: C = argmax (∑(Ci)), where Ci represents the type of in prediction for the i-th tree, C is the final classification result, and I is the number of trees; B: Artificial neural network model. The formula of the artificial neural network model is as follows: θ = θ−η × ▽ (θ). J (θ) among them η is the learning rate, so (θ). J (θ) represents the gradient change of the loss function [i.e., J(θ)]. AFP: Alpha-fetoprotein; BMI: Body mass index; DIE: Difference entropy; DIV: Difference variance; HBV: Hepatitis B virus; IND: Inverse difference; LNM: Lymph node metastasis; MES: Mean sum; SOS: Sum of squares; SUE: Sum entropy; SUV: Sum variance.
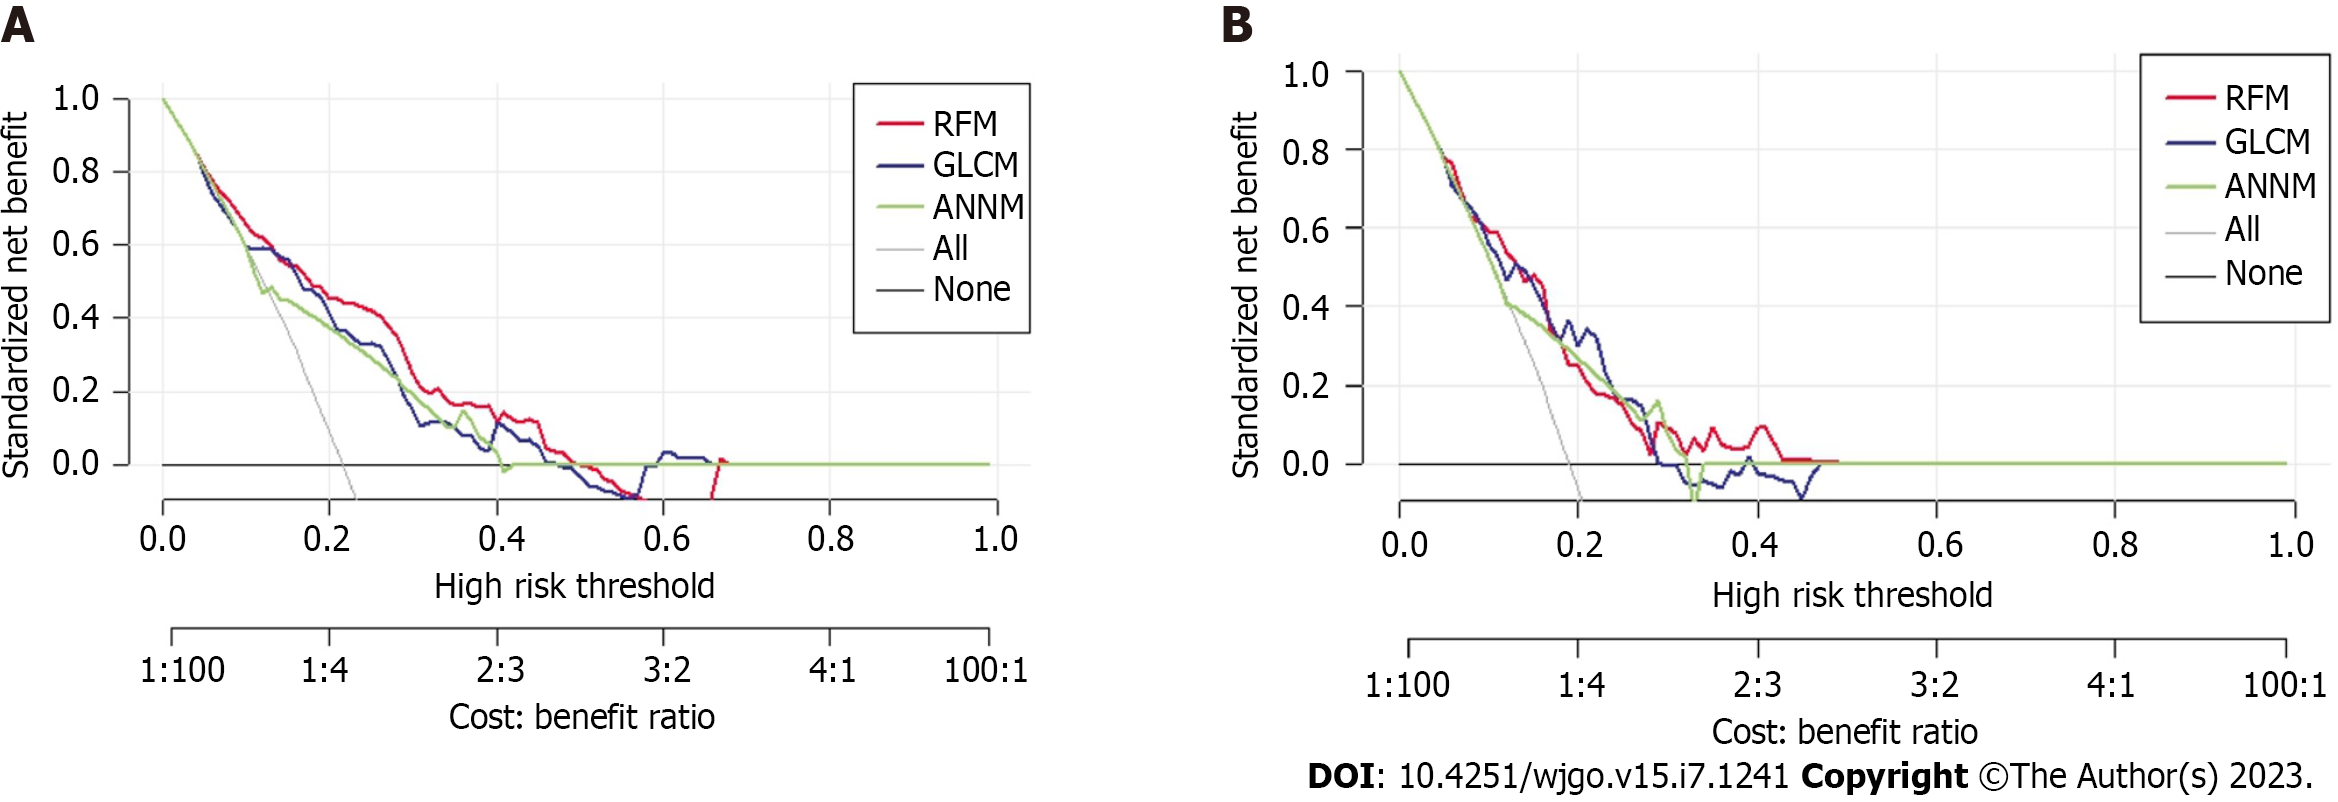
Figure 5 Prediction performance of pulmonary infection risk based on different supervised algorithm.
A: Decision curve analysis for three prediction models in the training set; B: Decision curve analysis for three prediction models in the testing set. ANNM: Artificial neural network model; GLRM: Generalized linear regression model; RFM: Random forest model.
- Citation: Lu C, Xing ZX, Xia XG, Long ZD, Chen B, Zhou P, Wang R. Development and validation of a postoperative pulmonary infection prediction model for patients with primary hepatic carcinoma. World J Gastrointest Oncol 2023; 15(7): 1241-1252
- URL: https://www.wjgnet.com/1948-5204/full/v15/i7/1241.htm
- DOI: https://dx.doi.org/10.4251/wjgo.v15.i7.1241


