Copyright
©The Author(s) 2023.
World J Gastrointest Oncol. Jul 15, 2023; 15(7): 1227-1240
Published online Jul 15, 2023. doi: 10.4251/wjgo.v15.i7.1227
Published online Jul 15, 2023. doi: 10.4251/wjgo.v15.i7.1227
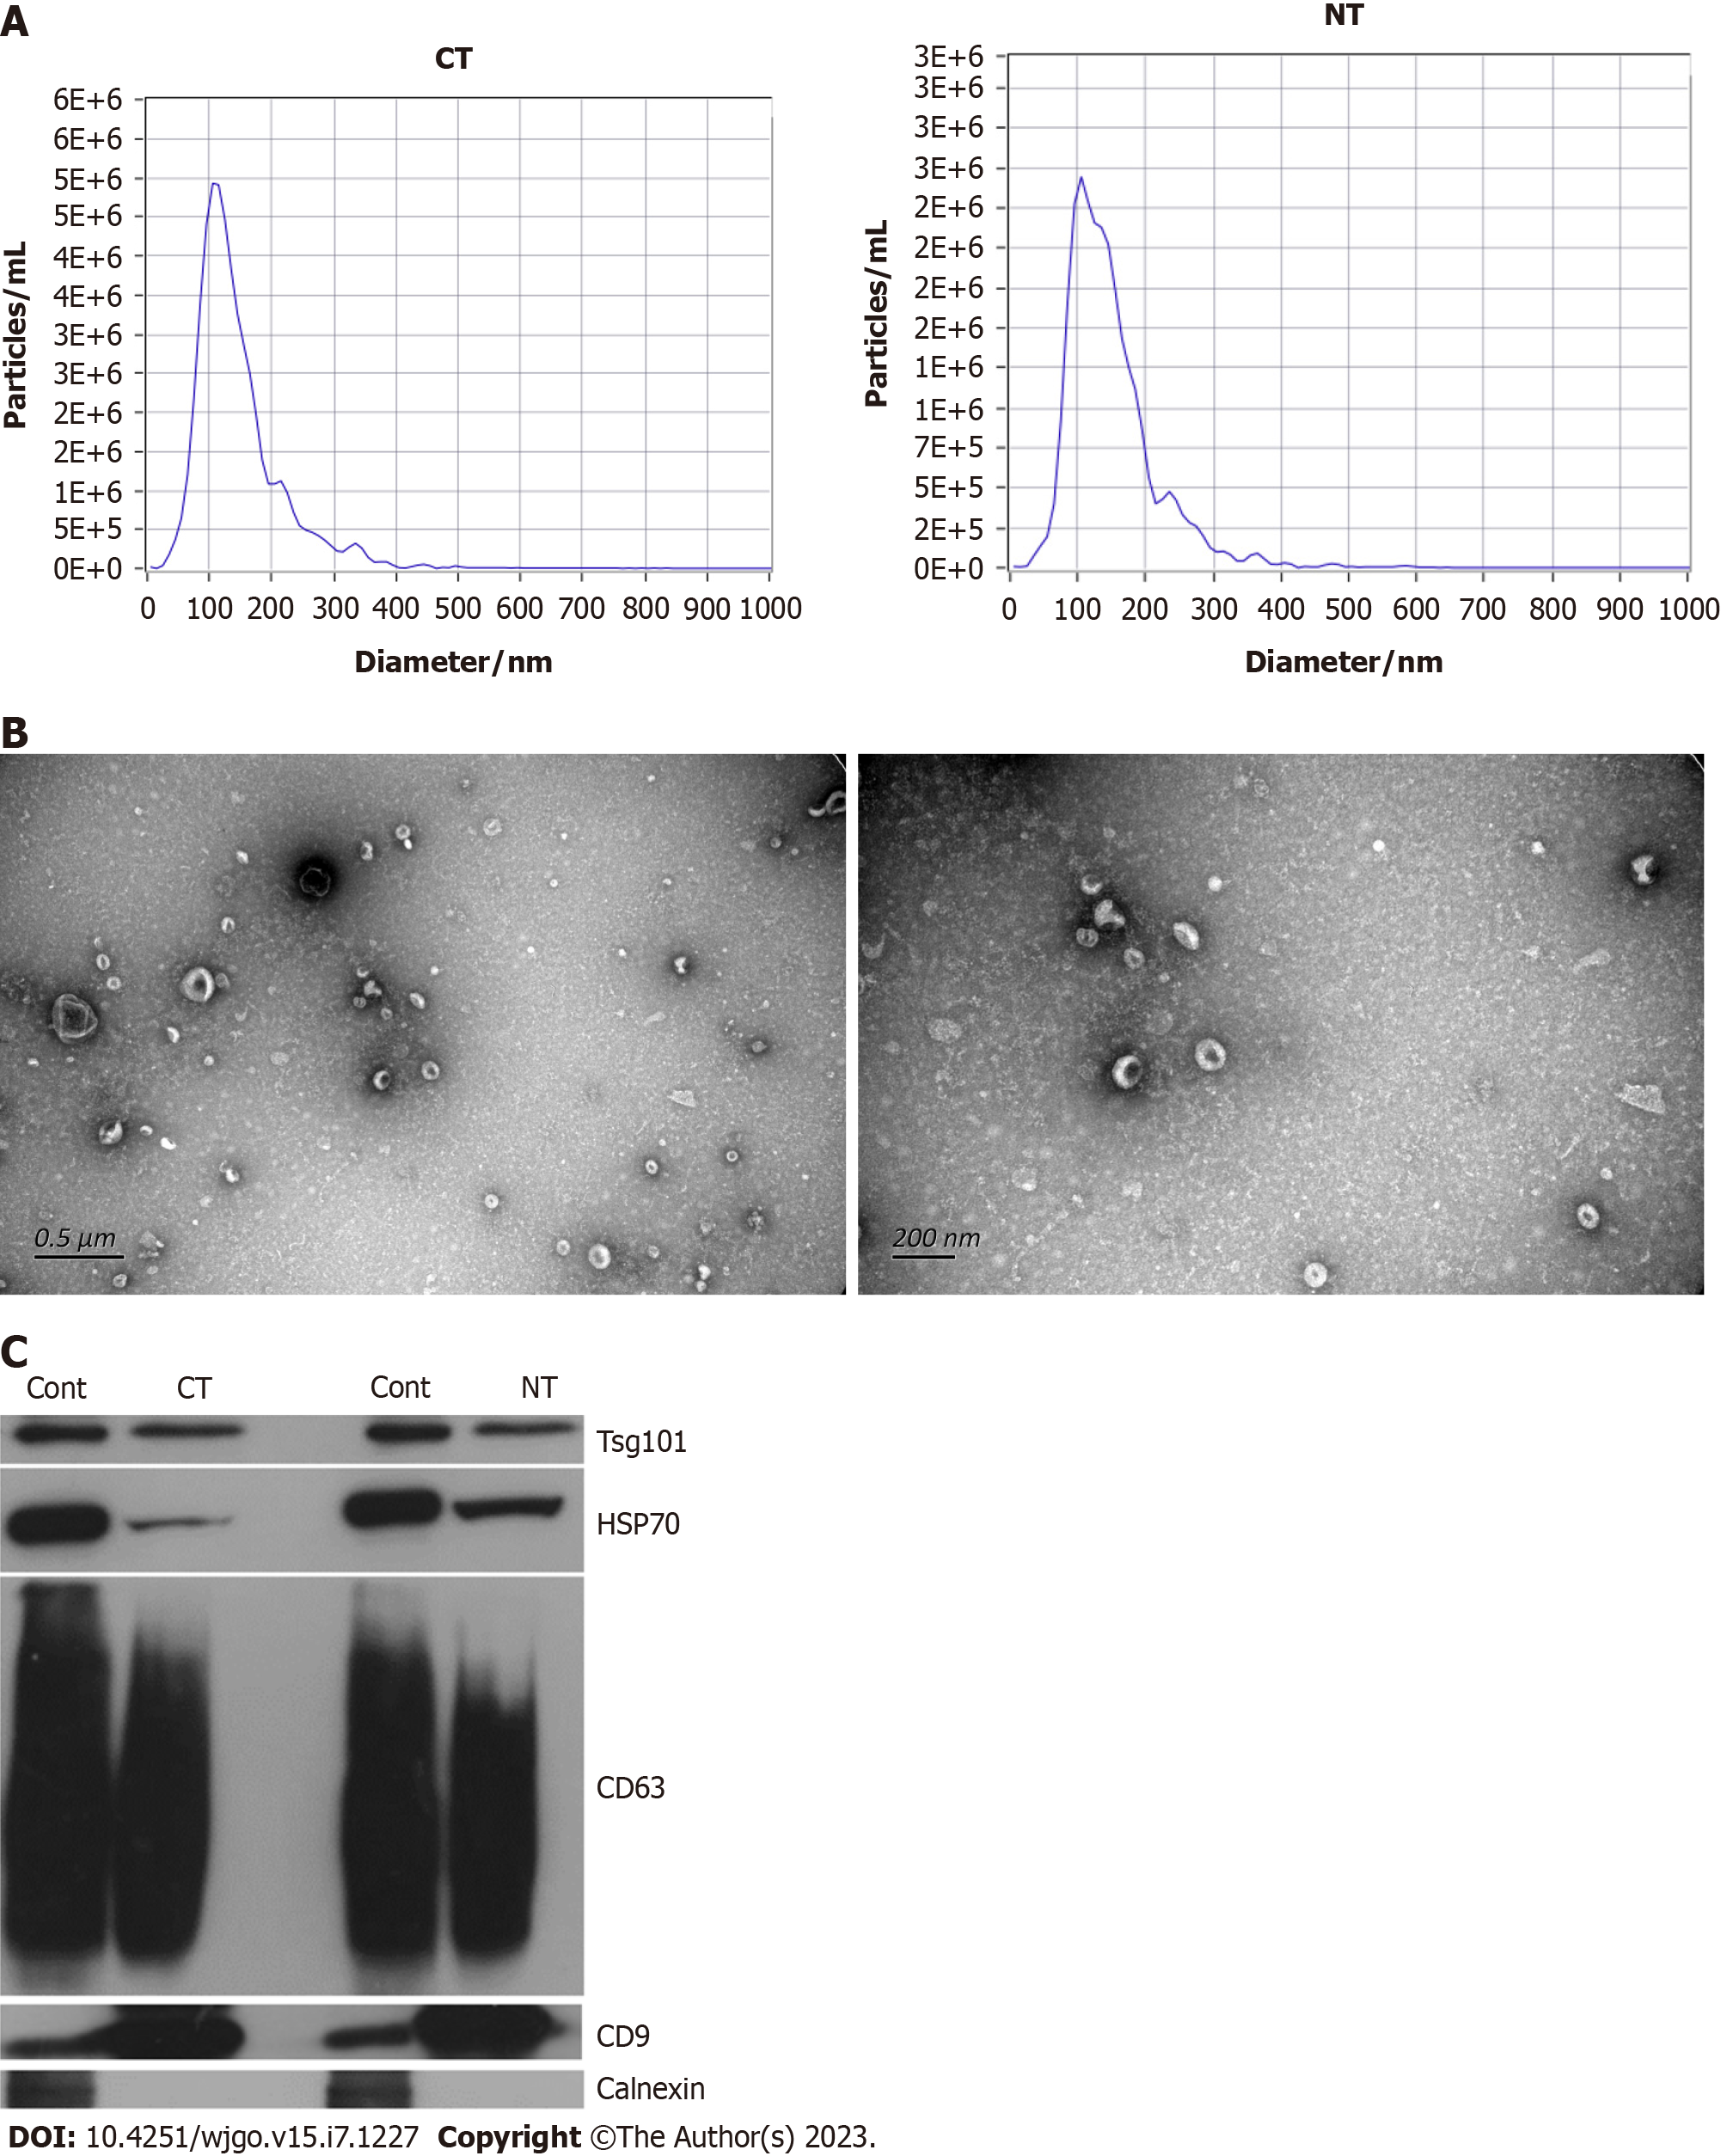
Figure 1 Characteristics of tissue exosomes.
A: Nanoparticle tracking analysis of colorectal cancer tissue exosomes and normal intestinal tissue exosomes; B: Transmission electron microscopy of normal intestinal exosomes observed at the scales of 0.5 μm and 200 μm; C: Western blot analysis of colorectal cancer tissue exosomes and normal intestinal tissue exosomes, compared with the positive control. CT: Colorectal cancer tissues; NT: Normal intestinal tissues; Cont: Control.
Figure 2 Quantitative proteomic signature and bioinformatic analysis of colorectal cancer.
A: The Venn diagram shows detected proteins in colorectal cancer tissue exosomes and normal intestinal tissue exosomes; B: Principal component analysis of colorectal cancer tissue exosomes and normal intestinal tissue exosomes; C: The bar chart shows 128 significantly upregulated proteins and 155 significantly downregulated proteins between colorectal cancer tissue exosomes and normal intestinal tissue exosomes; D: The volcano plot shows differentially expressed proteins between colorectal cancer tissue exosomes and normal intestinal tissue exosomes; E: The heat map shows differentially expressed proteins between colorectal cancer tissue exosomes and normal intestinal tissue exosomes; F: Clusters of Orthologous Groups analysis shows 25 categories constituted by all the detected exosomal proteins; G: Gene ontology analysis shows that differentially expressed proteins are involved in biological processes, cellular components, and molecular functions; Kyoto encyclopedia of genes and genomes analysis shows that differentially expressed proteins are clustered in multiple pathways. CT: Colorectal cancer tissues; NT: Normal intestinal tissues; PC: Principal component; NotSig: COG: Clusters of Orthologous Groups; GO: Gene ontology; KEGG: Kyoto encyclopedia of genes and genomes; ECM: Extracellular matrix.
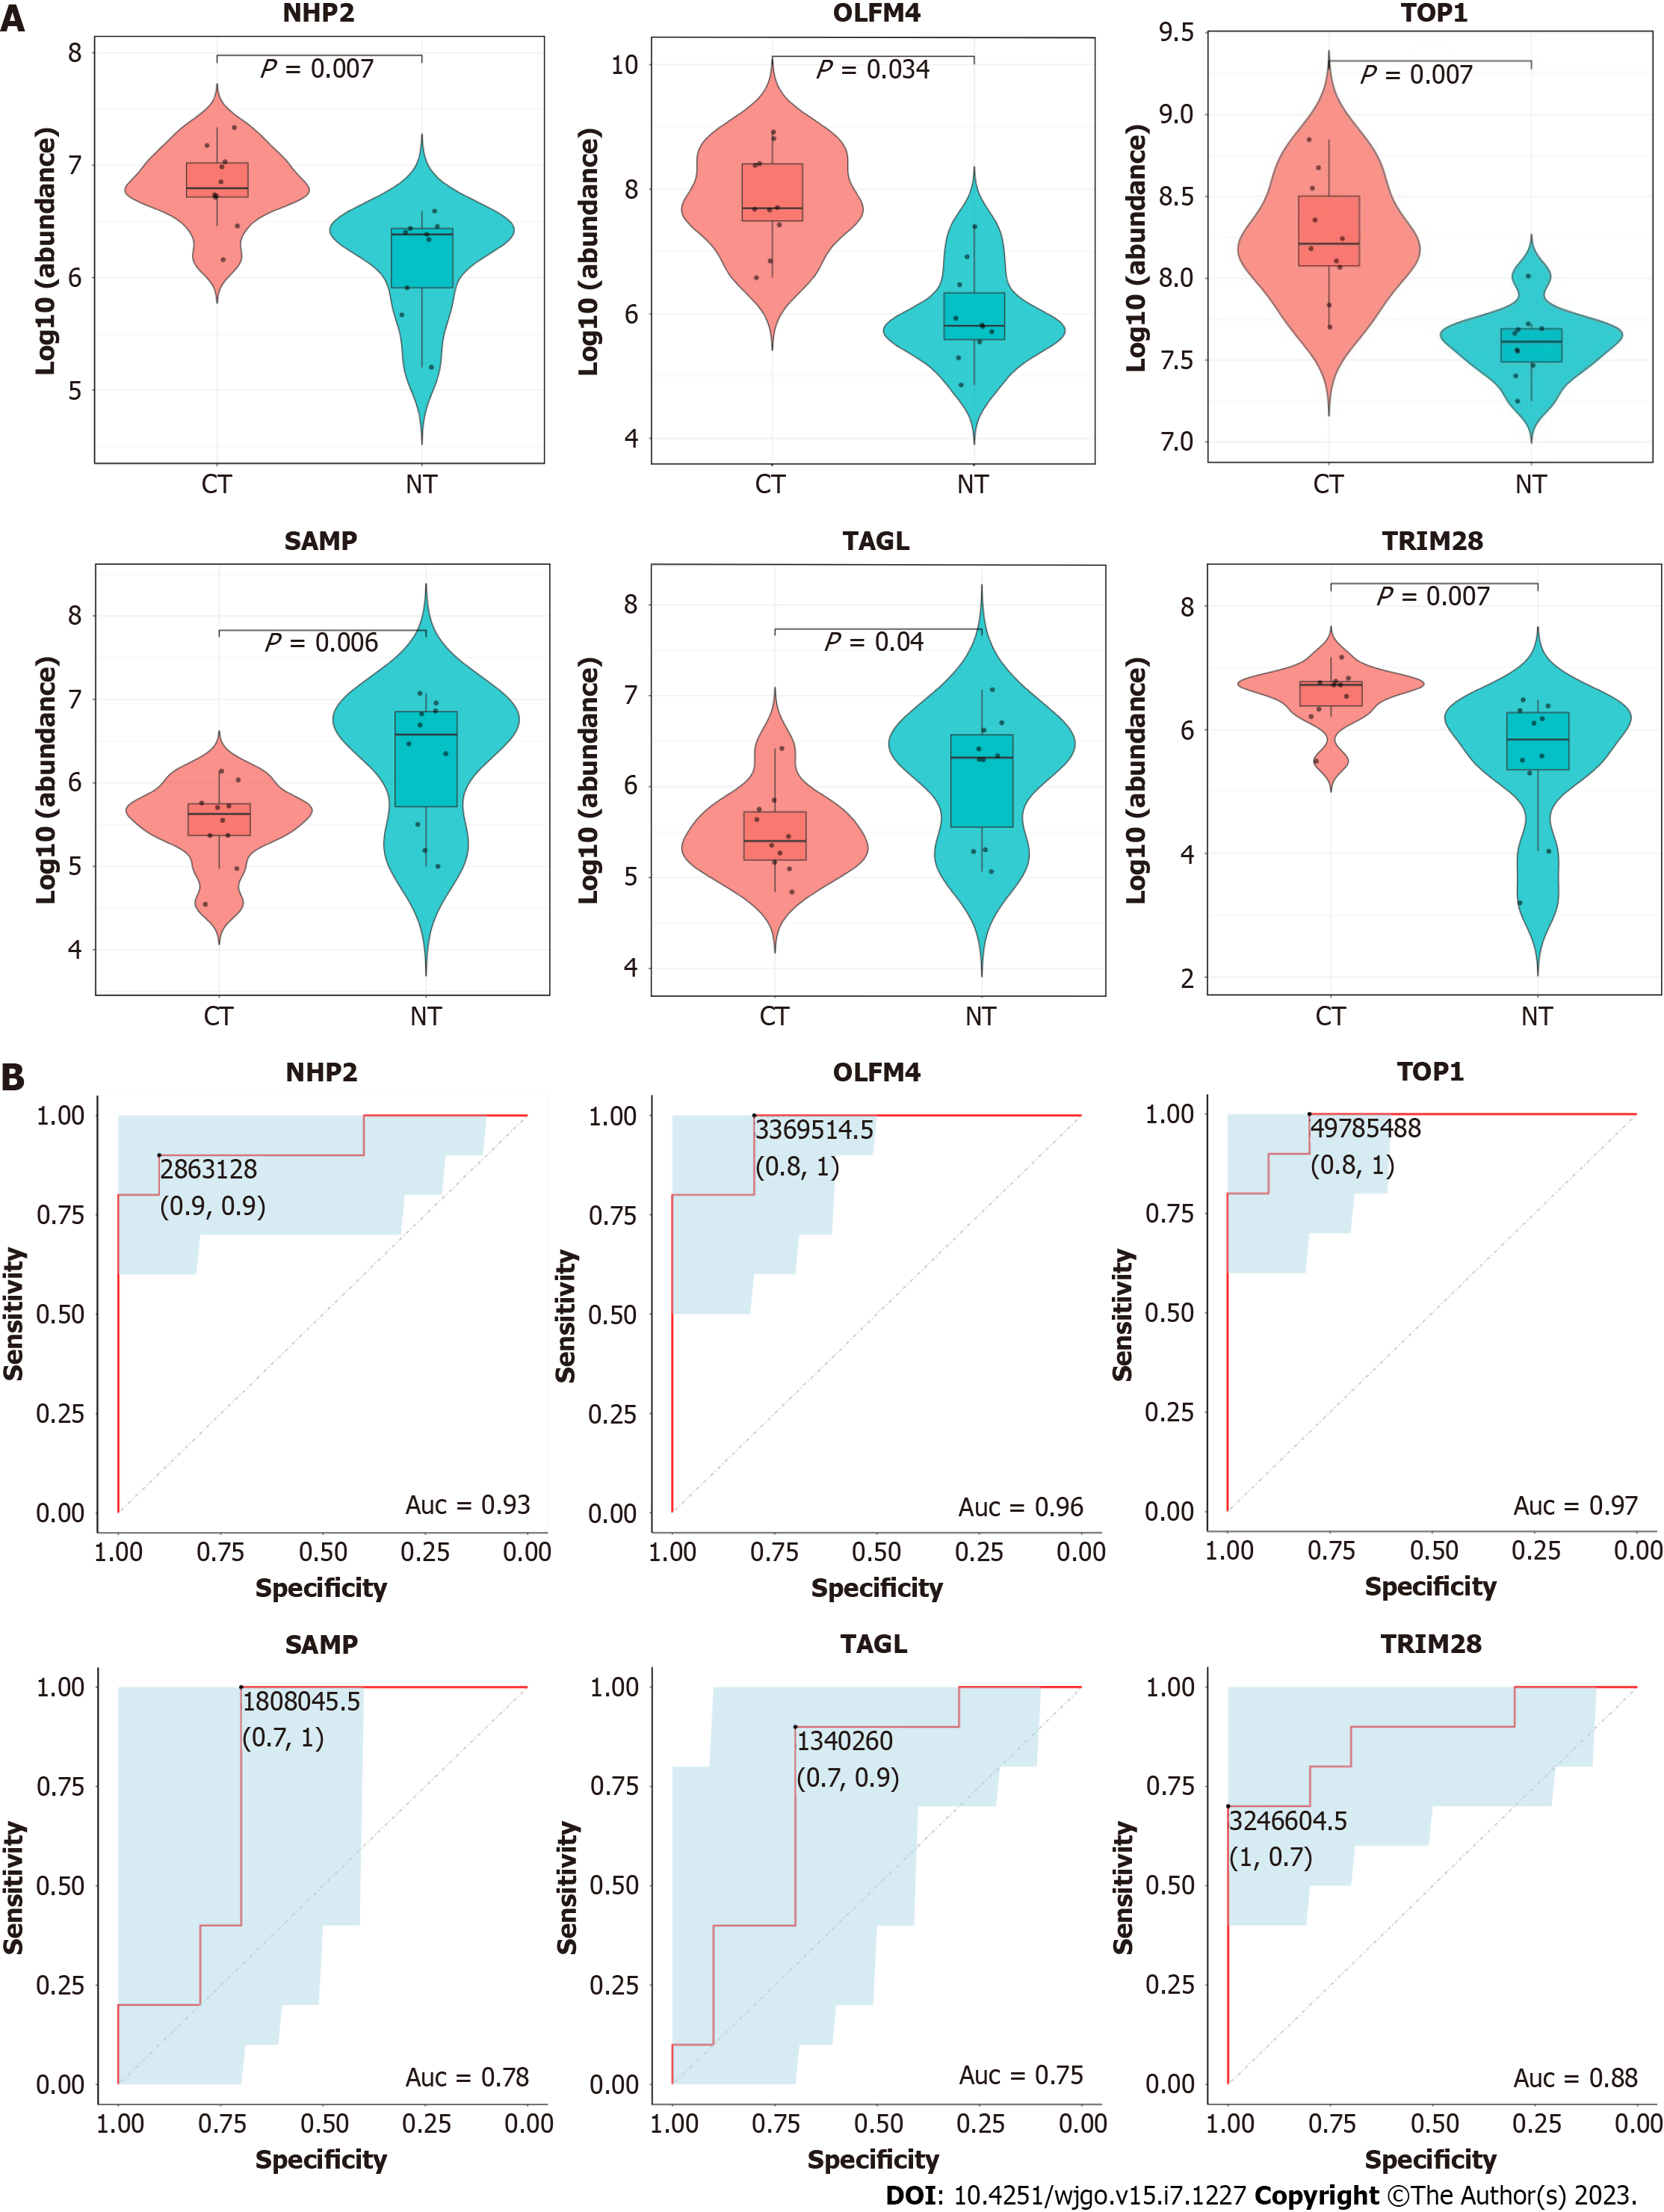
Figure 3 Verification of candidate exosomal proteins.
A: Parallel reaction monitoring analysis shows the upregulation of NHP2 (P = 0.007), OLFM4 (P = 0.034), TOP1 (P = 0.007), TRIM28 (P = 0.007), and the downregulation of SAMP (P = 0.006), TAGL(p=0.04) between colorectal cancer tissue exosomes and normal intestinal tissue exosomes; B: Receiver operating characteristic curve analysis shows that the area under curve of NHP2, OLFM4, TOP1, SAMP, TAGL, and TRIM28 are 0.93, 0.96, 0.97, 0.78, 0.75, 0.88, respectively (P < 0.05). CT: Colorectal cancer tissues; NT: Normal intestinal tissues; ROC: Receiver operating characteristic curve; AUC: Area under ROC curve; NHP2: H/ACA ribonucleoprotein complex subunit 2; OLFM4: Olfactomedin-4; TOP1: DNA topoisomerase 1; SAMP: Serum amyloid P-component; TAGL: Transgelin; TRIM28: Tripartite motif-containing protein 28.
- Citation: Zhou GYJ, Zhao DY, Yin TF, Wang QQ, Zhou YC, Yao SK. Proteomics-based identification of proteins in tumor-derived exosomes as candidate biomarkers for colorectal cancer. World J Gastrointest Oncol 2023; 15(7): 1227-1240
- URL: https://www.wjgnet.com/1948-5204/full/v15/i7/1227.htm
- DOI: https://dx.doi.org/10.4251/wjgo.v15.i7.1227


