Copyright
©The Author(s) 2023.
World J Gastrointest Oncol. Jul 15, 2023; 15(7): 1182-1199
Published online Jul 15, 2023. doi: 10.4251/wjgo.v15.i7.1182
Published online Jul 15, 2023. doi: 10.4251/wjgo.v15.i7.1182
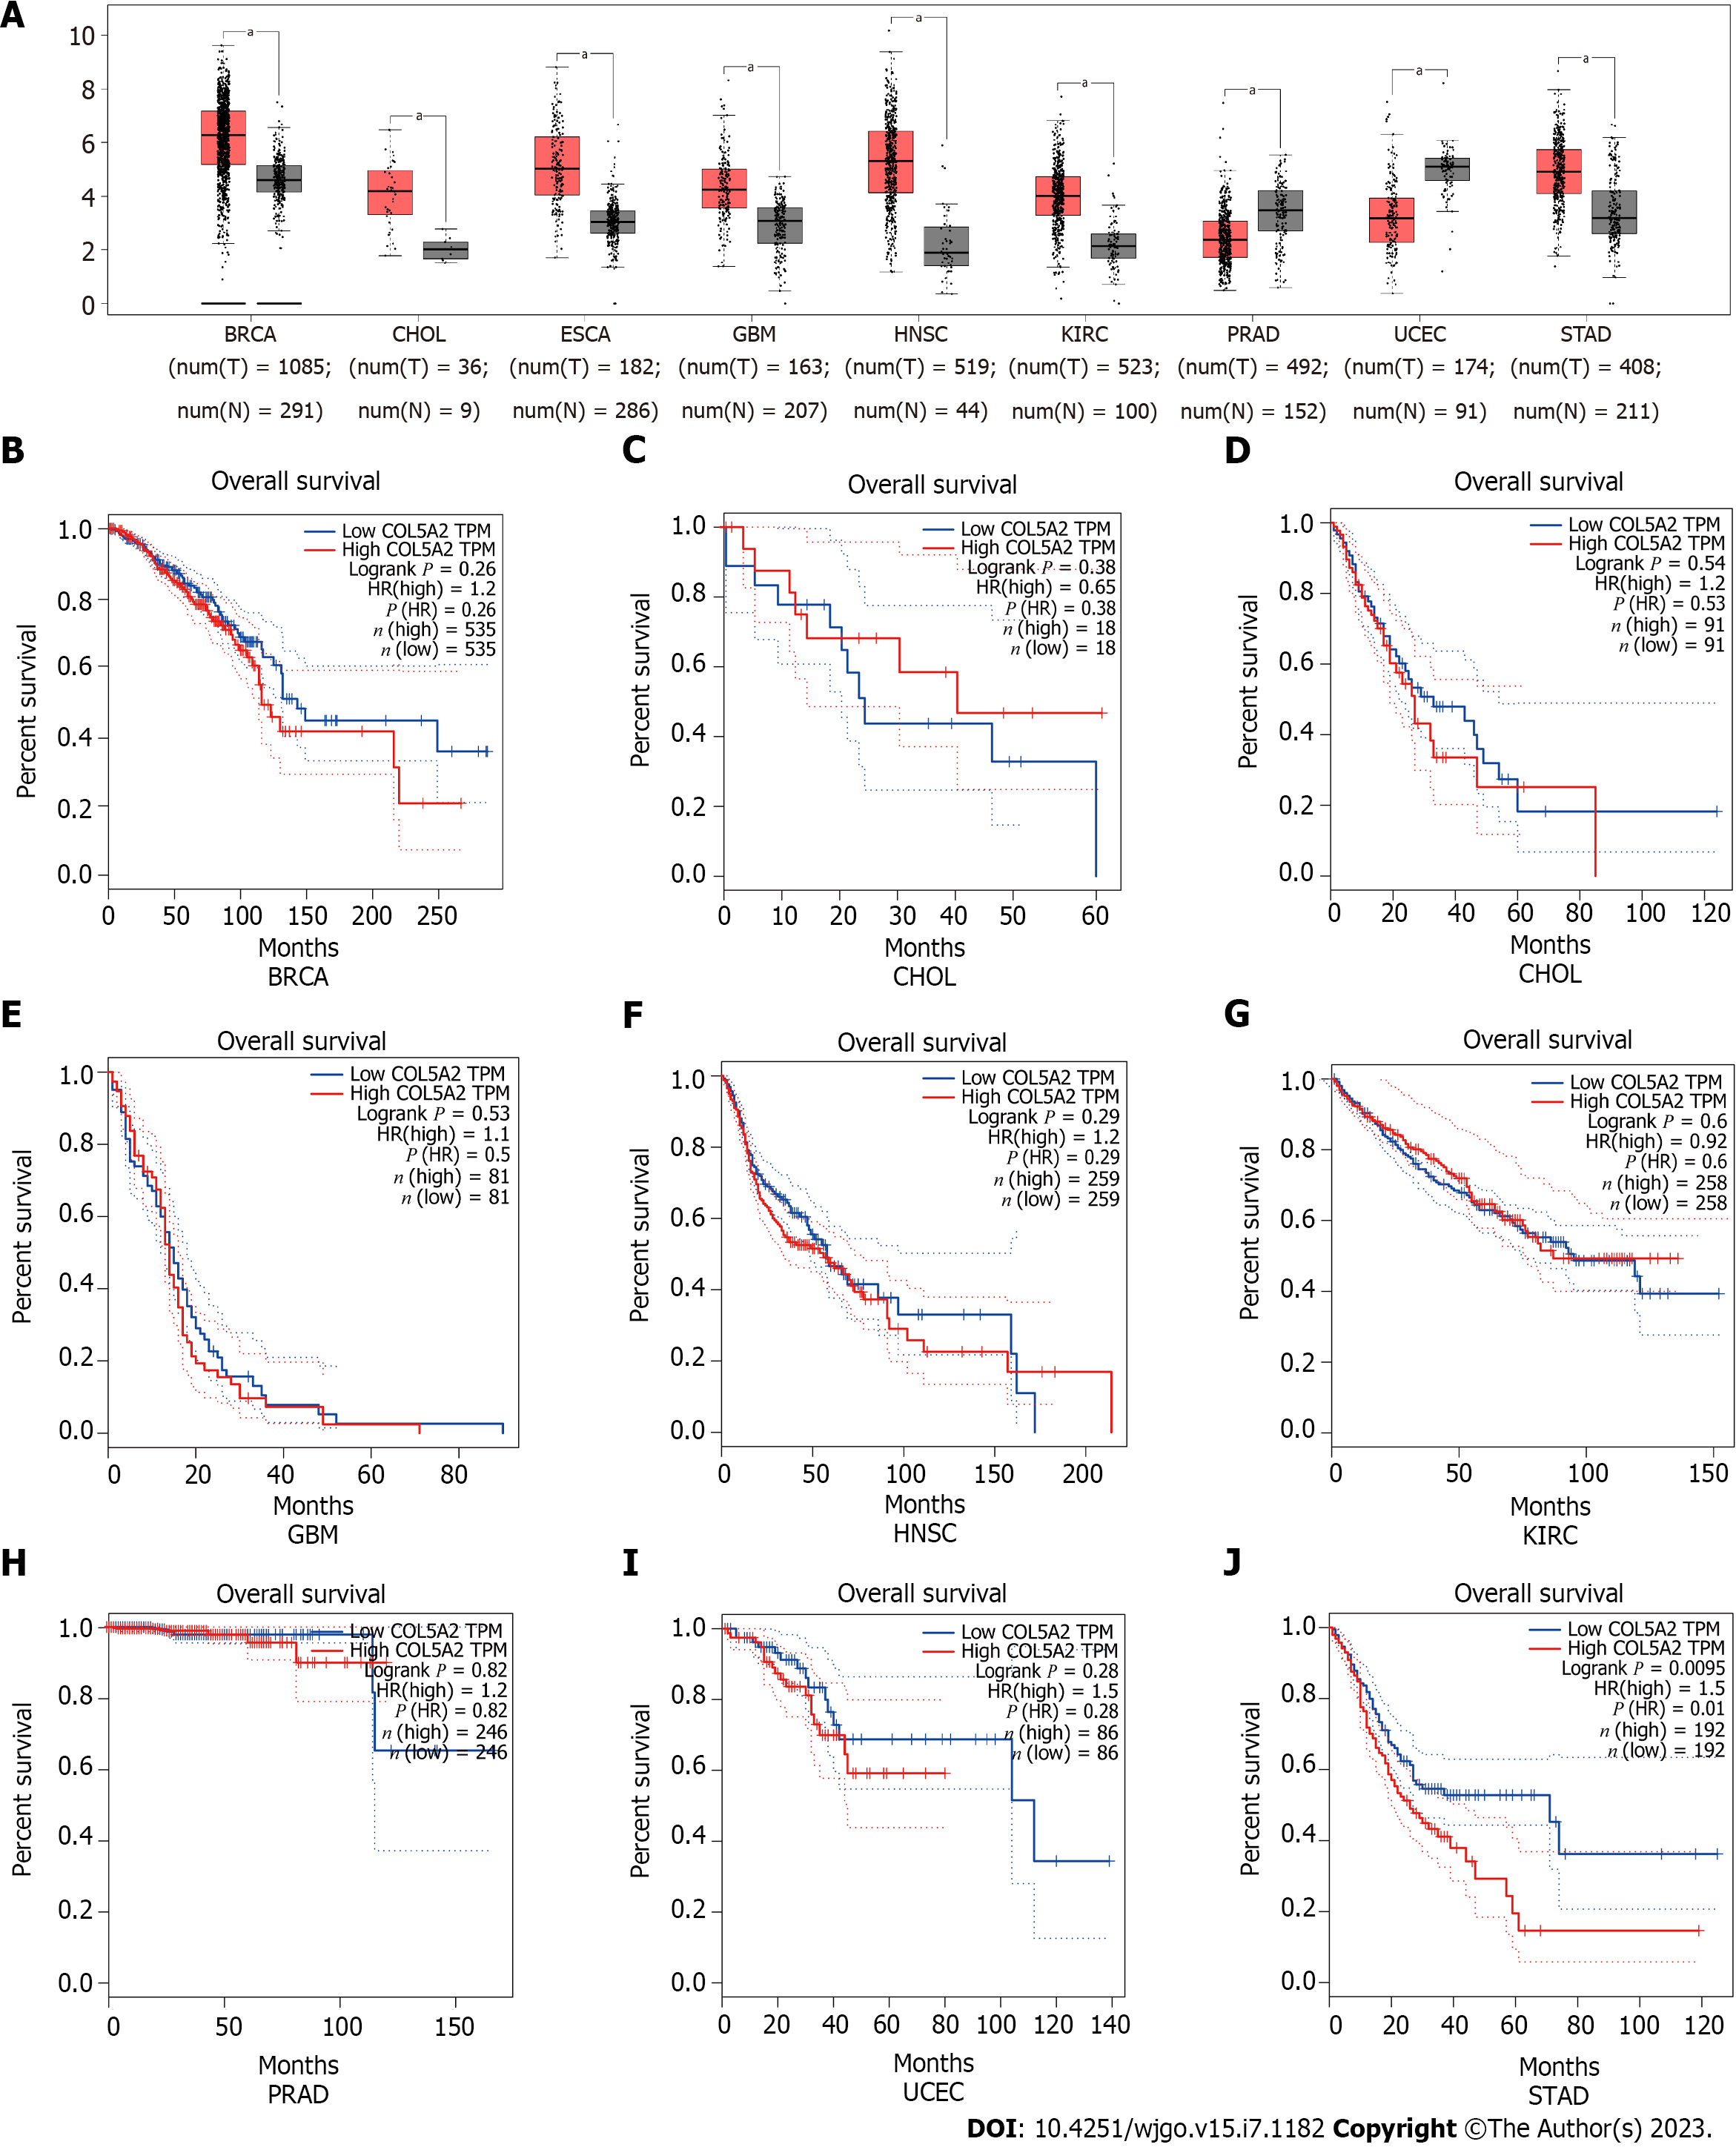
Figure 1 COL5A2 was upregulated in pan cancer and associated with the overall survival of gastric cancer.
A: Analysis of COL5A2 expression in 9 types of cancer by Gene Expression Profiling Interactive Analysis database; B: Associations of COL5A2 expression with the overall survival (OS) in Breast invasive carcinoma; C: Associations of COL5A2 expression with the OS in Cholangio carcinoma; D: Associations of COL5A2 expression with the OS in esophageal carcinoma; E: Associations of COL5A2 expression with the OS in Glioblastoma multiforme; F: Associations of COL5A2 expression with the OS in head and neck squamous cell carcinoma; G: Associations of COL5A2 expression with the OS in kidney renal clear cell carcinoma; H: Associations of COL5A2 expression with the OS in prostate adenocarcinoma; I: Associations of COL5A2 expression with the OS in Uterine Corpus Endometrial Carcinoma; J: Associations of COL5A2 expression with the OS in stomach adenocarcinoma. aP < 0.05. BRCA: Breast invasive carcinoma; CHOL: Cholangio carcinoma; ESCA: Esophageal carcinoma; GBM: Glioblastoma multiforme; HNSC: Head and Neck squamous cell carcinoma; KIRC: kidney renal clear cell carcinoma; PRAD: Prostate adenocarcinoma; UCEC: Uterine Corpus Endometrial Carcinoma; STAD: Stomach adenocarcinoma.
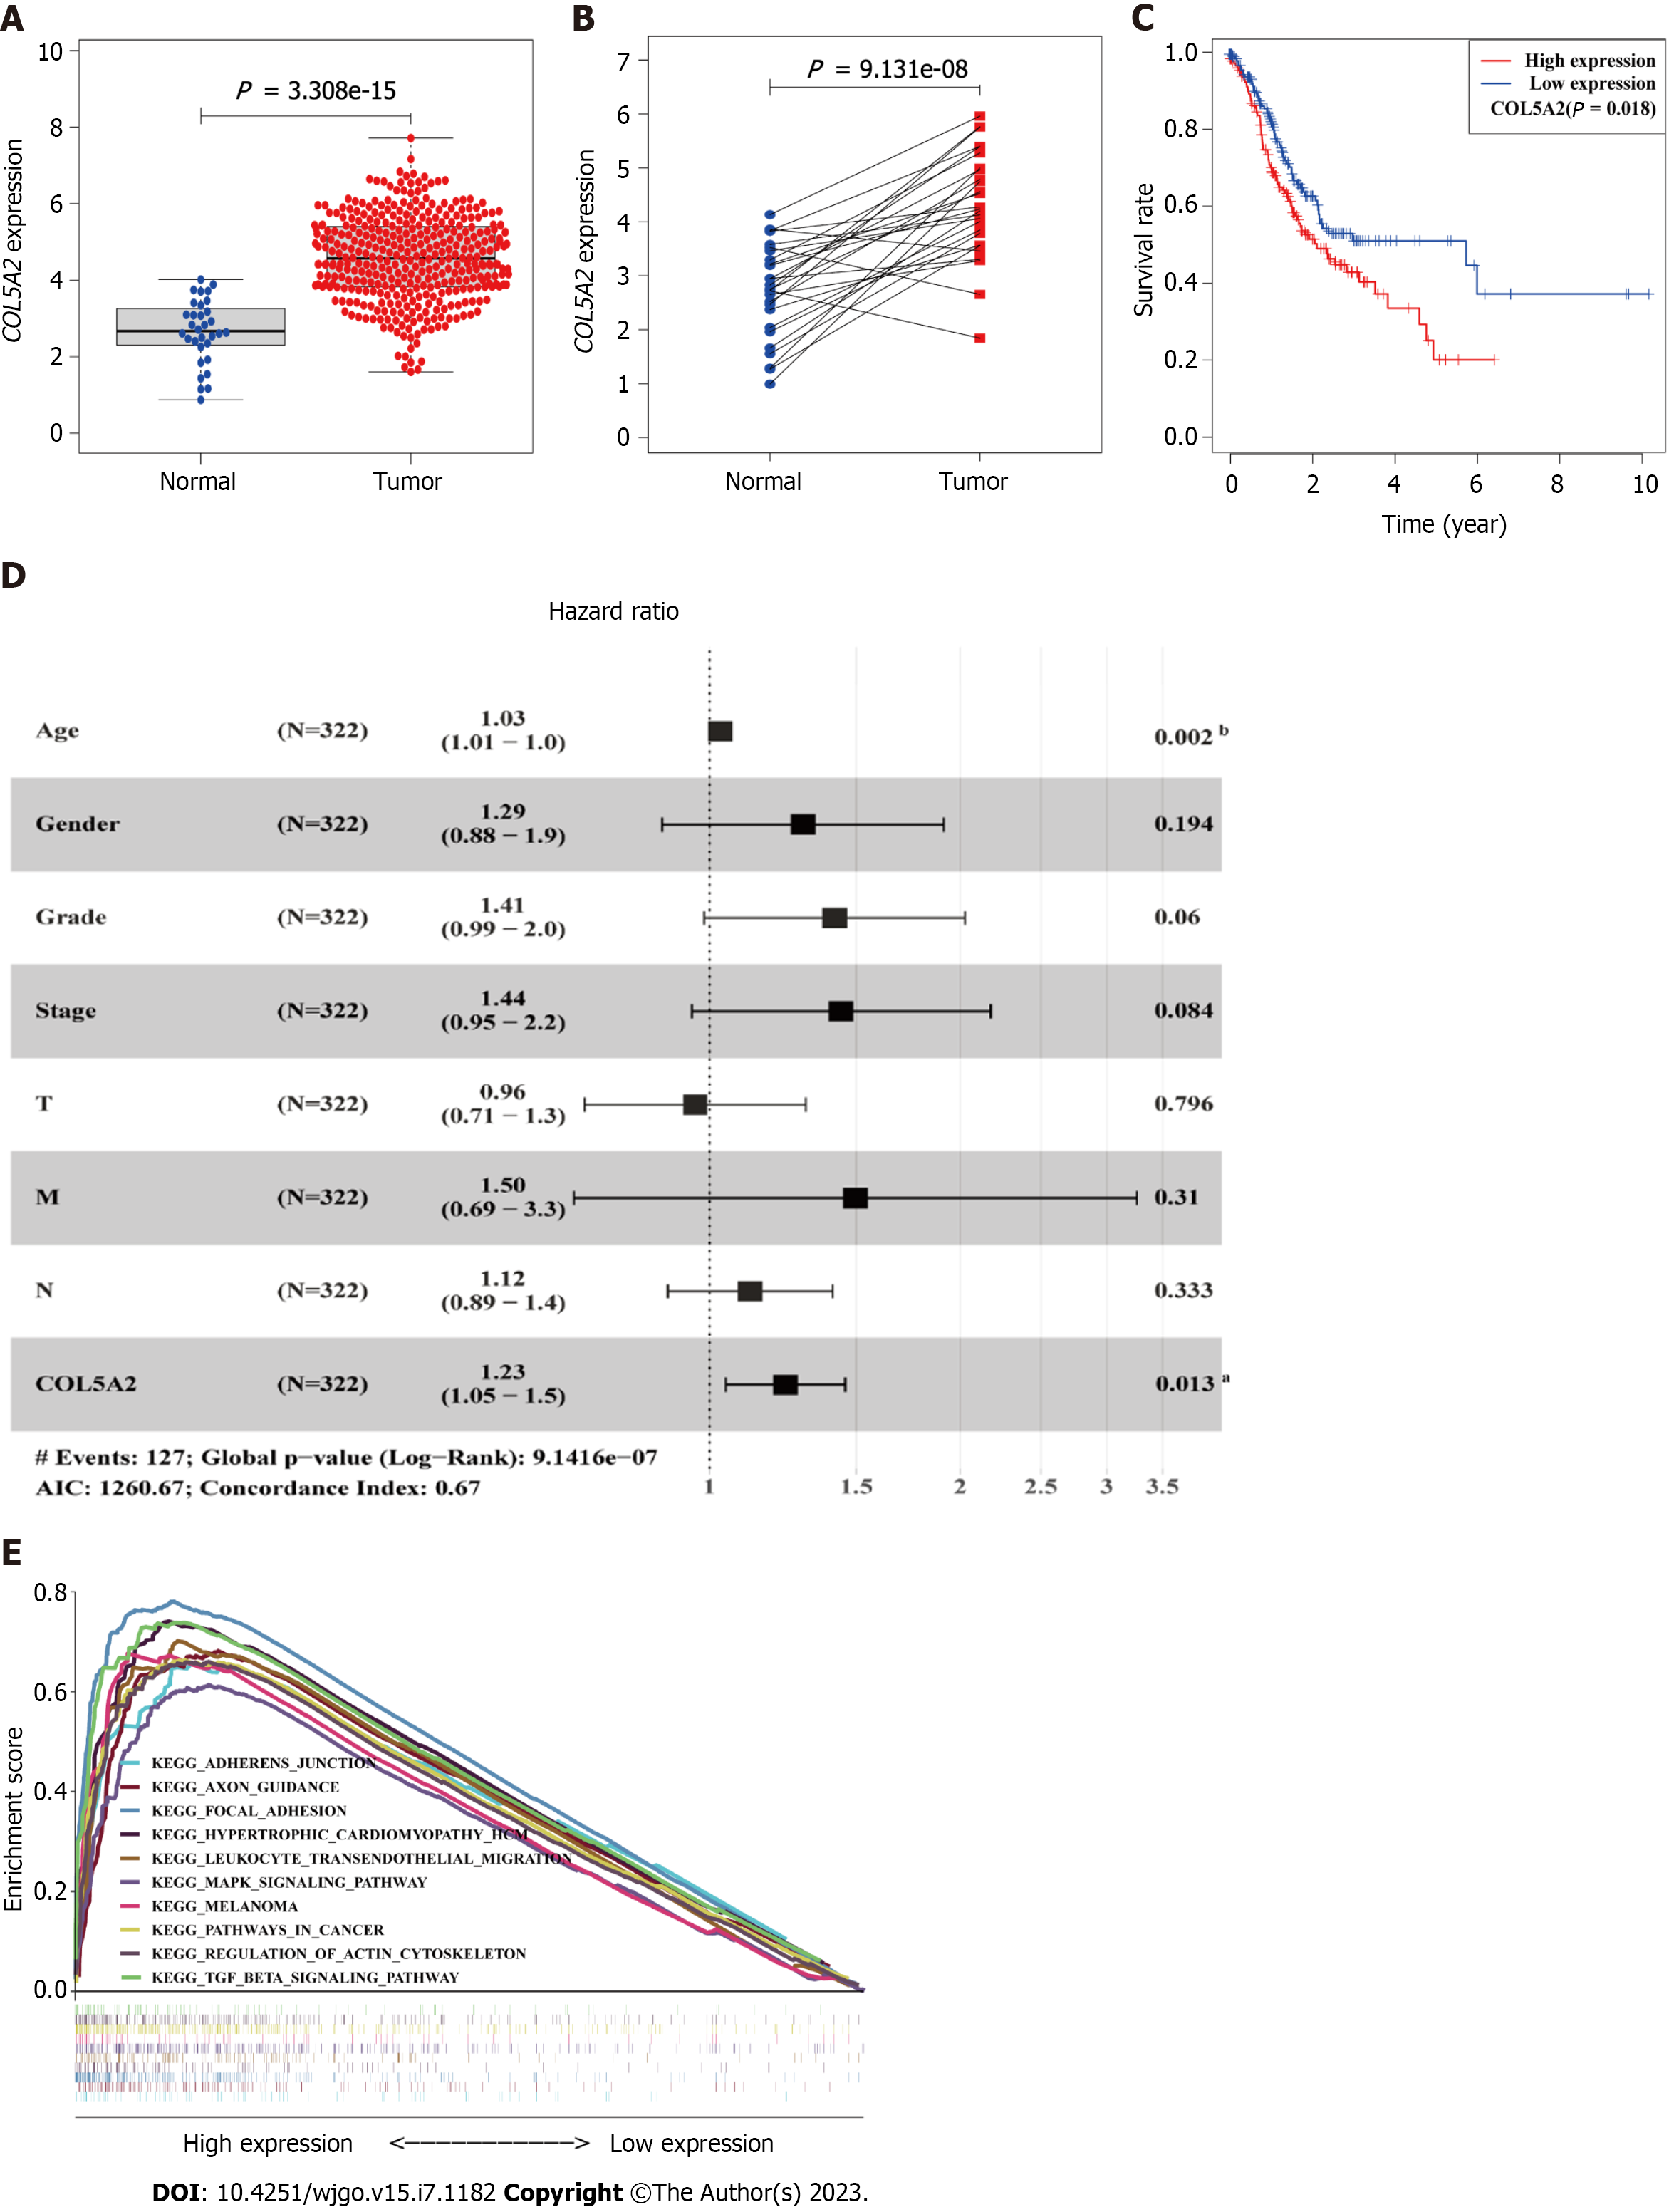
Figure 2 Expression, prognostic value, and enriched function of COL5A2 in gastric cancer from The Cancer Genome Atlas data.
A: Expression of COL5A2 in gastric cancer (GC), normal (n = 45), tumor (n = 446); B: COL5A2 expression in 27 paired normal and tumor tissues; C: Overall survival of GC patients grouped by COL5A2 median cutoff; D: Forest plots depicting the results of multivariate Cox regression analysis. Age and high expression of COL5A2 predicted a low survival rate independently, n = 322. Error bars represent 95% confidence intervals; E: Gene set enrichment analysis illustrating the key pathways enriched in COL5A2 high expression group. aP < 0.05, bP < 0.01.
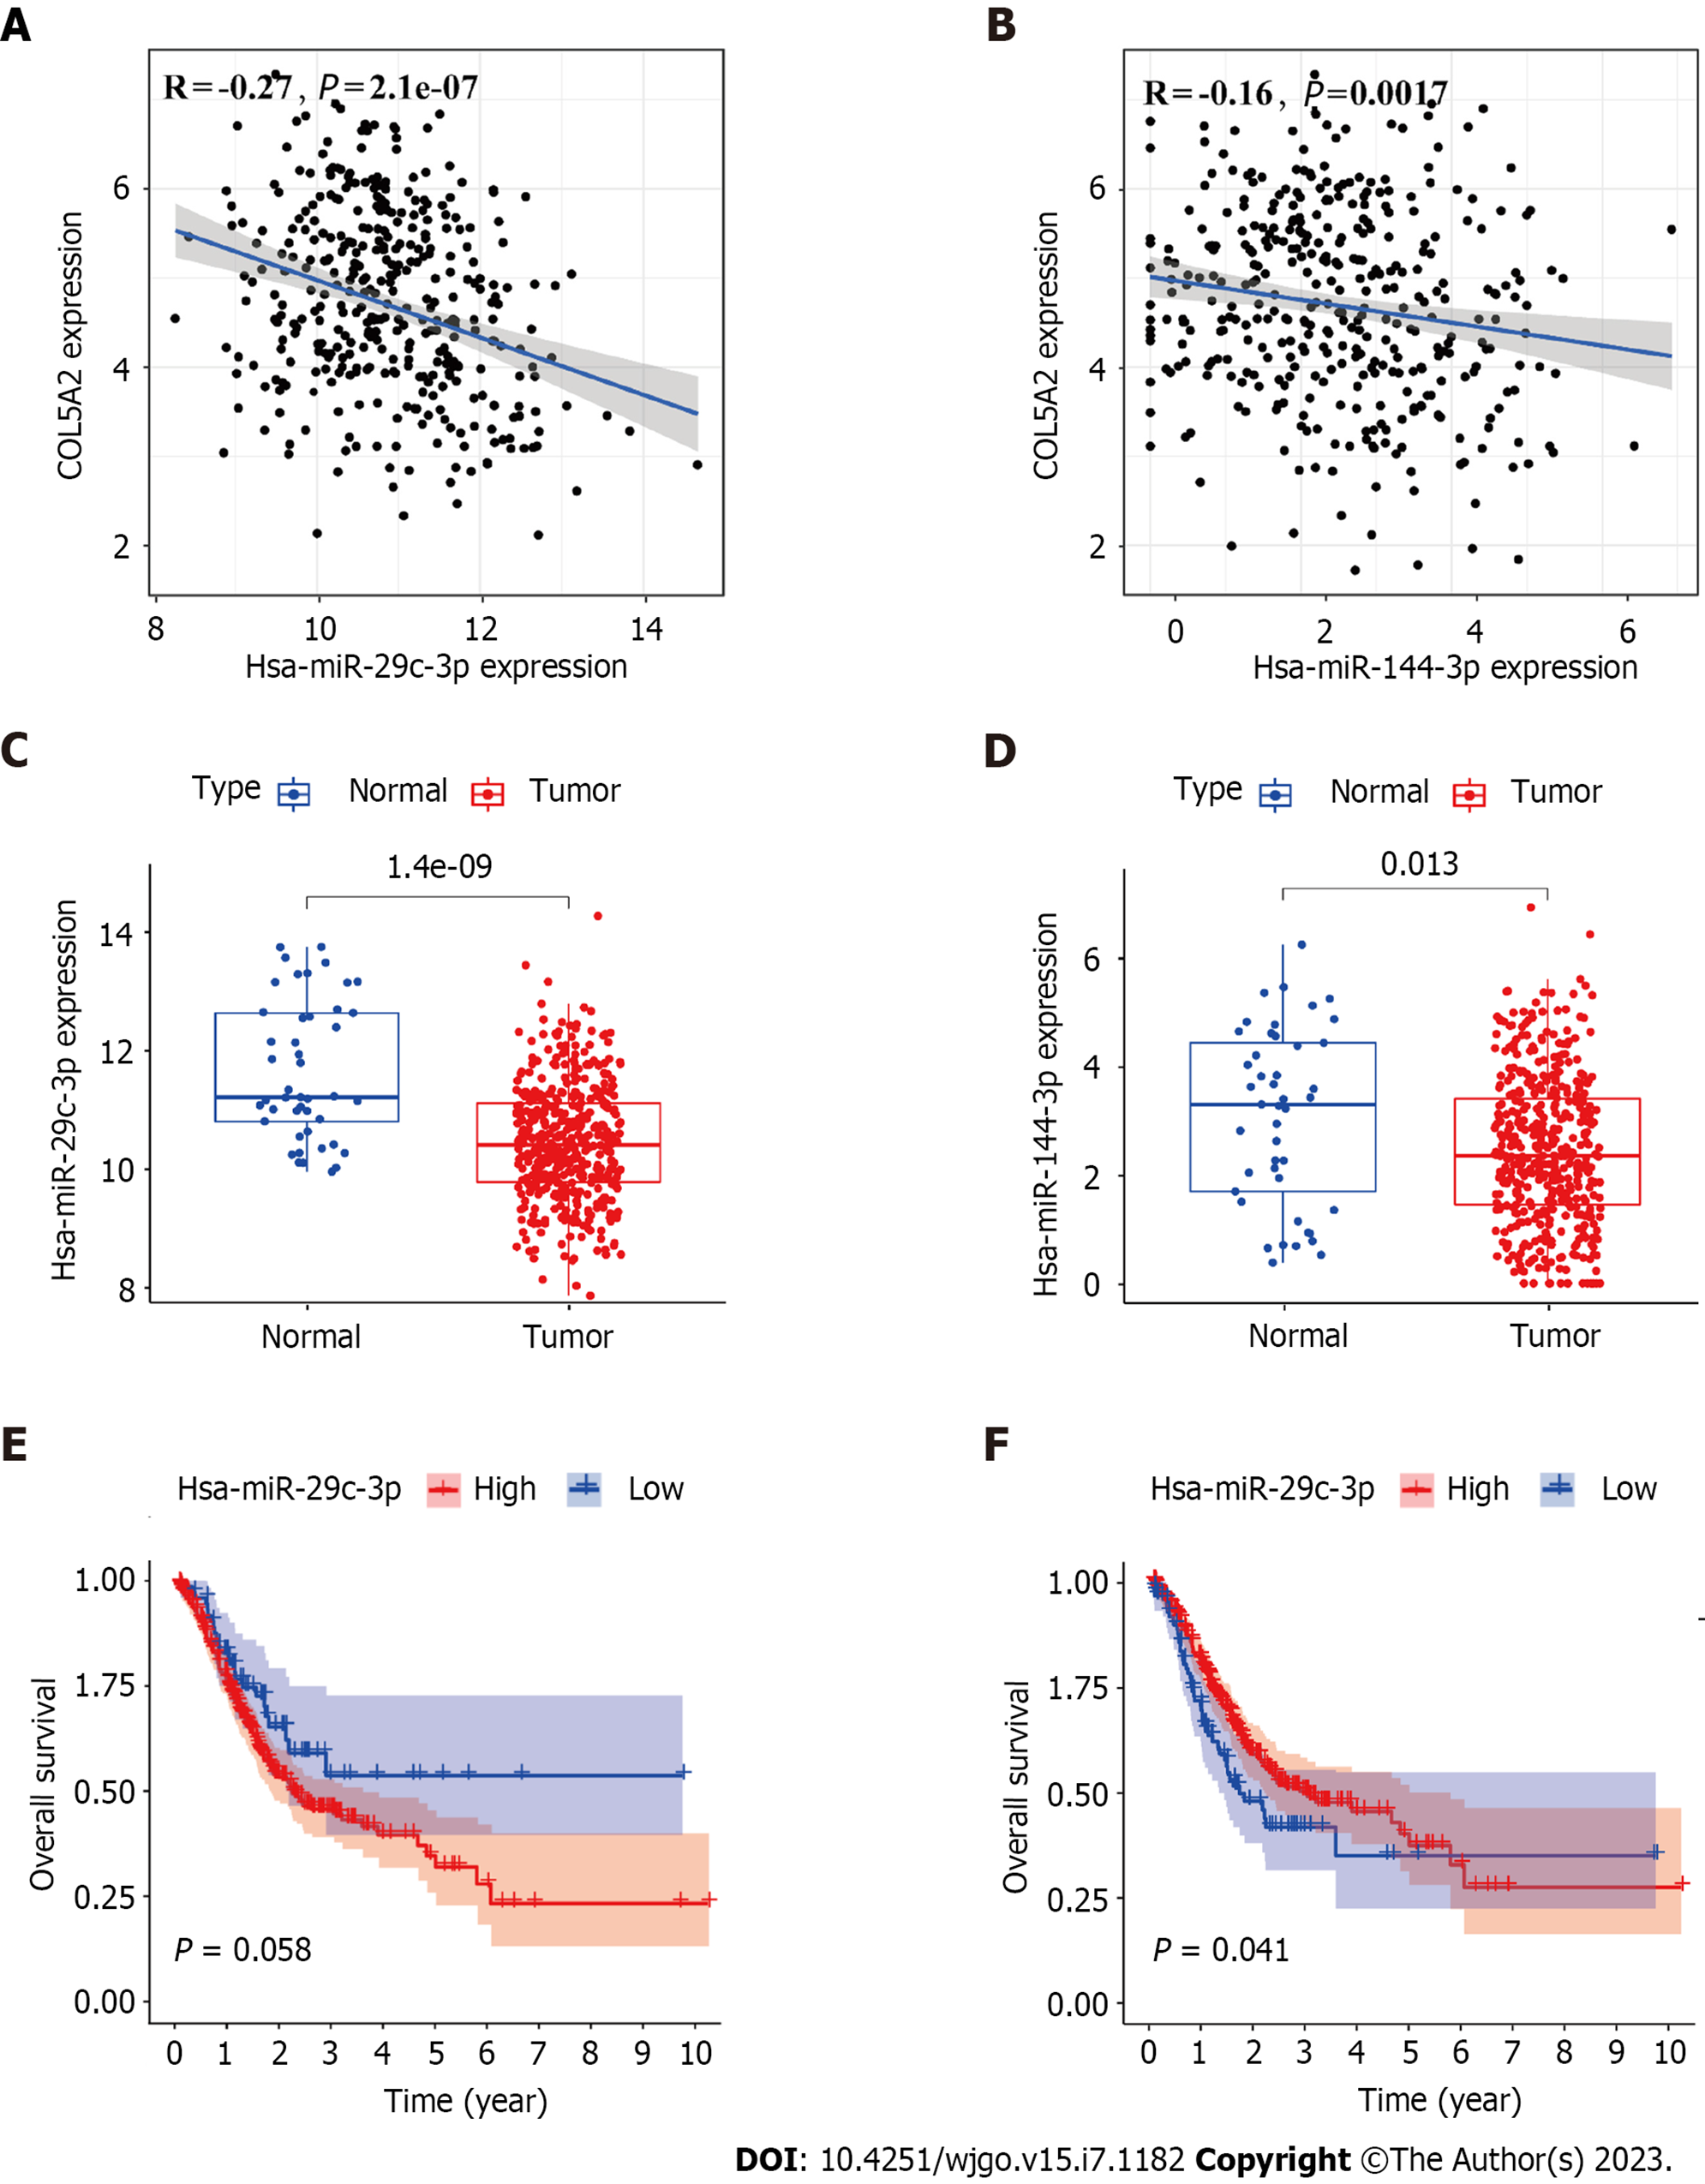
Figure 3 miR-29c-3p and miR-144-3p may bind to COL5A2.
A: Expression correlation between miR-29c-3p and COL5A2 in gastric cancer (GC) based on The Cancer Genome Atlas (TCGA) data; B: Expression correlation between miR-144-3p and COL5A2 in GC based on TCGA data; C: Expression of miR-29c-3p in GC and control samples; D: Expression of miR-144-3p in GC and control samples; E: Prognostic value of miR-29c-3p in GC; F: Prognostic value of miR-144-3p in GC. Normal: n = 45, tumor: n = 446.
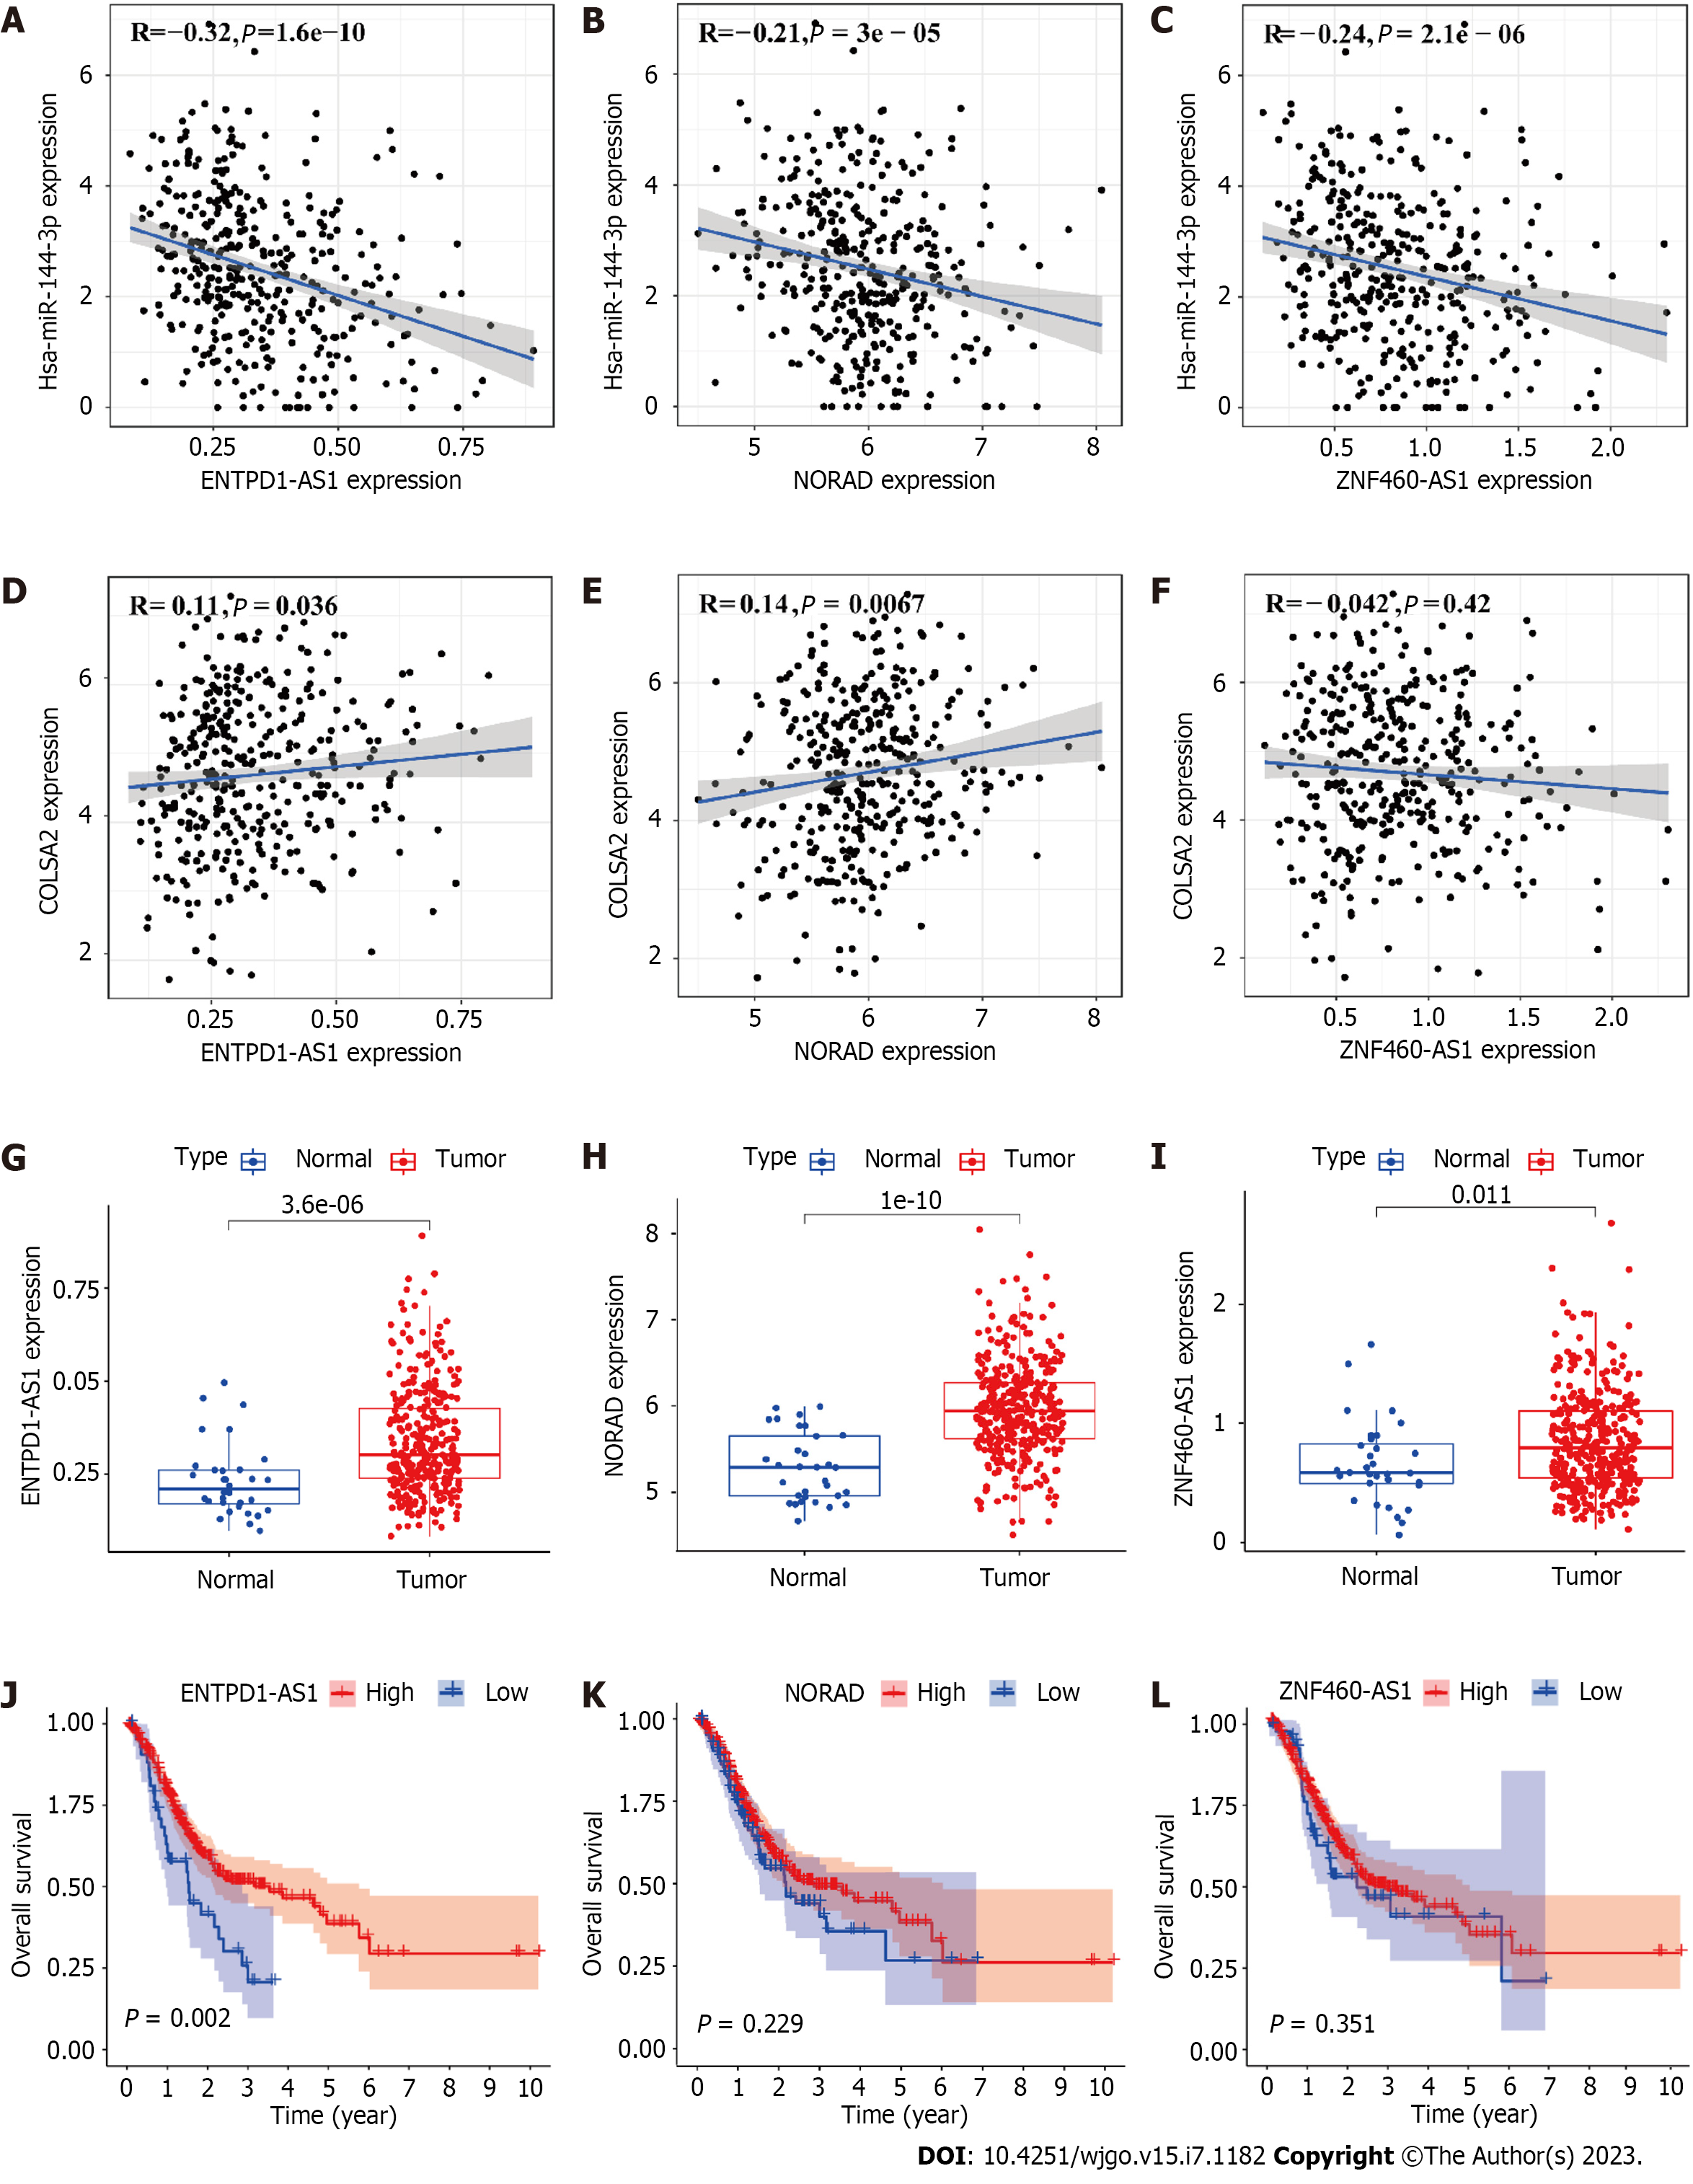
Figure 4 ENTPD1-AS1, NORAD and ZNF460-AS1 may interact with miR-144-3p in gastric cancer.
A: Correlation analysis between miR-144-3p and ENTPD1-AS1; B: Correlation analysis between miR-144-3p and NORAD; C: Correlation analysis between miR-144-3p and ZNF460-AS1; D: Correlation analysis between ENTPD1-AS1 and COL5A2; E: Correlation analysis between NORAD and COL5A2; F: Correlation analysis between ZNF460-AS1 and COL5A2; G: Expression of ENTPD1-AS1 in tumor and normal tissues; H: Expression of NORAD in tumor and normal tissues; I: Expression of ZNF460-AS1 in tumor and normal tissues; J: Overall survival (OS) analysis for ENTPD1-AS1 in gastric cancer (GC); K: OS analysis for NORAD in GC; L: OS analysis for ZNF460-AS1 in GC. Normal: n = 45, tumor: n = 446. P < 0.05 means a significant difference.
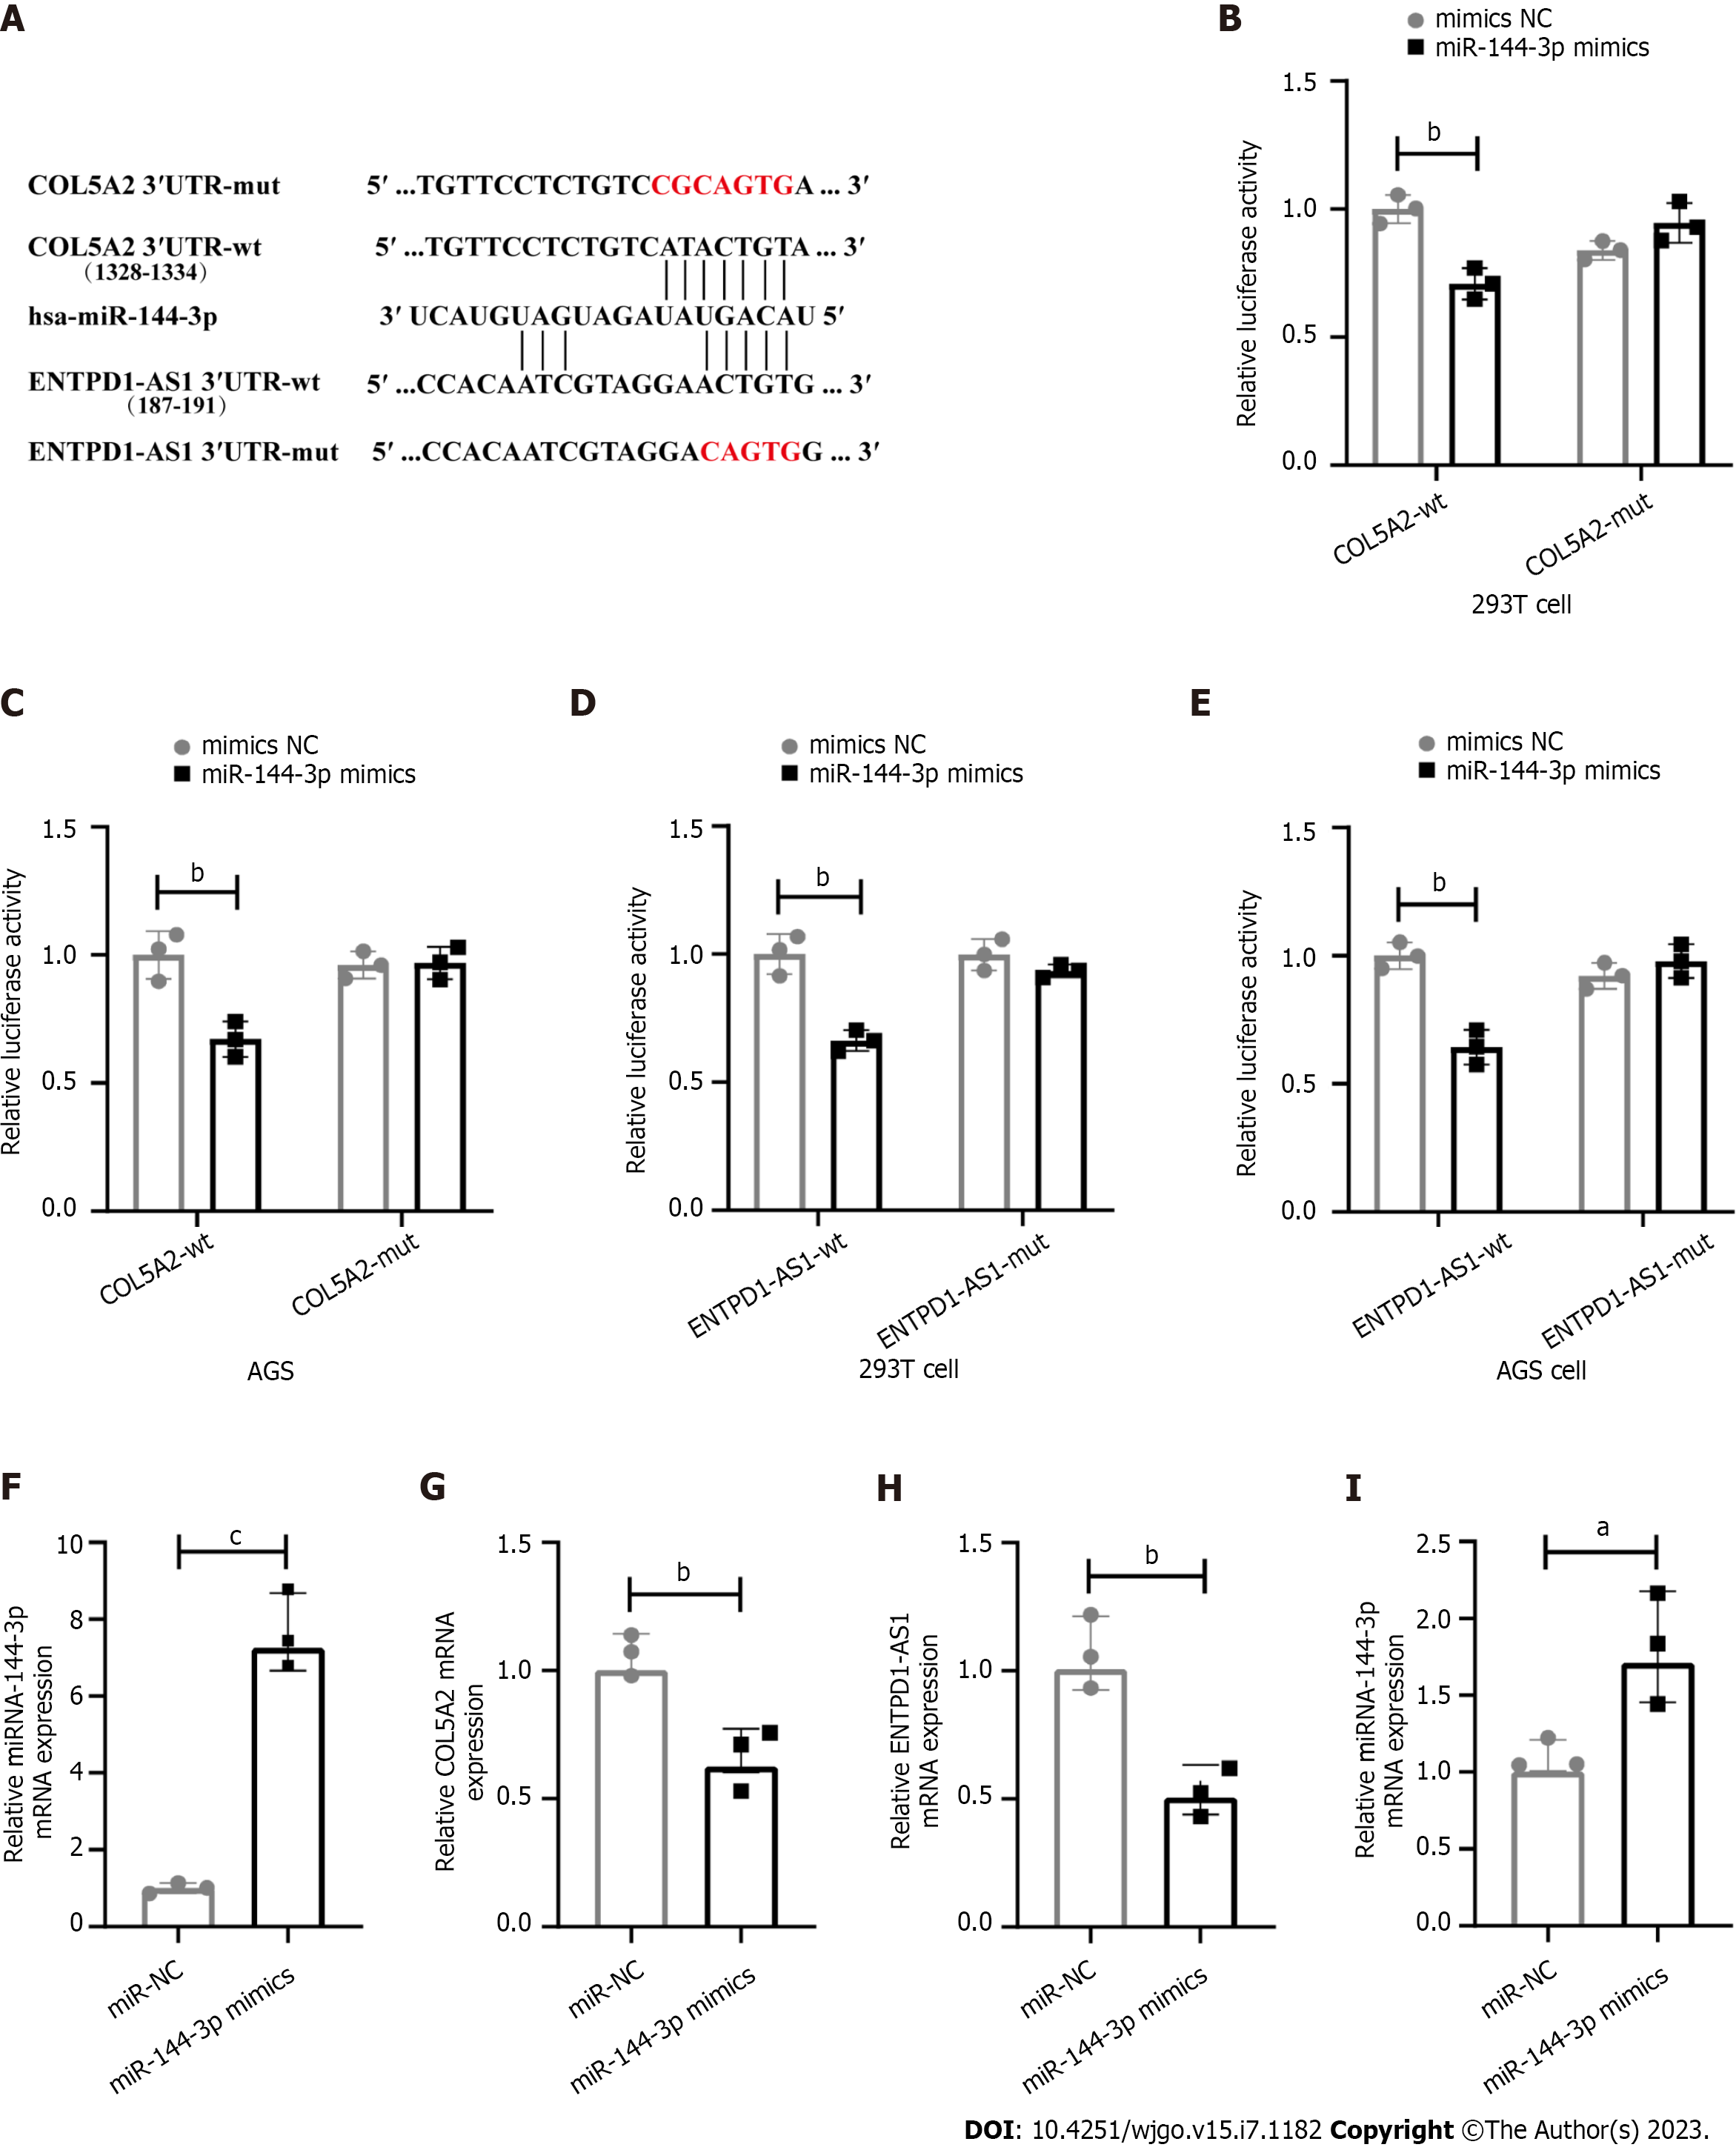
Figure 5 Long noncoding RNA ENTPD1-AS1 regulated the expression of COL5A2 through sponging miR-144-3p.
A: Construction of dual luciferase reporter plasmids, including wild type (wt) and mutant (mut) of 3′UTR COL5A2 and ENTPD1-AS1; B: dual luciferase reporter assay to evaluate the direct interaction of COL5A2 and miR-144-3p in 293T; C: Dual luciferase reporter assay to evaluate the direct interaction of COL5A2 and miR-144-3p in human gastric adenocarcinoma cell line (AGS); D: dual luciferase reporter assay to detect the interaction of ENTPD1-AS1 and miR-144-3p in 293T; E: dual luciferase reporter assay to detect the interaction of ENTPD1-AS1 and miR-144-3p in AGS; F: The Transfection efficiency of miR-144-3p in AGS was evaluated; G: Effect of miR-144-3p on the expression of COL5A2, detected by quantitative reverse transcriptase polymerase chain reaction (qRT-PCR); H: The Transfection efficiency of ENTPD1-AS1 in AGS was evaluated; I: Effect of ENTPD1-AS1 on the expression of miR-144-3p in AGS, detected by qRT-PCR. aP < 0.05, bP < 0.01, cP < 0.001. AGS: Human gastric adenocarcinoma cell line; NC: Negative controls.
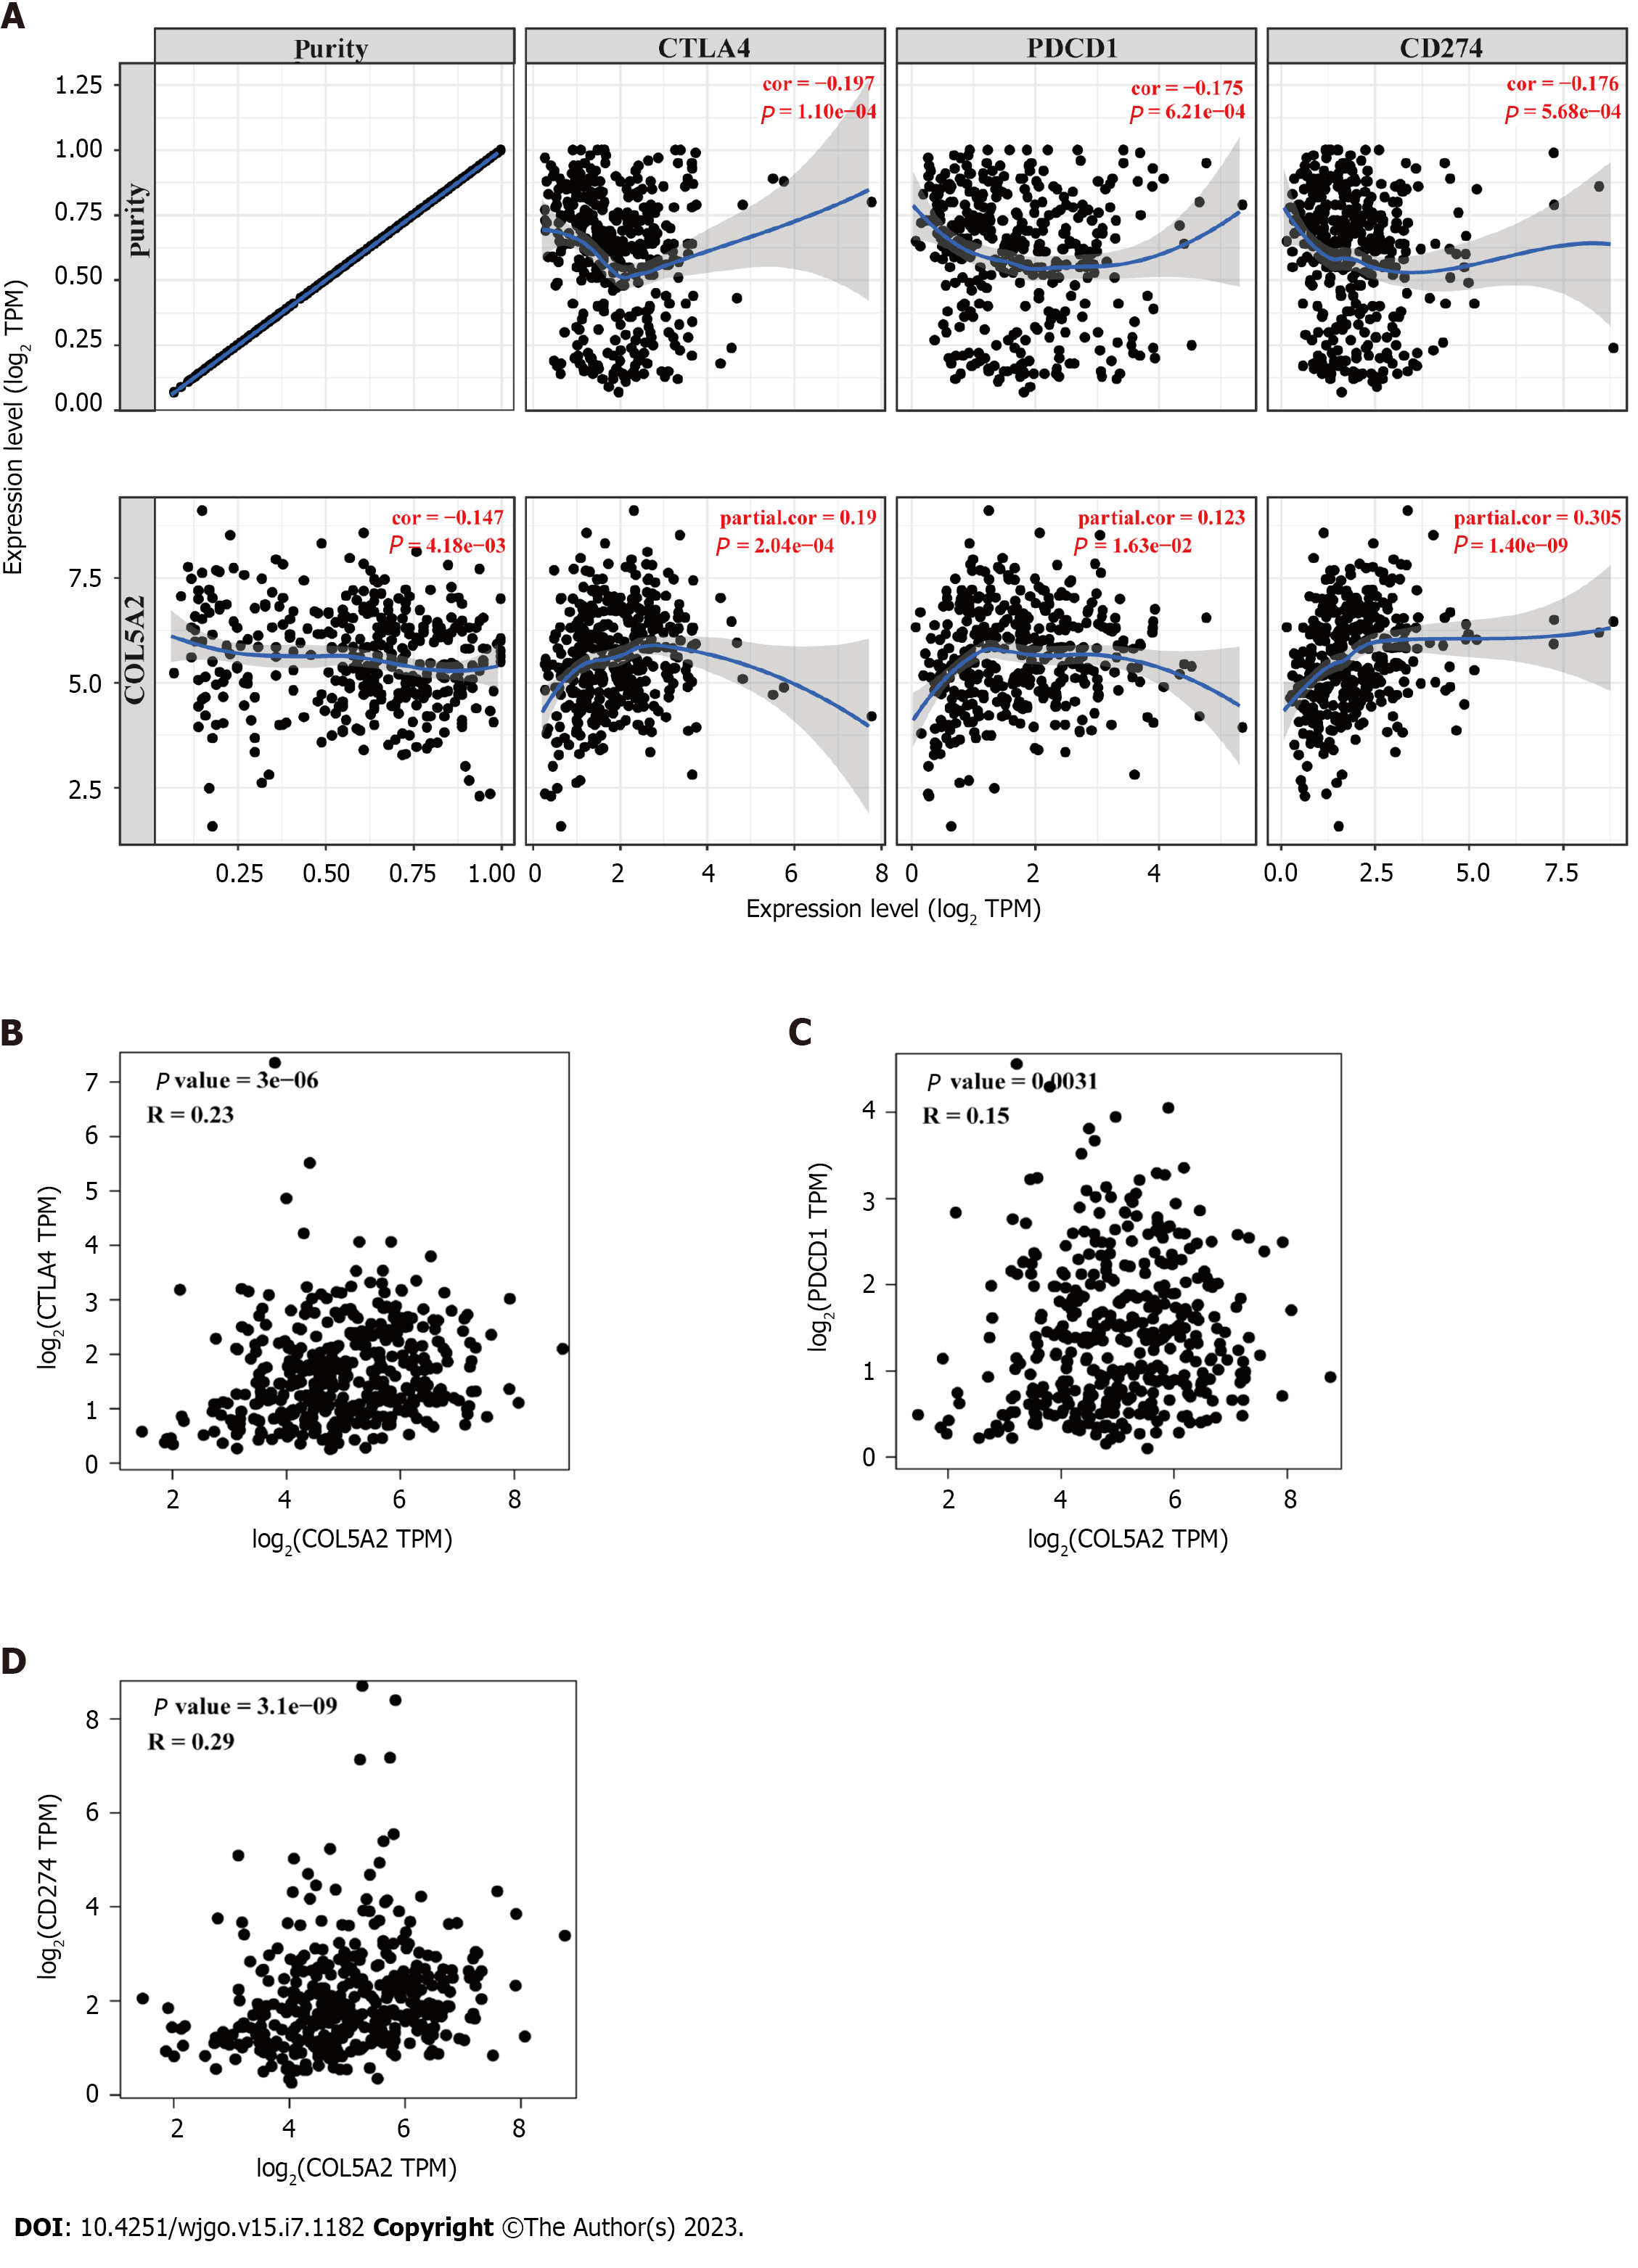
Figure 6 Association of COL5A2 and checkpoints.
A: Correlation analysis between COL5A2 and immune checkpoints in Tumor Immune Estimation Resource database; B: Correlation analysis between COL5A2 and CTLA4 by Gene Expression Profiling Interactive Analysis database; C: Correlation analysis between COL5A2 and PDCD1; D: Correlation analysis between COL5A2 and CD274.
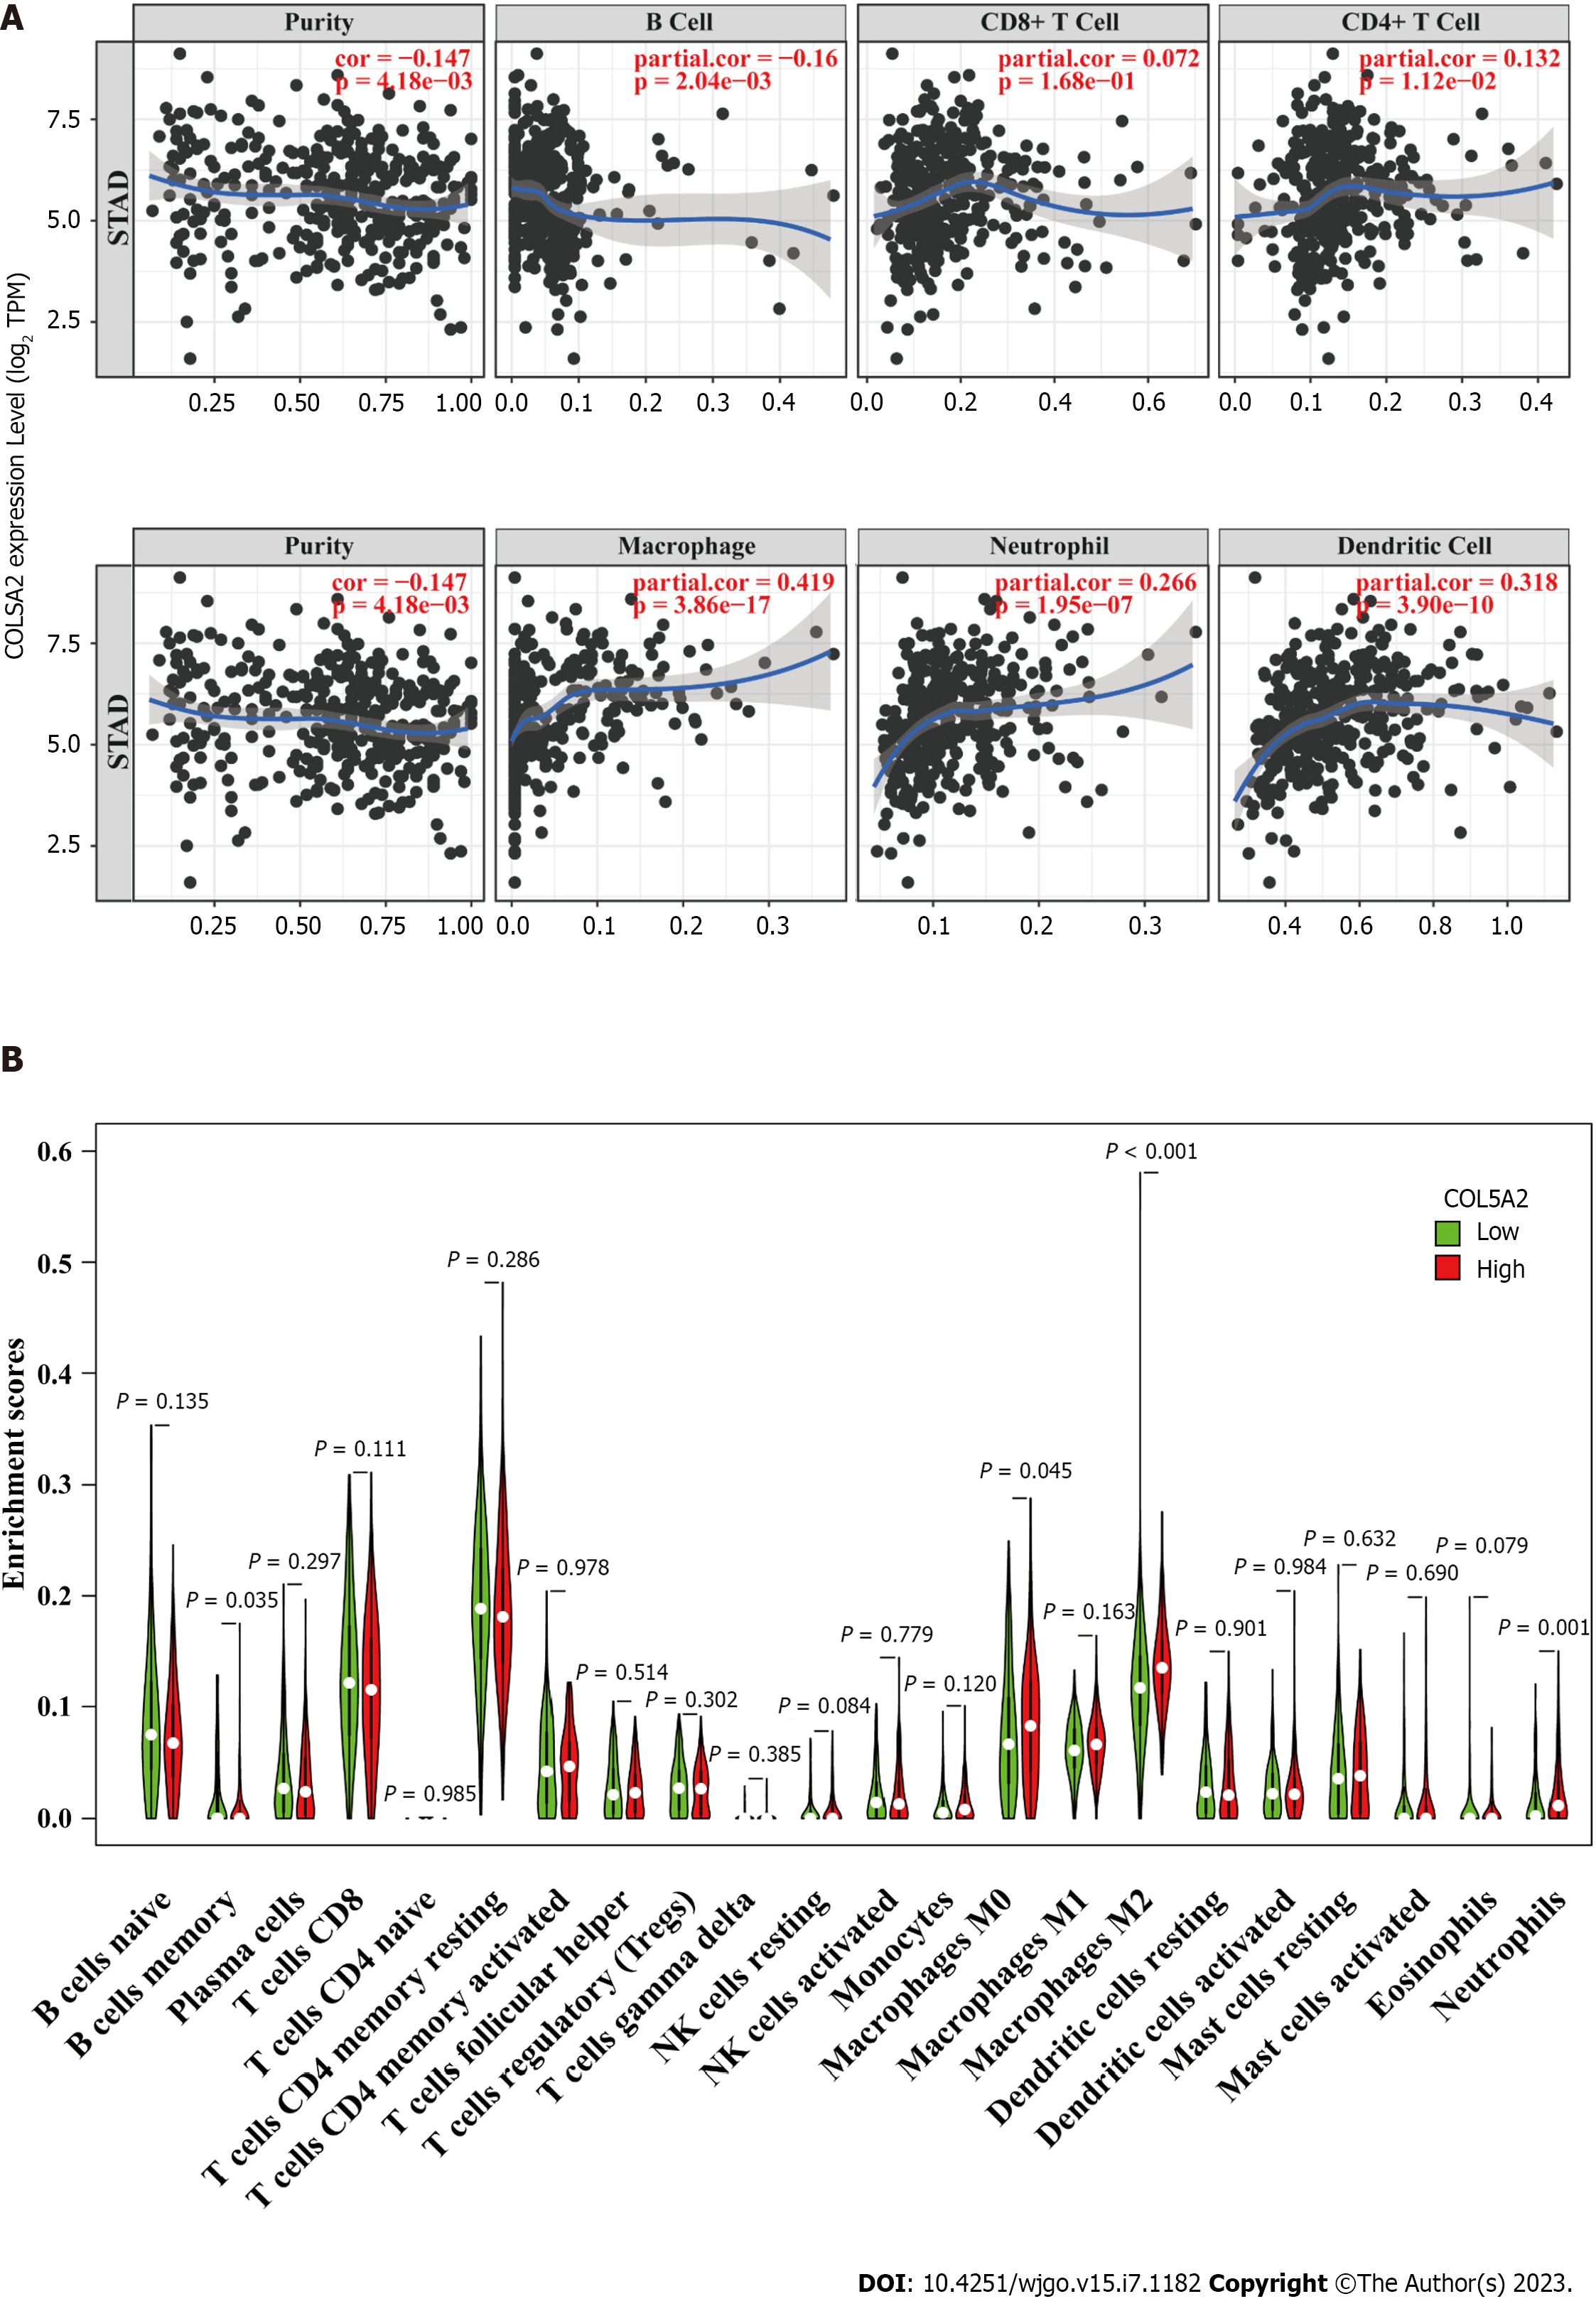
Figure 7 COL5A2 was associated with immune cell infiltration.
A: Tumor Immune Estimation Resource database to analyze the correlation between COL5A2 and immune cells adjusted by tumor purity; B: Enrichment of 22 kinds of immune cells in the COL5A2 high and low expression group, n = 376.
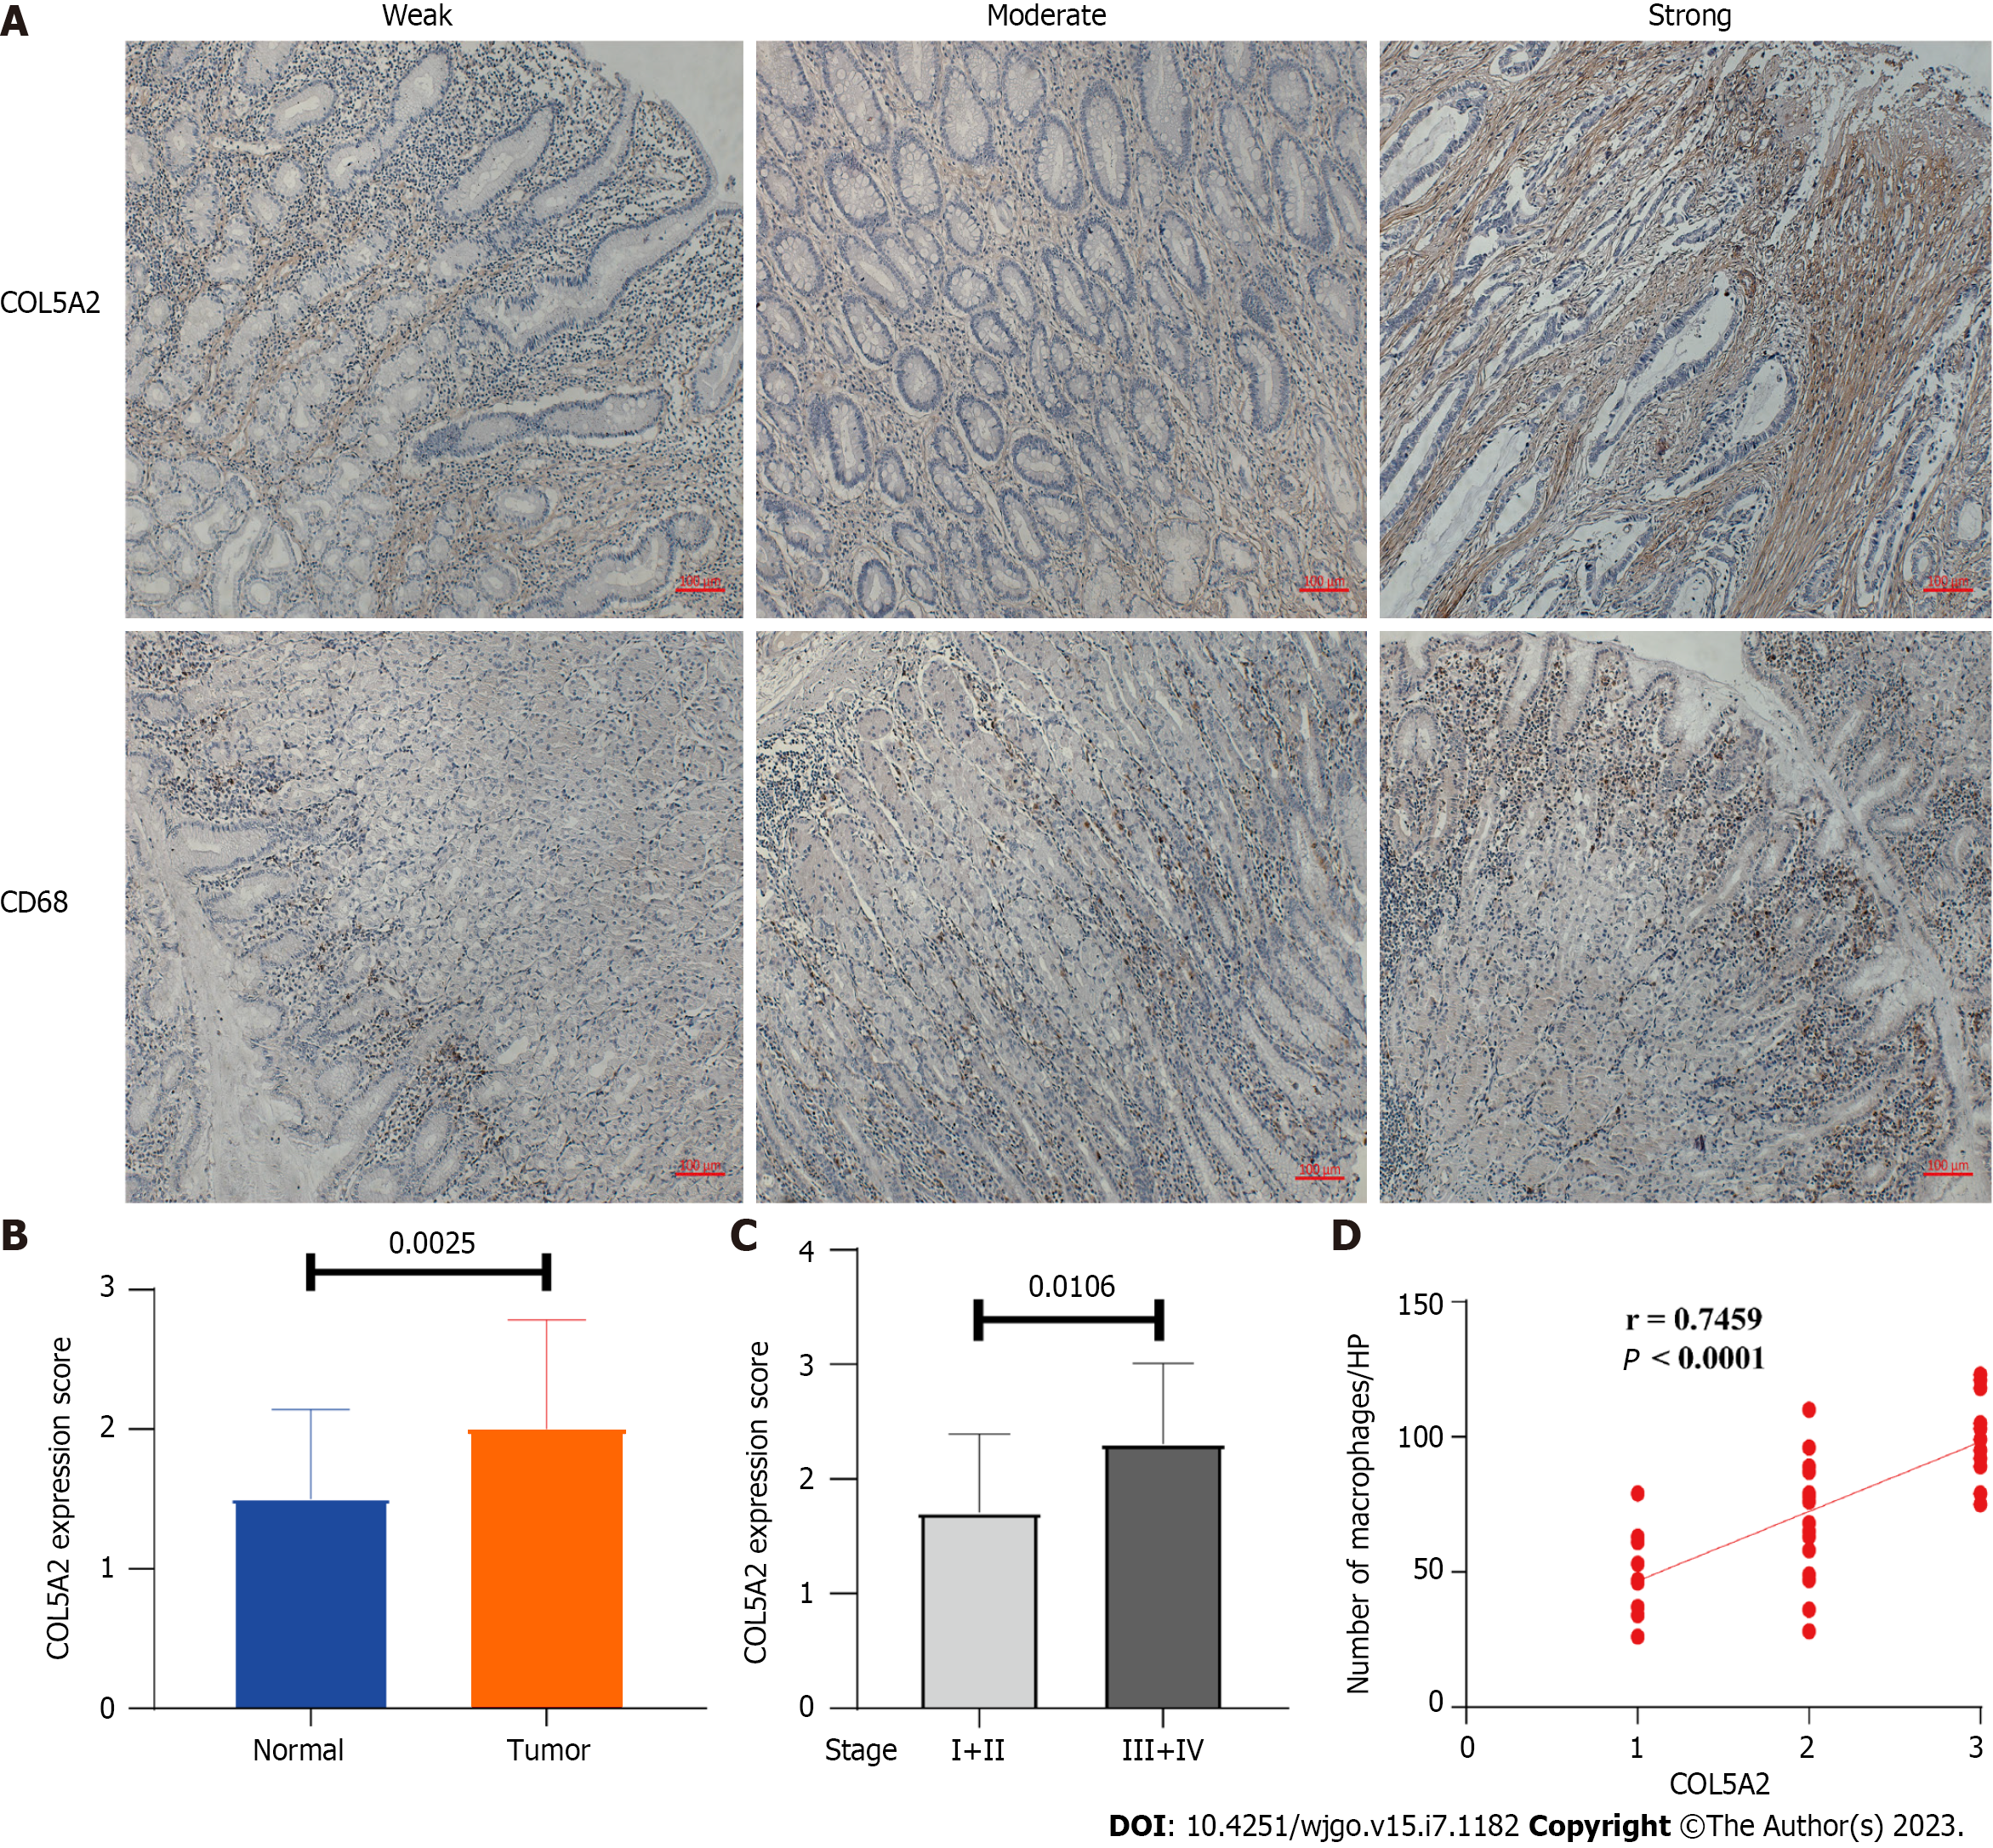
Figure 8 COL5A2 was upregulated in gastric cancer and closely related to macrophage infiltration.
A: Expression of COL5A2 and macrophages (CD68+) in gastric cancer (GC) and normal tissues by immunohistochemistry. Weak, moderate and strong were assessed by scoring staining intensity or average number of CD68+ cells/high power field, respectively; B: Protein expression of COL5A2 in paired tumor and nontumor tissues, n = 40; C: Expression of COL5A2 in low stage (I and II) and high stage (III and IV) GC, n = 40; D: Correlation between COL5A2 and macrophages in GC tissue was analyzed with Spearman correlation, n = 40. HP: High power field.
- Citation: Yuan HM, Pu XF, Wu H, Wu C. ENTPD1-AS1–miR-144-3p-mediated high expression of COL5A2 correlates with poor prognosis and macrophage infiltration in gastric cancer. World J Gastrointest Oncol 2023; 15(7): 1182-1199
- URL: https://www.wjgnet.com/1948-5204/full/v15/i7/1182.htm
- DOI: https://dx.doi.org/10.4251/wjgo.v15.i7.1182


