Copyright
©The Author(s) 2022.
World J Gastrointest Oncol. Sep 15, 2022; 14(9): 1785-1797
Published online Sep 15, 2022. doi: 10.4251/wjgo.v14.i9.1785
Published online Sep 15, 2022. doi: 10.4251/wjgo.v14.i9.1785
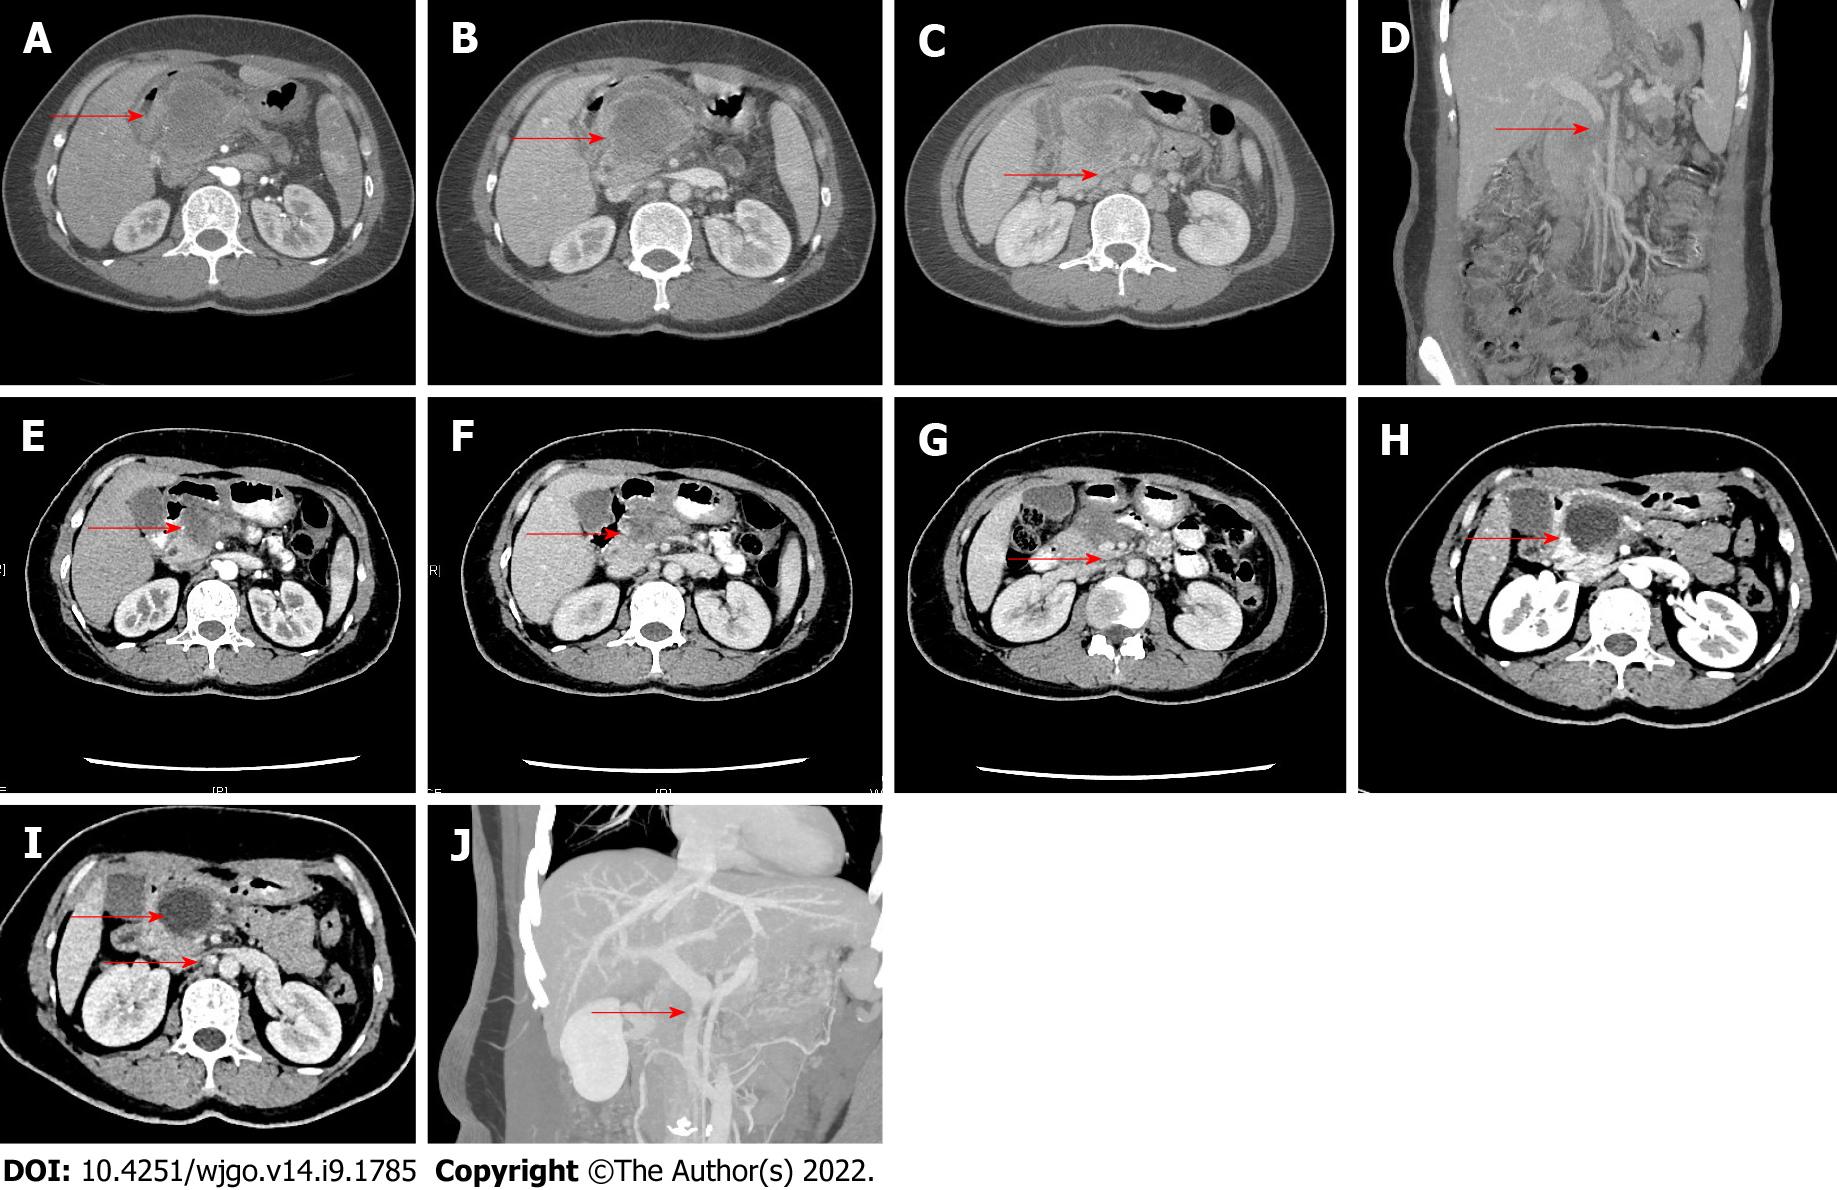
Figure 1 Computed tomography changes in pancreatic cancer before and after neoadjuvant chemotherapy.
A-C: Computed tomography (CT) before neoadjuvant chemotherapy revealed pancreatic cancer with multiple lymph node metastases (red arrow); D: Pancreatic cancer invaded the portal vein wall (red arrow); E-G: After 2 cycles of neoadjuvant chemotherapy, CT showed a decreased diameter of pancreatic cancer and a reduced number of lymph nodes (red arrow); H and I: After 4 cycles of neoadjuvant chemotherapy, CT showed an obviously decreased diameter of pancreatic cancer and a reduced number of retroperitoneal lymph nodes; J: The superior mesenteric vein had a regular shape.
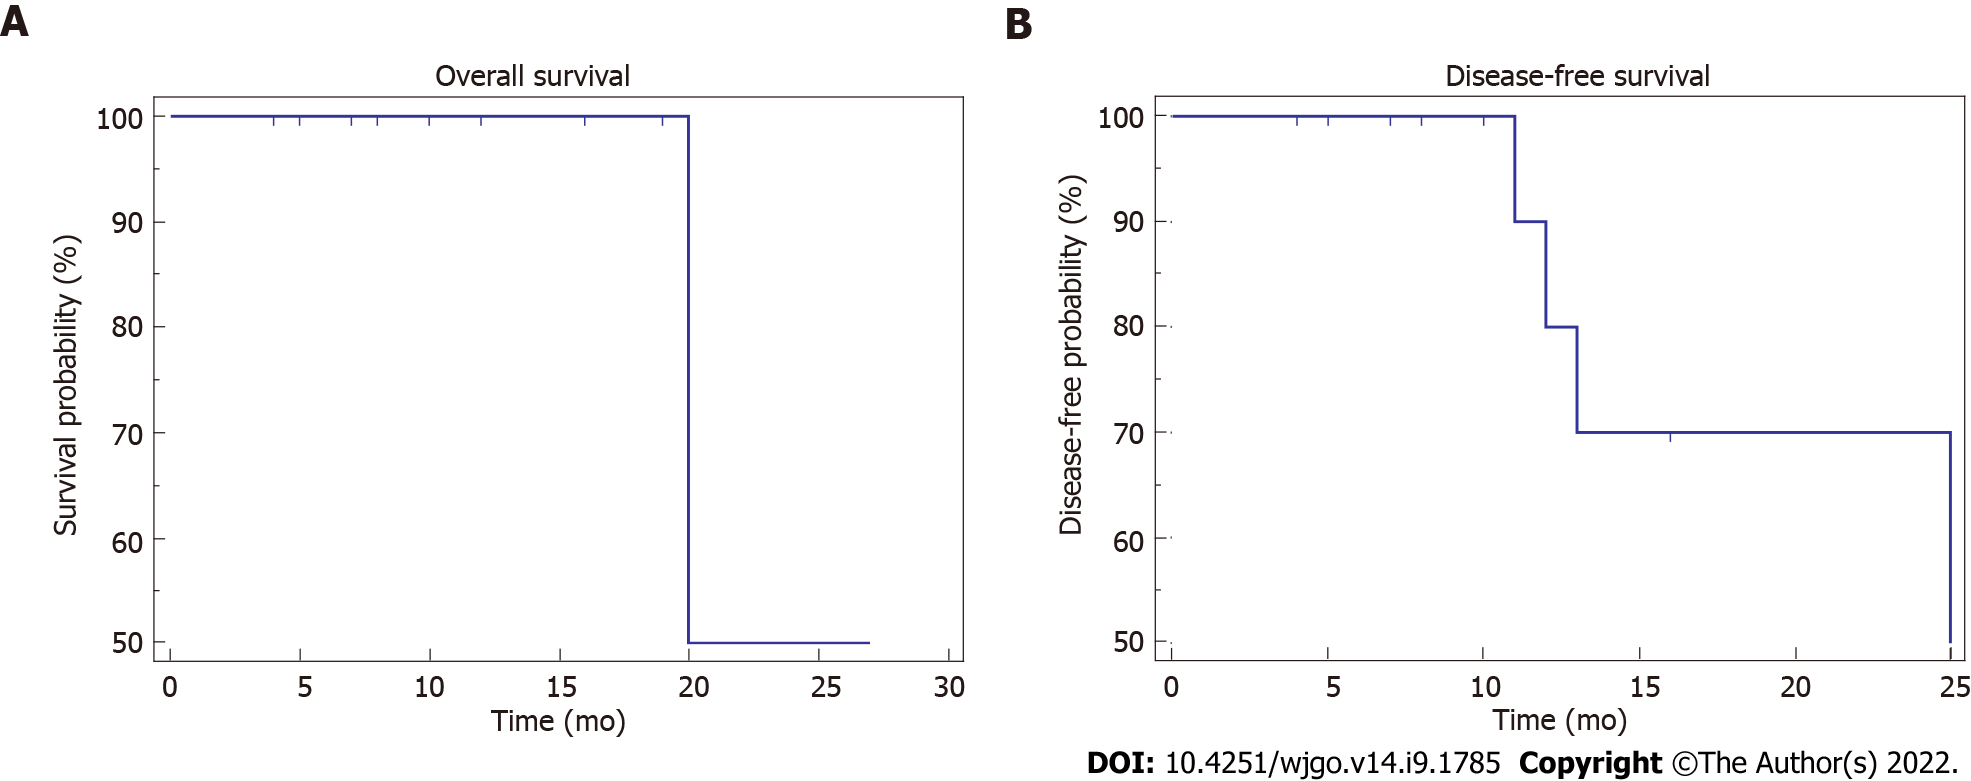
Figure 2 Kaplan-Meier curves of overall survival and disease-free survival.
A: The 1- and 2-year survival rates were both 50%; B: The 1- and 2-year disease-free survival rates were 60.00% and 40.00%, respectively.
- Citation: He YG, Huang XB, Li YM, Li J, Peng XH, Huang W, Tang YC, Zheng L. Efficacy and safety of laparoscopic radical resection following neoadjuvant therapy for pancreatic ductal adenocarcinoma: A retrospective study. World J Gastrointest Oncol 2022; 14(9): 1785-1797
- URL: https://www.wjgnet.com/1948-5204/full/v14/i9/1785.htm
- DOI: https://dx.doi.org/10.4251/wjgo.v14.i9.1785


